![]()
Prev Page--Conclusions || Next Page--References
Appendix A: Literature review on atrazine and nitrate
Agricultural use of pesticides in the United States nearly tripled between 1964 and 1984, with herbicides accounting for 82% of all the pesticides used on major field and forage crops in 1982 (Nielson and Lee, 1987). The finding of agrichemicals in a variety of aquifers indicates a non-point-source problem. In Iowa atrazine is detected in shallow wells in Pleistocene and alluvial aquifers (Kelley et al., 1986). In addition, it was found that agrichemical concentrations vary temporally and generally increase in response to increased infiltration (Thompson et al., 1986). The detection of atrazine in ground water and soils in the winter and spring before new application suggests that the chemical persists in the subsoil and then leaches through the soil during winter or spring recharge (Hallberg, 1986b).
Numerous studies in Nebraska indicate a slow general increase in atrazine concentrations in areas of sandy soil and irrigation, primarily in the central Platte River basin, where corn is grown. The concentrations are low (0.2-0.8 µg/L), but the persistence suggests that degradation is slow once the chemical arrives in the aquifer (Wehtje et al., 1981, 1983; Junk et al., 1980). Stratification of atrazine in wells downgradient from irrigated corn fields in Nebraska reveals an essentially non-point-source distribution.
The U.S. Department of Agriculture reports that 10.6 million tons of nitrogen fertilizer is used annually in the United States (Hurlburt, 1988). The use of inorganic nitrogen fertilizers, a major source of nitrate contamination in ground water, increased fourfold between 1960 and 1980 (Nielson and Lee, 1987). Studies in Iowa indicate that nitrate concentrations have increased tenfold in direct response to increased fertilization (Thompson et al., 1986). Statistics from the Kansas State Board of Agriculture (1988) indicate that from 1951 to 1987 there was an eight-fold increase in the use of all classes of fertilizers. In Kansas 500,000 tons of nitrogen fertilizer was reported sold for the fall and spring of 1986-1987.
One of the areas of the United States that is most vulnerable to nitrate-nitrogen contamination is the Central Great Plains. The use of the DRASTIC index (Aller et al., 1985) indicates that Kansas falls in a region of high to moderate nitrate levels in ground water in agricultural areas (Nielson and Lee, 1987). Studies in Kansas indicate that low levels of 2,4-D, atrazine, and nitrate are present in ground water in parts of the state (Heiman et al., 1987; Stulken et al., 1987). However, the occurrence of pesticide chemicals has not been shown to be widespread. In a statistically representative study of 103 Kansas farmstead wells (used for domestic and farm purposes), Heiman et al. (1987) showed that 3% of the wells had atrazine but that 28% had nitrate levels above the recommended level of 45 mg/L as nitrate. Their study suggested that wells in northeast, north-central, and south-central Kansas had a higher probability of nitrate contamination than those in other sections of the state. No statistical relationship was found between geologic ground-water area and nitrate concentration in ground water. The study showed that the effects of age of the well, location of possible organic contaminant sources, and land-use practices were the most useful predictors of contamination for the wells studied. The effects of fertilizer nitrogen as a source of nitrate were not evaluated.
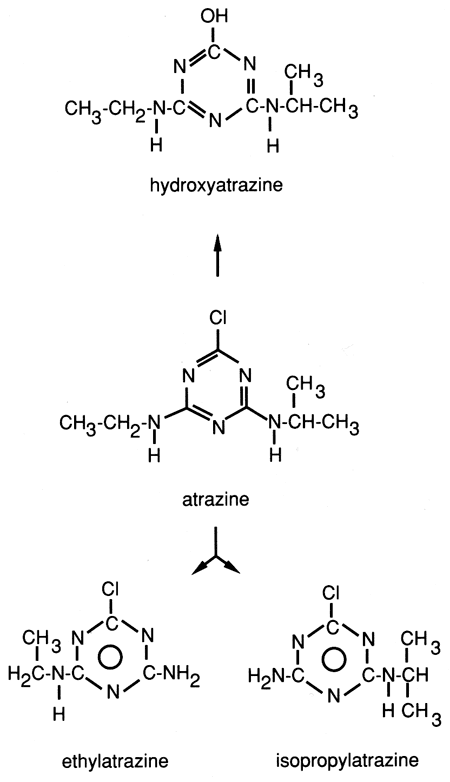
Atrazine
Chemistry of atrazine
The structure of the atrazine molecule is 2-chloro-4-ethylamino-6-isopropylamino-s-triazine. This structure means that a chlorine ion is attached to the number 2 carbon atom of a triazine ring (composed of three nitrogen atoms and three carbon atoms with double bonds at the 2, 4, and 6 positions of the ring; fig. A.1), the ethylamino group (-NH-C2H5) is attached to the number 4 carbon atom, and the isopropylamino group (-NH-C3H7) is attached to the number 6 carbon atom (Hassall, 1982; Sheets, 1970; Harris, 1967). Work by Sheets (1970) indicates that the triazine structure is most responsible for the persistence of these chemicals. in soil or water. A methoxy (-OCH3) group substitution at the number 2 carbon position in the triazine ring is considered more persistent than a chlorine or methylthio (SCH3) substitution.
Figure A.1--Structure and nomenclature for atrazine and its degradation by-products.
Solubility
Properties of a chemical that influence its movement are solubility in water, acidity (pKa) or basicity (pKb) of the molecule (the pH of the solution relative to the pK affects the form in which the chemical is dissolved), the charge distribution on the organic molecule, and the shape and configuration of the molecule (Bailey and White, 1970; Sheets, 1970). Various researchers have reported conflicting results on whether the solubility of the compound has a primary influence on movement through or adsorption onto the soil. Bailey and White (1964), Burnside et al. (1963), and Bailey et al. (1968) indicate that the solubility of the chemical in water has a direct effect on the rate at which the chemical will move through soil. Bailey et al. (1968) found that the magnitude of adsorption of triazines to Na-montmorillonites is directly related to their solubility in water. The most soluble chemicals adsorb the tightest to montmorillonite. The triazines and their relative solubilities in order of decreasing adsorption capability are simetone (3200 mg/L), atratone (1654 mg/L), prometone (750 mg/L), atrazine (33 mg/L), trietazine (20 mg/L), and propazine (8.6 mg/L). Rodgers (1962) found a distinct lack of correlation between solubility and leachability. He also found that soil type can alter the order of leachability of triazines. In his studies, atrazine, with a solubility of 33 mg/L, moved farther than simazine (5 mg/L), atratone (1654 mg/L), or ipatone (100 mg/L). Helling (1970) used thin-layer chromatography to demonstrate the relative movement of different families of chemicals in a silty clay loam soil. In Helling's study atrazine was in the middle of the group in terms of mobility. He found in his literature search that there is much debate about the effects of solubility on the leachability of various chemicals.
Chemical degradation
The breakdown of atrazine occurs by either microbial degradation or chemical hydrolysis. Whether chemical degradation or microbial degradation is the principal method is still being debated.
Chemical breakdown of atrazine to hydroxyatrazine is catalyzed by adsorption onto montmorillonite and/or organic matter (Harris, 1967; Armstrong et al., 1967; Russell et al., 1968; Armstrong and Chesters, 1968; Skipper et al., 1978; Li and Felbeck, 1972). Hydroxyatrazine is considered a nonphytotoxic breakdown product. In other words, this compound lacks herbicidal characteristics. Russell et al. (1968) -and Harris (1967) studied the effects of adsorption of atrazine onto montmorillonite on the rate of degradation of the chemical. The acidity of the clay surface was found to play an important role in the hydrolysis process. No degradation of atrazine was observed in a solution system at pH = 3.5 in the absence of clay, thus illustrating the catalytic function of the clay. Bailey et al. (1968) also found that adsorption of basic organic compounds onto montmorillonite-type clays depends on the surface acidity on the clay, not on the pH of the suspension.
Armstrong and Chesters (1968) and Harris (1967) also emphasize the role of catalysis resulting from adsorption onto soil colloidal surfaces. The adsorption results from hydrogen bonding between the adsorbent carboxyl group and the atrazine ring nitrogen atom. Hydrolysis occurs because of the electron deficiency of the ring carbon attached to the electronegative chlorine and positive nitrogen ions. This deficiency causes susceptibility to displacement by strong nucleophilic (positive-charge-loving) agents, such as hydroxyl ions (Armstrong et al., 1967). In a neutral pH region (pH = 7) weak nucleophilic agents such as H2O are unable to replace the chlorine on the molecule. However, hydrogen bonding to the ring nitrogen atom causes further electron withdrawal from the electron-deficient carbon atom, enabling the weak nucleophilic H2O to replace the chlorine.
Skipper et al. (1978) indicated that under acidic field conditions smectite-type clays are expected to enhance the chemical hydrolysis of atrazine. Russell et al. (1968) indicated that chemical hydrolysis occurs as a result of protonation (presence of hydrogen ions) at the colloidal surface. This was not found by Armstrong and Chesters (1968).
Soil pH and organic matter content largely control the rate of atrazine hydrolysis; for soils of similar pH, the atrazine degradation rate increases with increased atrazine adsorption (Armstrong et al., 1967). The interaction of s-triazines (atrazine in particular) with humic acid compounds was studied by Sullivan and Felbeck (1968) and Li and Felbeck (1972). They suggested that hydrogen bonding of atrazine onto humic acid decreased the energy of activation (amount of energy needed to cause the reaction to proceed) and consequently increased the rate of hydrolysis. Tests showed that 60 µmol/L atrazine mixed with 0.2 g humic acid per 10 ml H2O decomposed much faster than it did in solutions without humic acid. These studies suggest that alignment of the atrazine molecule on humic acid may play an important role in the humic acid-catalyzed hydrolysis of atrazine.
Obien and Green (1969) indicated that in four Hawaiian soils atrazine degradation is more closely related to pH (faster on low pH soils) than to organic matter content or adsorption. Degradation increased when the temperature increased from 30°C to 50°C, indicating a chemical rather than a biologic process.
Biologic degradation
Biologic degradation of atrazine results in two daughter products: deethylated atrazine (2-chloro-4-amino-6-isopropylamino-s-triazine) and deisopropylamino atrazine (2 -chloro-4-amino-6-ethyl amino-s-triazine). Deethylated atrazine is a potential herbicide that might explain the phytotoxicity of soils where analytical data indicate low levels of atrazine (Sirons et al., 1973). Sirons et al. used a soil (pH = 7) composed of 32% clay and 4.8% organic matter; the CEC was 22.8 meq/100 g. The pH is much higher than the pH found in studies of chemical hydrolysis (pH = 3.5-4.5). Sirons et al. (1973) failed to detect hydroxyatrazine in their products, leading them to believe that microbial degradation was the primary pathway. Most studies involving microbial degradation of atrazine use soils in the neutral to alkaline pH range (Sheets, 1970).
The effects of temperature are also important. Harris and Warren (~964) indicated that adsorption of atrazine increases with decreasing temperature, atrazine being more available at higher temperatures. More rapid decomposition of chloros-triazines in warm soils may be the result of a combination of conditions: increased microbial activity and increased availability and solubility of the chemical (Sheets, 1970). Roeth et al. (1969) found that chemical hydrolysis occurs first, with a subsequent microbial attack on the hydroxyatrazine form. Skipper and Volk (1972) provide additional evidence that microbes attack the hydroxyatrazine ring rather than the parent molecule.
Sheets (1970) best summarizes the debate on chemical and biologic degradation. The primary control is the soil environment. Hydrolysis of atrazine to hydroxyatrazine probably dominates at high temperature (>30°C) and low pH (<5.5). Neutral pH favors bacterial degradation. At basic pH (>8.5) hydrolysis again dominates. Low temperatures and low moisture levels are unfavorable for both routes of breakdown. Physical characteristics of the soil, aeration, amount of inorganic and organic nutrients, and quantity of clay and organic matter also play major roles in determining which process will occur.
Factors affecting movement of herbicides
Many factors influence the movement of herbicides from the surface to the ground water. Some of these are land use, agricultural practices (type of tillage used, for example), climate, hydrogeology, soil characteristics, net aquifer recharge rates, depth to water, and characteristics of the unsaturated zone and aquifer (Nielson and Lee, 1987).
The dominant controls on the movement of pesticides through soils are the pH of the soil, the quantity of organic matter and clay (particularly montmorillonite and vermiculite types), hydraulic conductivity, and soil-moisture content (Helling and Gish, 1986; Bailey and White, 1964, 1970; Helling, 1970; Yaron et al., 1985). Models, field experiments, and laboratory studies indicate that the movement of herbicides, particularly atrazine, is influenced most by hydraulic conductivity, pH, soil moisture, and amount of organic matter.
Soil pH and organic matter content
Soil pH and the percentage of organic matter in the soil are two primary controls in the breakdown process of herbicides. Armstrong et al. (1967) indicated that hydrolysis of atrazine (replacement of the chlorine atom attached to the number 2 carbon atom in the triazine ring with a hydroxyl group) into the hydroxyatrazine daughter product is controlled by pH and the percentage of organic matter in the soil. Hydrolysis is catalyzed by adsorption onto soil and by an increased concentration of HI; that is, increased acidity (lower pH) increases the hydrolysis process (see the section on chemistry of atrazine).
Hiltbold and Buchanan (1977) found that with each unit increase in soil pH atrazine persisted 9-29 days longer, depending on soil type. Bailey and White (1964) found that adsorption of herbicides with widely differing molecular structures increases as pH decreases. In addition, the bioactivity of the herbicides (ability of the herbicide to be utilized by plants) is lowest in soils that have high organic matter and clay contents and is highest in light-textured soils. Burnside et al. (1963) found that atrazine leaches the most in sandy soils with low organic matter content and pH of 6.8 and least in soils with high clay and organic matter contents and low pH. Soils with low pH tend to cause increased adsorption onto clays or organic matter and thus encourage chemical hydrolysis (Frissel and Bolt, 1962; Weber et al., 1969; McGlamery and Slife, 1966).
Many studies have indicated that increased organic matter content and cation-exchange capacity and an acidic environment enhance the adsorption of herbicides onto soils (Armstrong et al., 1967; Bailey and White, 1964, 1970; Hayes, 1970; Helling and Gish, 1986; McGlamery and Slife, 1966; Talbert and Fletchall, 1965). The studies indicate that statistically and experimentally the adsorption of herbicides is best predicted by the amount of organic matter in the soil.
Soil-moisture content
Soil moisture is another property that may affect the breakdown potential of a herbicide. Several studies indicate that decreased soil moisture results in increased adsorption of herbicides to the soil (Bailey and White, 1964; Dao and Lavy, 1978). Lower soil moisture may result in the adsorption of the chemical onto the soil or the precipitation of the chemical if the ratio of water to chemical is below the substance's equilibrium solubility. An increase in the concentration of salts in the solution causes a decrease in the solubility of the herbicide and a resulting increase in adsorption of the chemical onto the soil (Hurle and Freed, 1972; Swanson and Dutt, 1973; Dao and Lavy, 1978).
Temperature
Studies of the effects of temperature on the adsorption of herbicides onto soil have yielded mixed results. Bailey and White (1964) found increased adsorption of herbicides onto soil with increased temperature. They believe that seasonal variation in temperature acts as a brake for the release of the chemical over time. Later, Bailey and White (1970) suggested that increased temperature causes a decrease in adsorption of herbicides because of effects on the solubility of the chemical and vapor pressure effects. Harris and Warren (1964) and McGlamery and Slife (1966) found that more atrazine desorbed at temperatures of 50°C or 70°C than at O°C for a soil with 30% vermiculite clay and 6.8% organic matter. These researchers also concluded that the effect of temperature is less than the effect of pH on the adsorption process.
The results are quite different for humic acid. Adsorption increases at 40°C to nearly twice the amount at 0.5°C. This is the opposite of what occurs with the mineral system. The percentage of recovery of atrazine from humic acid increases when the pH increases to 7 but is small when the pH is low.
Dao and Lavy (1978) found that increased temperature results in increased adsorption of the chemical as a result of temperature effects on solubility and vapor pressure. Low temperatures yield a higher concentration of chemical in the soil water. This is contrary to what other researchers have found. Hayes (1970) found that more atrazine is adsorbed at low temperatures (20°C) than at high temperatures (70°C). Harris and Warren (1964) found that adsorption of atrazine onto organic soils is the same at 50°C and O°C. Talbert and Fletchall (1965) found that, as temperature increases, adsorption of atrazine decreases.
Hydraulic conductivity
A model developed by Helling and Gish (1986) indicates that hydraulic conductivity is the most important factor affecting the movement of atrazine through a soil, with organic matter content and bulk density the next important factors. Plots of available data indicate that movement of atrazine increases with increases in hydraulic conductivity. A survey of the literature by Helling and Gish showed the occurrence of atrazine in ground water in areas with sandy alluvial soils, in karst regions, and in permeable soils in general (Nebraska and Iowa, for example). Schneider et al. (1977) showed that atrazine accidentally introduced into a fine-grained sandy aquifer will move but can be recovered by pumping within 10 days of the last injection. Wehtje et al. (1981, 1983) showed the presence of small quantities of atrazine downdip from heavily irrigated com-producing areas with sandy soils in Nebraska. Downward leaching through sandy soils with little clay or silt is considered the primary route of entry into the aquifer. Only 0.07% of the chemical applied reaches the aquifer. The researchers postulate that the rest is removed by chemical hydrolysis.
Nitrate
Chemical processes affecting nitrate
There have been many articles written about the occurrence of nitrate and other nitrogen compounds in ground water. The major forms of dissolved nitrogen are NO3- (nitrate), NO2- (nitrite), NH4+ (ammonium ion), NH3 (ammonia), N2 (nitrogen), N2O (nitrous oxide), and organic nitrogen. Organic nitrogen is nitrogen that is incorporated in organic substances (Freeze and Cherry, 1979).
Nitrate can enter the ground-water system directly as nitrate from wastes or fertilizers or can be converted by oxidation of ammonium ion from organic matter or fertilizers. The process of oxidation of ammonium ion to nitrite is called nitrification:
NH4+ + (3/2)O2 -> NO2- + 2H+ + H2O. A.1)
This process usually occurs in the unsaturated zone and is frequently aided by bacterial action. Nitrite is rather unstable and will be either reduced or oxidized. In the presence of oxygen, nitrobacteria aid in the oxidation of nitrite to nitrate:
2NO2- + O2 → 2NO3-. (A.2)
Under oxidizing conditions in ground water, nitrate is the dominant form of nitrogen. Nitrate is highly mobile in ground water with no transformation and little or no retardation as a result of its anionic state (Freeze and Cherry, 1979). With a decline in oxygen content of the water, denitrification of nitrate to nitrite can occur. If the dissolved oxygen content of the ground water remains low, the nitrite may be reduced to nitrous oxide, to nitrogen gas, or even to ammonium ion. Denitrification most frequently occurs in the unsaturated zone, where high organic matter content, abundant nitrate, and appropriate bacteria are available. There has been little work done on denitrification processes in ground water itself.
Nitrate and nitrite anions are not absorbed by clay soils because both the soil particles and the anions have a negative charge. The ammonium ion has a positive charge and so can bind to negatively charged clay particles. The ammonium ion can be oxidized at a later time by microorganisms to nitrate or nitrite and thus move through the soil-water system. The mineralization process acts as a potential future source of nitrate-nitrogen if conditions change and the nitrogen is mobilized by oxidation of the ammonium ion to nitrate.
Exner and Spalding (1979) showed that in sandy loam soils in Holt County, Nebraska, there are measurable differences between irrigated areas with non-point sources of contamination, areas with point-source contamination (such as septic systems or feedlots), and areas with pristine ground water. Additional evaluation of the water chemistry from areas with non-point-source contamination indicates that higher concentrations of nitrate correspond to increases in sulfate and chloride. All these ions are added to cultivated fields mainly as anhydrous ammonia, liquid nitrogen, potash salts (KCl and K2SO4), and sulfamag (MgSO4 - K2SO4). The positive correlation between sulfate and nitrate and between chloride and nitrate implies that the dissolution of concentrated anionic sources, such as commercial fertilizers, is a major source of nitrate in this area.
Sources of nitrate in soils and ground water
Hurlburt (1988), in a feature article in a recent issue of Water Well Journal, used interviews with various investigators to discuss the problem of nitrate contamination in ground water. Researchers in Canada, Arizona, and Nebraska all indicate that agricultural use of nitrogen fertilizers may be a major contributor to non-point-source nitrate contamination in ground water. The mechanics of how the contamination occurs varies from region to region. In Canada and Nebraska there is evidence that nitrate contamination occurs in sandy, well-drained soils (Hill, 1982; Spalding et al., 1980). Work in Iowa indicates a major problem with leaching of nitrates and pesticides in areas of thin soil cover and subsurface karst. There is a direct correlation between rate of application, precipitation events, and quantity of contaminants found in the ground-water system (Hallberg, 1986a).
Spalding (1984) showed that movement of nitrate in sandy soils in Nebraska is strongly influenced by precipitation and irrigation return flows. There is a decrease in nitrate with depth in the aquifer. The upper part of the shallow aquifer is the most affected by contamination. The lower values in the deeper part of the aquifer are due to slow vertical movement.
High nitrate concentrations are also found in ground water beneath fine-grained sediments. Spalding and Kitchen (1988) showed that fine-grained soils are not enough to prevent leaching when excess nitrogen is applied to soil. In theory, the vertical movement of water through fine-textured clayey silts should be relatively slow, as should the transport of applied nitrate that has leached through the crop rooting zone. Spalding and Kitchen demonstrated that over a 15-year period nitrate had moved at least 60 ft (18 m) through fine-grained sediments and that up to 1200 lb (540 kg) nitrogen per acre had accumulated in the vadose zone beneath a test site treated with 400 lb (180 kg) nitrogen per acre per year. The storage of this amount of nitrate in fine-grained sediments indicates probable future non-point-source nitrate contamination in underlying ground water.
Stratification of nitrate in ground water is seen in alluvial wells in Iowa and Nebraska (Thompson et al., 1986; Spalding, 1984). In addition, temporal and spatial variations are prominent in both these areas. The soils and aquifer materials tend to be sands and gravels with occasional clay and silt lenses. Stratification of higher nitrate concentration in the shallow ground water with decreasing concentration with depth may be due to lack of vertical flow or denitrification.
A survey of nitrate-nitrogen concentrations in ground water in Merrick County, Nebraska, by Spalding et al. (1978) indicated good correlation between coarse-textured soils and high nitrate-nitrogen levels. The primary suspected source for the nitrate-nitrogen is commercial nitrogen fertilizer on irrigated corn. Spalding et al. also found that high nitrate-nitrogen levels correlated with water use but not with well construction. The areas of low, medium, and high nitrate-nitrogen concentration were related to intensity of irrigation.
In Nebraska a survey of soil cores under native rangeland and irrigated corn in sandy soils showed that the concentration of nitrate in the soil beneath the irrigated site was an order of magnitude higher than the concentration at the native rangeland site (Hergert, 1982). In another study in Nebraska on management of nitrogen in sandy soils, Hergert (1978) showed that normal precipitation will move any residual nitrate deeper into the soil during the winter and early spring. This nitrogen is essentially lost for crop production. One cannot rely on residual nitrate-nitrogen in sandy soils to fertilize the next crop because it is susceptible to leaching (nitrate movement). Two keys for nitrogen management in sandy soils were offered: The quantity of nitrogen applied must be adjusted to the amount that plants will take up during different periods of their development, and the timing and amount of irrigation water must be regulated. Hergert (1978) showed that the use of nitrogen fertilizer in the irrigation system enabled the quantity of nitrogen applied to be keyed more tightly to the needs of the crop being grown.
Geologic nitrogen
Geologic nitrate-nitrogen (nitrogen associated with certain geologic formations of sedimentary origin) in the deep loess deposits of southwestern and central Nebraska is another possible source for nitrate migration to ground water (Boyce et al., 1976). Boyce et al. found nitrate at depths of 7-30 in (23-98 ft). Nitrate-nitrogen values ranged from 25 mg/kg to 45 mg/kg but values up to 87 mg/kg (5.6 tons/acre to 91-ft depth) have been reported. The leaching of the nitrate has been related to increased irrigation in this region. Other possible sources for nitrate are nitrification of organic nitrogen in paleosols within the soil zone, generation of nitrate in surface soils during periods of drought in which nitrification rates were greater than plant uptake and after which leaching occurred, and fixed ammonium released and nitrified over the recent geologic past.
Strathouse et al. (1980) in the San Joaquin Valley of California showed the association of different chemical forms of nitrogen with different sedimentary facies. One basin had fine-grained sediments with a high organic matter content and therefore more organically bound nitrogen as a primary source of nitrogen. Total nitrogen and nitrate concentrations increased from older to younger geologic sediments. The other basin consisted of coarse clastic sediments with a high total nitrogen concentration; the nitrogen occurred in the fixed-ammonium phase bound to smectite clays. The source of nitrogen from that basin was fixed ammonium bound to layer silicates. Strathouse et al. concluded that sediment type (lithology) and Eh conditions were the major controls on the formation and movement of nitrate-nitrogen in different sedimentary rocks and soils.
Keeney (1986) summarized other studies of sources of geologic nitrogen. Shales are a source of nitrogen in South Dakota, Montana, and California. Natural soil nitrate has been identified as a source of nitrate contamination in Runnels County, Texas. The increased use of irrigation and soil and water conservation practices, such as terracing, has caused increased movement of nitrate in dryland farming areas of Texas, Nebraska, and California.
Nitrate and chloride profiles as indicators of movement
Various researchers use the Cl/NO3-N ratio or the inverse ratio as an indicator of the movement of the two ions through the unsaturated zone to ground water and as an indicator of the occurrence of denitrification in the soil profile. Others use separate profiles of the two ions to compare movement to ground water. There does not seem to be a standard method to evaluate collected data. A summary of each type of study is given in what follows. Investigators who use the ratio method for determination of denitrification processes usually deal with either coarse sediments or clay and organic-matter-rich sediments.
Endelman et al. (1974) showed that loamy sand is highly susceptible to leaching by rainfall or irrigation, with a resultant loss of nitrate and chloride from fertilizers used at the site. The nitrate-nitrogen and chloride moved 15-20 cm/d (16-18 in./d) under a 2.5-cm (1-in.) daily water application. The similarity of the profiles of these two ions in the soil indicates that chloride is a possible tracer for the movement of nitrate-nitrogen and also a good indicator of the loss of nitrate throtigh denitrification.
Lund (1982) studied the variation in concentration of nitrate-nitrogen and chloride in ground water below four agricultural fields with sandy loam soils to evaluate the spatial and temporal variations of these ions in the unsaturated zone. At all sites spatial variation was found. Spatial variation in leaching rates of soil solutions results in nonuniform movement of nitrate and chloride pulses below the root zone.
In Nebraska the overall rate of increase of nitrate-nitrogen in ground water beneath fine-grained sediments thicker than 100 ft (30 m) is 0.1-0.2 mg/L/yr. This is a small increase when compared with the rate in sandy soils with shallow ground water (0.4-1.0 mg/L/yr; Spalding, 1984), but it indicates that fine-grained and vadose sediments do not adequately prevent contamination of ground water. Spalding and Kitchen (1988) showed that in 15 years nitrate moved vertically at least 60 ft (18 m) through fine-textured unsaturated sediments in Nebraska.
Smith and Davis (1974) showed that bromide and nitrate move at similar rates unless some denitrification occurs. They suggested using bromide instead of chloride as a tracer because of the common occurrence of chloride in soils, rocks, fertilizers, precipitation, etc. Work with soil columns shows that movement of the two anions in surface soils is not similar as a result of mineralization of the nitrogen or denitrification. In the subsoils the breakthrough curves for both anions are similar. Autoclaving the surface soils results in breakthrough curves similar to those for the subsoils, indicating the role of microbial action on the movement of nitrate through the soils.
Use of Cl/NO3-N (or NO3-N/Cl) ratios
Kimble et al. (1972) indicate that the NO3-N/Cl ratio decreases at all depths from fall to spring, suggesting that denitrification rather than leaching is responsible for a significant portion of nitrate loss. Because both nitrate and chloride are anions, neither would be held by negatively charged soil particles and both should move through the soil at a similar rate. Kimble et al. showed a significant decrease in nitrate-nitrogen with depth, whereas the chloride content stayed constant or increased because of previous applications of fertilizers. A comparison of applications of NH4NO3 fertilizer with dairy manure indicates that more nitrate is lost by leaching when nitrogen is applied as inorganic fertilizer than as dairy manure because of the greater potential for denitrification in the manure.
Gambrell et al. (1975) studied denitrification processes in well-drained and poorly drained soils in North Carolina. In the well-drained soil the carbon content was 2-5 mg/L, the Eh was in the well-oxidized range (500-700 mV), and the lack of saturated conditions for extended periods of time resulted in movement of much of the nitrogen into the shallow ground water. The poorly drained soil had an Eh < 300 mV and a carbon content of 10-15 mg/L. These conditions are sufficient to cause denitrification of the residual nitrate-nitrogen from fertilizer. Little nitrate moved from this soil into shallow ground water. The NO3-N/Cl ratios also indicate a marked decrease in nitrate concentration with depth.
In California Devitt et a]. (1976) chose six sites with different soil characteristics to evaluate the effect of soil profile characteristics on the movement of nitrate-nitrogen to ground water. There were three sites with coarse-textured sandy soils and three sites with fine clayey soils. Soil-moisture samplers were used to collect the water. The coarse-textured soils had high redox potentials throughout and low denitrification potential. Nitrate moved downward in these profiles as a result of irrigation. The Cl/NO3-N ratio for the coarse soils was fairly constant with depth, indicating that the primary source of nitrate was fertilizer and that the nitrate was moving through the system and not being denitrified. In the clayey soils the ratio increased with depth, indicating that denitrification was occurring. The redox potential near the clay zones was well within the range necessary for denitrification to occur.
Cameron et al. (1979) showed that in a well-drained sandy soil Cl/NO3-N ratios indicate predominant loss by leaching rather than by denitrification. Occasionally the nitrate-nitrogen loss is less than the chloride loss during a particular time period, indicating that nitrate is produced by nitrification of fertilizer ammonium nitrogen and from mineralization. Nitrogen and chloride losses were associated with irregular diffuse bulges rather than with distinct peaks of solute moving steadily downward. The bulges appeared to be directly related to rainfall events.
Saffigna and Keeney (1977) studied the distribution of nitrate and chloride in ground water under irrigated farms in the sand plains of Wisconsin. The soils used in this study were classified as sandy loam. The study showed that both chloride and nitrate concentrations were significantly higher than background levels. There was a wide variation in nitrate and chloride values between wells in any given area, but the Cl/NO3-N ratio was much less variable. In most areas where sandy soil is fanned, potassium chloride and nitrogen fertilizers are applied in roughly equal proportions. Saffigna and Keeney assumed that more of the nitrogen than chloride was removed with the harvested crop, and therefore a Cl/NO3-N ratio greater than 1 was acceptable.
Both Hill (1982) and Egboka (1984) did regional surveys of nitrate and chloride in areas of Canada. Hill found that the Cl/NO3-N ratio was fairly constant under potato fields in sandy soils. The nitrate content of groundwater under poorly drained soils (pastureland and woodlands) was low, indicating that denitrification had occurred. Regression analysis revealed a significant positive correlation between the nitrate-nitrogen concentration in ground water and the average rate of fertilizer application in the area. A positive association between the ground-water chloride concentration and the rate of potassium chloride fertilizer application together with consistent Cl/NO3-N ratios in ground water under potato farms suggests that fertilizer is the major source of nitrate in the aquifer. Egboka (1984) surveyed several watersheds and potential point sources for nitrate concentration with depth. He found that an increase in the Cl/NO3-N ratio indicates that denitrification has occurred at depth. The rate of application of potassium chloride and nitrogen fertilizers was approximately the same. He also found that areas with a deep water table and sandy soils would have no effect on the ratio and the movement of nitrate into the aquifer.
Appendix B: Chemical analysis methodology
Determination of atrazine in soil
Reference method 3550 was used to determine the concentration of atrazine in soil. The method is described by the U.S. Environmental Protection Agency (1986b). Analyses performed according to this method use 50.0 g of sample, which is sonicated with 200 ml of 1:1 hexane:acetone. The extract is decanted, concentrated to dryness, and the residue taken up in 10.0 ml hexane. The extract is scanned and quantitated using a Hewlett-Packard (HP) 5890A Gas Chromatograph with an HP 5970 Mass Selective Detector in the single-ion monitoring mode set specifically for atrazine.
Determination of atrazine in water
Reference method 507 was used to determine the concentration of atrazine in water. The method is described by the U.S. Environmental Protection Agency (1986a). In this method a 1-L volume of sample (or volume available diluted to 1 L) is extracted with methylene chloride; the extract is dried through anhydrous sodium sulfate, concentrated to dryness, and the residue taken up in 5.0 ml hexane. The extract is scanned for atrazine using a Hewlett-Packard 5710 Gas Chromatograph with a Nitrogen/Phosphorus Detector. Any sample extracts testing positive for atrazine are reconfirmed and quantitated using a Hewlett-Packard (HP) 5890A Gas Chromatograph with an HP 5970 Mass Selective Detector in the single-ion monitoring mode set specifically for atrazine.
Determination of atrazine and its two dealkylated metabolites (G-30033 and G-28279) in soil
Reference method CHR-2.1 was used to determine the concentration of atrazine and its metabolites in soil. The method was developed by the Minnesota Valley Testing Laboratories (1986a). In this method atrazine and its dealkylated metabolites are extracted from soil by refluxing with a solution of acetonitrile and water (90:10). The extract is evaporated and the residues dissolved in acetone. Atrazine and metabolite concentrations are determined by capillary column gas chromatography with flame thermionic detection and external standard quantitation. The method is sensitive to 0.05 mg/kg of soil.
Determination of hydroxyatrazine (G-34048) in soil
Reference method CHR-3 was used to determine the concentration of hydroxyatrazine in soil. The method was developed by the Minnesota Valley Testing Laboratories (1986b). In this method hydroxyatrazine is extracted from soil by Soxhlet extraction using a solution of methanol and water (80:20). The extract is cleaned by solvent partitions and column chromatography to remove nonpolar triazines and other interferences. The final aqueous solution containing the hydroxyatrazine is chromatographed by using paired-ion reversed-phase high-performance liquid chromatography. Residues are quantitated by ultraviolet absorption at 240 nm. The method is sensitive to 0.05 mg/kg of soil.
Bromide determination
We used an automated colorimetric method to measure bromide concentration in water. In earlier determinations in our study we had followed the automated phenol red method involving segmented-flow analysis described by Basel et al. (1982) and further modified by Whittemore (personal communication, 1987). For later measurements we used the automated fluorescein method of the U.S. Geological Survey (Fishman and Friedman, 1985) because it is more accurate near the detection limit for natural waters. To automate both methods, we used a Technicon AutoAnalyzer II, consisting of an autosampler, a proportioning pump, an appropriate analytical cartridge, a spectrophotometer, and a strip chart recorder. We corrected chloride concentrations for the bromide in the sample because of bromide interferences in chloride determinations. The detection limit for both methods is 10 µ/L.
Inorganic analyses
The inorganic analyses (except bromide determination) were performed by the Analytical Services Section of the Kansas Geological Survey. The calculated standard deviation in the analytical methods is based on individual duplicate analyses of water samples collected in the Equus beds region of Kansas in 1980 (Hathaway et al., 1980). Duplicate samples were not collected for the current study.
Initial nitrate concentrations were obtained using ultraviolet absorption spectroscopy with an analytical error of ±3-4 mg/L (L. R. Hathaway, personal communication, 1988). Once the initial level was established, we used standard colorimetric autoanalyzer techniques to determine nitrate (±0.2 mg/L), sulfate (±1.5 mg/L), chloride (±2.1 mg/L), and sometimes phosphate (±0.03 mg/L) and ammonia concentrations. Cations (Ca 2+, ±0.08 mg/L; Mg2+, ±0.04 mg/L; Na+, ±2.2 mg/L; K+, ±0.2 mg/L) were measured with a Jarrel-Ash inductivity-coupled plasma (ICP) unit, and bicarbonate (±0.4 mg/L) was measured by potentiometric titration using an autotitrimeter. We measured pH at the same time. Specific conductance (11 µS/cm) was measured in the laboratory with a Labline meter at 25°C.
Sample collection
We collected water samples for major and minor ion analysis in a 500-ml unacidified polyethylene bottle and, for nitrate determination, in a 200 ml acidified polyethylene bottle. All samples were stored on ice in the field and transported that way to the laboratory. The samples were refrigerated until analyzed. We collected atrazine samples from the wells in 1-gal acid-washed bottles supplied by the Kansas State Board of Agriculture and from the lysimeters in 1-L or smaller acid-washed and acetone-rinsed brown bottles with Teflon seals.
We measured specific conductance, pH, and temperature in the field whenever possible. The wells were either bailed dry and allowed to recover or were bailed sufficiently to remove several casing volumes of water. We used a Teflon bailer for sampling; it was rinsed with acetone and deionized water between uses.
Appendix C: Water chemistry analyses
Table C.1--Site 6 water chemistry.
| Date (mo-d-yr) |
Depth (ft) |
Lab or field spec. cond. (µS/cm) |
Field pH |
Lab pH |
TDS calc. (mg/L) |
Water temp. (°C) |
Ca (mg/L) |
Mg (mg/L) |
Na (mg/L) |
K (mg/L) |
Sr (mg/L) |
HCO3 (mg/L) |
SO4 (mg/L) |
Cl (mg/L) |
NO3 (mg/L) |
PO4 (mg/L) |
NH4 (mg/L) |
Br (mg/L) |
|---|---|---|---|---|---|---|---|---|---|---|---|---|---|---|---|---|---|---|
| Wells | ||||||||||||||||||
| 6-22-1987 | 20 | 2450 | 8.0 | 1258 | 211 | 31 | 218 | 5.8 | 1.4 | 275 | 33 | 594 | 29 | 1.9 | 0.2 | |||
| 34 | 1060 | 8.2 | 569 | 68 | 12 | 134 | 5.0 | 0.5 | 319 | 39 | 147 | 6.6 | 0.2 | 0.3 | ||||
| 45 | 870 | 8.3 | 471 | 67 | 7.1 | 113 | 3.6 | 0.4 | 291 | 26 | 110 | 0.8 | 0.1 | <0.1 | ||||
| 54 | 960 | 7.9 | 522 | 70 | 7.1 | 128 | 3.7 | 0.4 | 281 | 27 | 145 | 2.4 | 0.2 | <0.1 | ||||
| 8-6-1987 | 20 | 2450 | 619 | 0.60 | ||||||||||||||
| 34 | 1030 | 133 | 0.19 | |||||||||||||||
| 9-3-1987 | 20 | 2500 | ||||||||||||||||
| 34 | 1150 | |||||||||||||||||
| 45 | 760 | |||||||||||||||||
| 9-9-1987 | 20 | 2475 | 7.15 | 7.5 | 1280 | 17.5 | 211 | 29 | 240 | 5.1 | 1.3 | 305 | 41 | 582 | 21 | 2.0 | 0.1 | 0.57 |
| 34 | 1075 | 7.65 | 8.0 | 544 | 19.0 | 76 | 13 | 115 | 5.5 | 0.6 | 351 | 38 | 120 | 3.0 | 0.75 | 0.2 | 0.29 | |
| 45 | 765 | 7.65 | 7.8 | 419 | 17.0 | 66 | 6.8 | 91 | 3.8 | 0.4 | 286 | 23 | 80 | 7.3 | 0.27 | 0.2 | 0.30 | |
| 9-16-1987 | 20 | 4250 | ||||||||||||||||
| 9-18-1987 | 20 | 4020 | 7.10 | 16.0 | 1076 | 1.37 | ||||||||||||
| 34 | 1000 | 7.55 | 16.0 | 116 | 0.22 | |||||||||||||
| 45 | 760 | 7.75 | 16.0 | 80 | 0.15 | |||||||||||||
| 9-22-1987 | 20 | 4100 | ||||||||||||||||
| 9-25-1987 | 20 | 3800 | ||||||||||||||||
| 10-1-1987 | 20 | 4100 | ||||||||||||||||
| 34 | 1000 | |||||||||||||||||
| 45 | 780 | |||||||||||||||||
| 10-6-1987 | 20 | 3890 | 7.25 | 7.6 | 2113 | 17.0 | 346 | 49 | 397 | 7.0 | 2.1 | 300 | 94 | 1050 | 19 | 0.24 | 0.1 | 1.17 |
| 34 | 970 | |||||||||||||||||
| 45 | 770 | |||||||||||||||||
| 10-9-1987 | 20 | 3880 | ||||||||||||||||
| 10-14-1987 | 20 | 3800 | 7.4 | 2085 | 15.5 | 342 | 49 | 387 | 6.5 | 2.1 | 298 | 83 | 1050 | 19 | 0.87 | 0.1 | 1.18 | |
| 34 | 980 | |||||||||||||||||
| 45 | 780 | |||||||||||||||||
| 10-20-1987 | 20 | 3800 | 7.9 | 18.0 | 342 | 48 | 376 | 6.9 | 2.1 | 296 | 77 | 1037 | 19 | |||||
| 45 | 780 | 8.1 | 18.0 | 67 | 7.2 | 95 | 4.5 | 0.4 | 289 | 25 | 89 | 0.4 | ||||||
| 10-27-1987 | 20 | 3750 | ||||||||||||||||
| 45 | 780 | |||||||||||||||||
| 11-10-1987 | 20 | 3400 | 7.7 | 1922 | 13.0 | 319 | 45 | 355 | 7.5 | 2.0 | 300 | 70 | 957 | 19 | ||||
| 45 | 790 | 8.0 | 439 | 13.0 | 66 | 7.2 | 99 | 4.4 | 0.4 | 291 | 25 | 94 | 0.2 | 0.22 | ||||
| 11-30-1987 | 20 | 2890 | ||||||||||||||||
| 12-17-1987 | 20 | 3120 | ||||||||||||||||
| 2-16-1988 | 20 | 3000 | 7.6 | 1595 | 10.0 | 269 | 37 | 294 | 5.6 | 1.6 | 296 | 50 | 771 | 21 | 0.23 | 1.1 | 0.91 | |
| 34 | 1015 | 7.8 | 547 | 11.0 | 100 | 14 | 94 | 6.1 | 0.7 | 362 | 37 | 109 | 8.6 | <0.1 | 0.2 | 0.15 | ||
| 45 | 830 | 8.0 | 448 | 10.0 | 62 | 6.9 | 108 | 3.7 | 0.4 | 285 | 24 | 102 | 1.1 | 0.1 | 0.3 | 0.12 | ||
| 5-4-1988 | 20 | 2845 | 7.15 | 7.8 | 1499 | 15.0 | 257 | 35 | 275 | 5.7 | 1.6 | 292 | 46 | 713 | 22 | 0.62 | ||
| 34 | 945 | 7.45 | 7.9 | 525 | 18.0 | 96 | 13 | 90 | 5.8 | 0.6 | 353 | 35 | 97 | 14 | 0.20 | |||
| 45 | 860 | 7.40 | 7.9 | 453 | 17.5 | 60 | 7.0 | 110 | 3.8 | 0.4 | 282 | 25 | 108 | 0.5 | 0.16 | |||
| 8-3-1988 | 34 | 950 | 7.50 | 8.0 | 524 | 20.0 | 98 | 13 | 91 | 6.0 | 0.6 | 346 | 34 | 97 | 14 | <0.1 | 0.2 | 0.10 |
| 45 | 710 | 7.20 | 7.7 | 410 | 21.5 | 71 | 6.9 | 79 | 3.6 | 0.4 | 272 | 21 | 81 | 13 | <0.1 | <0.1 | 0.07 | |
| 9-13-1988 | 20 | 3000 | 7.60 | 20.0 | 816 | 21 | 0.88 | |||||||||||
| 34 | 980 | 7.35 | 22.0 | 108 | 14 | 0.10 | ||||||||||||
| 11-2-1988 | 20 | 2950 | 6.60 | 20.0 | 758 | 21 | ||||||||||||
| 6-23-1987 Stafford water |
660 | 8.2 | 359 | 72 | 5.3 | 61 | 4.1 | 0.3 | 224 | 18 | 77 | 11 | 0.1 | <0.1 | ||||
| 8-6-1987 Stafford water |
975 | 157 | 0.14 | |||||||||||||||
| 9-3-1987 Stafford water |
1010 | 7.4 | 542 | 83 | 9.5 | 114 | 3.1 | 0.5 | 250 | 43 | 157 | 8.7 | 0.13 | <0.1 | 0.16 | |||
| 1-30-1989 SW well |
1220 | 7.9 | 72 | 7.9 | 177 | 3.4 | 0.4 | 258 | 34 | 223 | 0.4 | |||||||
| 1-30-1989 West well |
1050 | 7.7 | 71 | 7.0 | 141 | 3.5 | 0.4 | 241 | 30 | 187 | 0.1 | |||||||
| 1-30-1989 Albert well |
990 | 7.9 | 63 | 6.1 | 137 | 3.1 | 0.4 | 265 | 28 | 162 | <0.1 | |||||||
| Lysimeters | ||||||||||||||||||
| 9-9-1987 | 1 | 173 | ||||||||||||||||
| 2 | 327 | |||||||||||||||||
| 4 | 329 | 0.16 | ||||||||||||||||
| 5 | 311 | |||||||||||||||||
| 9-10-1987 | 0.5 | 835 | 7.95 | 22.0 | 123 | |||||||||||||
| 1 | 1000 | 7.55 | 22.0 | 163 | ||||||||||||||
| 2 | 1550 | 8.15 | 23.0 | 286 | 8.3 | |||||||||||||
| 3 | 2440 | 8.15 | 23.0 | 288 | 0.20 | |||||||||||||
| 4 | 3850 | 8.15 | 24.0 | 454 | 0.38 | |||||||||||||
| 5 | 2350 | 8.15 | 21.5 | 322 | ||||||||||||||
| 6 | 2080 | 8.05 | 21.0 | 294 | ||||||||||||||
| 9-15-1987 | 1 | 985 | 7.95 | 21.0 | 149 | |||||||||||||
| 2 | 1530 | 8.15 | 8.00 | 877 | 22.0 | 44 | 16 | 293 | 3.3 | 0.4 | 381 | 73 | 258 | 1.7 | 0.35 | <0. 1 | 0.07 | |
| 3 | 3200 | 8.15 | 7.80 | 2049 | 22.0 | 60 | 24 | 745 | 5.2 | 0.5 | 1087 | 317 | 363 | <0.1 | 0.24 | <0.1 | 0.22 | |
| 4 | 4300 | 8.15 | 22.5 | 526 | 1.0 | 0.67 | ||||||||||||
| 5 | 2300 | 8.15 | 23.0 | 297 | 5.8 | |||||||||||||
| 6 | 1520 | 8.35 | 23.0 | 216 | 0.03 | |||||||||||||
| 9-15-1987 Bromide solution |
1450 | 7.45 | 23.5 | 381 | 376 | |||||||||||||
| 9-16-1987 Peace Creek upstream |
615 | 8.65 | 8.15 | 334 | 21.0 | 48 | 5.5 | 69 | 14 | 0.3 | 149 | 22 | 102 | 0.1 | 0.67 | 0.1 | ||
| 9-16-1987 Peace Creek downstream |
515 | 8.15 | 8.30 | 279 | 25.0 | 47 | 5.2 | 49 | 14 | 0.2 | 154 | 18 | 69 | 1.1 | 0.94 | 0.1 | ||
| 9-18-1987 | 1 | 1500 | 7.6 | 18.5 | 149 | 325 | ||||||||||||
| 2 | 1440 | 18.5 | 205 | 13.4 | ||||||||||||||
| 3 | 2630 | 8.05 | 17.5 | 280 | 6.3 | |||||||||||||
| 5 | 1900 | 8.40 | 16.5 | 227 | 5.0 | |||||||||||||
| 6 | 1860 | 8.30 | 16.5 | 190 | 6.9 | |||||||||||||
| 8-3-1988 | 6 | 3850 | 7.90 | 26.5 | 178 | 388 | 13.8 | |||||||||||
| All analyses except bromide performed by the KGS Analytical Services Section. | ||||||||||||||||||
Table C.2--Site 7 water chemistry.
| Date (mo-d-yr) |
Depth (ft) |
Lab or field spec. cond. (µS/cm) |
Field pH |
Lab pH |
TDS calc. (mg/L) |
Water temp. (°C) |
Ca (mg/L) |
Mg (mg/L) |
Na (mg/L) |
K (mg/L) |
Sr (mg/L) |
HCO3 (mg/L) |
SO4 (mg/L) |
Cl (mg/L) |
NO3 (mg/L) |
PO4 (mg/L) |
NH4 (mg/L) |
Br (mg/L) |
|---|---|---|---|---|---|---|---|---|---|---|---|---|---|---|---|---|---|---|
| Wells | ||||||||||||||||||
| 6-23-1987 | 30 | 1240 | 8.10 | 689 | 127 | 19 | 81 | 2.6 | 0.6 | 370 | 29 | 106 | 142 | 0.4 | 0.2 | |||
| 50 | 730 | 8.00 | 397 | 94 | 8.4 | 31 | 4.6 | 0.3 | 237 | 17 | 66 | 59 | 0.2 | 0.1 | ||||
| 70 | 620 | 8.20 | 359 | 97 | 6.5 | 23 | 4.2 | 0.3 | 229 | 15 | 37 | 63 | 0.2 | 0.1 | ||||
| 8-6-1987 | 30 | 1175 | 15.0 | 108 | 0.17 | |||||||||||||
| 9-10-1987 | 30 | 1225 | 7.15 | 7.80 | 701 | 16.0 | 156 | 18 | 75 | 2.4 | 0.6 | 404 | 34 | 104 | 112 | 0.17 | 0.1 | 0.13 |
| 50 | 810 | 7.25 | 7.70 | 437 | 15.0 | 115 | 9.4 | 29 | 4.7 | 0.3 | 248 | 18 | 79 | 60 | 0.23 | <0.1 | 0.15 | |
| 70 | 590 | 7.55 | 7.60 | 336 | 16.0 | 91 | 6.1 | 22 | 4.2 | 0.3 | 222 | 15 | 33 | 55 | 0.17 | 0.1 | 0.04 | |
| 9-30-1987 | 30 | 93 | ||||||||||||||||
| 10-1-1987 | 30 | 96 | ||||||||||||||||
| 10-6-1987 | 30 | 1220 | 7.45 | 7.90 | 711 | 19.0 | 159 | 18 | 78 | 2.4 | 0.6 | 404 | 34 | 103 | 117 | 0.21 | 0.1 | 0.16 |
| 10-7-1987 | 50 | 770 | 7.65 | 7.80 | 434 | 17.0 | 117 | 9.2 | 29 | 4.5 | 0.3 | 243 | 17 | 74 | 64 | 0.22 | <0.1 | 0.15 |
| 70 | 580 | 7.55 | 7.80 | 337 | 17.0 | 92 | 6.2 | 22 | 3.5 | 0.3 | 223 | 15 | 32 | 56 | 0.17 | <0.1 | 0.11 | |
| 10-8-1987 | 30 | 1190 | 16 | 115 | .17 | |||||||||||||
| 10-9-1987 | 30 | 1165 | 13 | .21 | ||||||||||||||
| 10-10-1987 | 30 | 1160 | 8.00 | 695 | 13.2 | 157 | 18 | 74 | 2.7 | 0.6 | 402 | 36 | 101 | 108 | 0.31 | <0.1 | 0.12 | |
| 10-12-1987 | 30 | 1140 | 7.70 | 676 | 158 | 18 | 70 | 2.3 | 0.6 | 401 | 36 | 97 | 97 | <0.1 | <0.1 | |||
| 10-15-1987 | 30 | 1140 | 8.00 | 692 | 13.0 | 158 | 18 | 73 | 2.7 | 0.6 | 399 | 36 | 103 | 105 | 0.95 | 0.1 | ||
| 10-20-1987 | 30 | 1140 | 8.0 | 666 | 154 | 18 | 71 | 3.1 | 0.6 | 401 | 35 | 96 | 91 | |||||
| 50 | 760 | 8.0 | 432 | 115 | 9.1 | 28 | 4.4 | 0.3 | 242 | 17 | 76 | 63 | ||||||
| 11-10-1987 | 30 | 1150 | 8.00 | 678 | 14.0 | 141 | 17 | 76 | 2.7 | 0.5 | 408 | 35 | 97 | 108 | 0.11 | |||
| 50 | 750 | 8.00 | 418 | 13.0 | 111 | 8.7 | 28 | 5.0 | 0.3 | 239 | 16 | 68 | 63 | 0.13 | ||||
| 2-17-1988 | 30 | 1120 | 7.70 | 646 | 11.0 | 150 | 17 | 69 | 1.9 | 0.5 | 401 | 38 | 86 | 86 | <0.1 | <0.1 | 0.10 | |
| 50 | 740 | 7.80 | 418 | 11.0 | 112 | 8.7 | 27 | 3.7 | 0.3 | 233 | 16 | 73 | 63 | 0.13 | 0.1 | 0.14 | ||
| 70 | 490 | 7.70 | 301 | 10.0 | 82 | 5.5 | 20 | 3.5 | 0.3 | 217 | 14 | 25 | 44 | 0.22 | 0.1 | 0.05 | ||
| 5-4-1988 | 30 | 1060 | 7.70 | 634 | 15.5 | 148 | 16 | 69 | 1.9 | 0.5 | 395 | 37 | 83 | 84 | 0.09 | |||
| 50 | 760 | 7.05 | 7.80 | 424 | 16.0 | 118 | 8.4 | 26 | 2.7 | 0.3 | 238 | 16 | 72 | 64 | 0.13 | |||
| 70 | 560 | 7.40 | 7.70 | 316 | 16.5 | 87 | 5.9 | 19 | 3.4 | 0.3 | 224 | 14 | 25 | 51 | 0.06 | |||
| 8-2-1988 | 30 | 1000 | 7.10 | 7.60 | 636 | 21.0 | 143 | 16 | 75 | 2.5 | 0.5 | 404 | 39 | 76 | 85 | <0.1 | 0.2 | 0.28 |
| 50 | 810 | 7.05 | 7.80 | 459 | 20.0 | 124 | 10 | 29 | 4.0 | 0.4 | 249 | 18 | 84 | 67 | <0.1 | <0.1 | 0.15 | |
| 70 | 600 | 7.10 | 7.80 | 362 | 20.0 | 96 | 6.6 | 21 | 3.9 | 0.3 | 223 | 15 | 32 | 63 | 0.16 | 0.1 | 0.07 | |
| 9-14-1988 | 30 | 1100 | 22.0 | 80 | 85 | 0.21 | ||||||||||||
| 50 | 860 | 7.25 | 23.0 | 88 | 70 | 0.17 | ||||||||||||
| 9-27-1988 | 30 | 1100 | 7.55 | 21.0 | 38 | 82 | 85 | 0.16 | ||||||||||
| 11-2-1988 | 30 | 1100 | 7.20 | 20.0 | 84 | 85 | ||||||||||||
| 11-3-1988 Irrigation well |
500 | 7.7 | 277 | 69 | 5.4 | 26 | 3.1 | 0.3 | 200 | 13 | 33 | 29 | <0.05 | |||||
| Lysimeters | ||||||||||||||||||
| 9-3-1987 | 2 | 448 | 7.45 | 26.0 | 21 | <0.05 | ||||||||||||
| 3 | 448 | 6.45 | 24.0 | 29 | <0.05 | |||||||||||||
| 4 | 538 | 6.7 | 24.5 | 17 | 0.07 | |||||||||||||
| 5 | 620 | 6.85 | 24.0 | 33 | 0.06 | |||||||||||||
| 6 | 568 | 7.65 | 28.0 | 41 | <0.05 | |||||||||||||
| 9-10-1987 | 0.5 | 80 | 46 | |||||||||||||||
| 2 | 463 | 7.95 | 24.0 | 24 | 22 | |||||||||||||
| 3 | 490 | 7.75 | 7.00 | 266 | 24.0 | 49 | 11 | 38 | 4.9 | 0.3 | 215 | 18 | 28 | 11 | 0.1 | 0.1 | ||
| 4 | 525 | 7.15 | 6.80 | 309 | 25.0 | 47 | 11 | 58 | 1.9 | 0.3 | 246 | 25 | 19 | 26 | 0.05 | 0.1 | ||
| 5 | 640 | 7.75 | 23.0 | 33 | 41 | |||||||||||||
| 6 | 714 | 7.85 | 25.0 | 46 | 56 | |||||||||||||
| 9-30-1987 | 0.5 | 118 | ||||||||||||||||
| 2 | 32 | |||||||||||||||||
| 3 | 17 | |||||||||||||||||
| 5 | 49 | |||||||||||||||||
| 6 | 54 | |||||||||||||||||
| 5-4-1988 | 2 | 1210 | 6.65 | 15.0 | 127 | |||||||||||||
| 3 | 1220 | 6.85 | 16.0 | 103 | ||||||||||||||
| 4 | 1300 | 6.85 | 15.5 | 77 | ||||||||||||||
| 5 | 950 | 7.35 | 16.0 | 45 | ||||||||||||||
| 6 | 990 | 6.8 | 16.0 | 135 | 106 | 84 | ||||||||||||
| 6-15-1988 | 3 | 116 | 113 | 239 | ||||||||||||||
| 6 | 1800 | 7.90 | 1082 | 78 | 21 | 298 | 0.3 | 0.6 | 496 | 75 | 81 | 110 | 0.05 | <0.1 | 170 | |||
| 8-2-1988 | 4 | 1125 | 6.55 | 27.0 | 45 | 82 | 48 | 0.3 | <0.1 | 246 | ||||||||
| 5 | 1200 | 6.85 | 26.5 | 26 | 93 | 63 | <0.1 | 0.1 | 176 | |||||||||
| 6 | 980 | 6.95 | 7.50 | 577 | 30.0 | 99 | 23 | 61 | 1.7 | 0.7 | 136 | 27 | 90 | 105 | <0.1 | 0.2 | 184 | |
| 9-12-1988 | 0.5 | 56 | 15.6 | |||||||||||||||
| 2 | 118 | 75 | ||||||||||||||||
| 3 | 1310 | 174 | 139 | |||||||||||||||
| 4 | 1150 | 111 | 275 | |||||||||||||||
| 5 | 81 | 198 | ||||||||||||||||
| 6 | 950 | 73 | 172 | |||||||||||||||
| 9-14-1988 | 1 | 850 | 7.10 | 25.0 | 67 | 15.5 | ||||||||||||
| 3 | 1020 | 7.30 | 23.5 | 119 | 0.3 | 69 | ||||||||||||
| 9-16-1988 | 0.5 | 61 | 13.8 | |||||||||||||||
| 1 | 67 | 15.7 | ||||||||||||||||
| 2 | 84 | 0.3 | 36 | |||||||||||||||
| 3 | 125 | 70 | ||||||||||||||||
| 4 | 118 | 283 | ||||||||||||||||
| 5 | 95 | 196 | ||||||||||||||||
| 6 | 81 | 183 | ||||||||||||||||
| 9-27-1988 | 1 | 770 | 25.5 | 0.5 | ||||||||||||||
| 2 | 900 | 23.0 | 0.4 | |||||||||||||||
| 3 | 1080 | 6.55 | 22.0 | 60.0 | 139 | <0.1 | 83 | |||||||||||
| 4 | 1200 | 6.45 | 22.0 | 50.0 | 131 | <0.1 | 281 | |||||||||||
| 5 | 1150 | 21.0 | 21.0 | 106 | 0.5 | 225 | ||||||||||||
| 6 | 975 | 6.65 | 20.0 | 1.2 | ||||||||||||||
| 11-1-1988 | 0.5 | 735 | 21.0 | 54 | 11.8 | |||||||||||||
| 4 | 1225 | 22.0 | 142 | 1.1 | 269 | |||||||||||||
| 5 | 1105 | 23.5 | 104 | 0.3 | 203 | |||||||||||||
| 11-3-1988 | 0.5 | 56 | 13.2 | |||||||||||||||
| 1 | 75 | 19.0 | ||||||||||||||||
| 3 | 77 | 30 | ||||||||||||||||
| 6 | 89 | 189 | ||||||||||||||||
| All analyses except bromide performed by the KGS Analytical Services Section. | ||||||||||||||||||
Table C.3--Site 10 water chemistry.
| Date (mo-d-yr) |
Depth (ft) |
Lab or field spec. cond. (µS/cm) |
Field pH |
Lab pH |
TDS calc. (mg/L) |
Water temp. (°C) |
Ca (mg/L) |
Mg (mg/L) |
Na (mg/L) |
K (mg/L) |
Sr (mg/L) |
HCO3 (mg/L) |
SO4 (mg/L) |
Cl (mg/L) |
NO3 (mg/L) |
PO4 (mg/L) |
NH4 (mg/L) |
|---|---|---|---|---|---|---|---|---|---|---|---|---|---|---|---|---|---|
| Wells | |||||||||||||||||
| 6-24-1987 | 90 | 360 | 8.20 | 287 | 55 | 7.1 | 11 | 2.0 | 0.4 | 144 | 41 | 8.2 | 12 | 0.1 | <0.1 | ||
| 8-6-1987 | 60 | 240 | 4.6 | ||||||||||||||
| 90 | 240 | 3.7 | |||||||||||||||
| 9-17-1987 | 55 | 400 | 7.65 | 7.90 | 228 | 16.5 | 48 | 6.5 | 28 | 6.5 | 0.3 | 165 | 23 | 24 | 11 | 1.1 | <0.1 |
| 60 | 240 | 7.5 | 7.65 | 136 | 17.0 | 39 | 4.2 | 5.1 | 1.4 | 0.2 | 100 | 18 | 5.7 | 13 | 9.1 | 0.1 | |
| 65 | 300 | 7.65 | 7.90 | 166 | 16.5 | 42 | 5.0 | 12 | 2.2 | 0.2 | 118 | 25 | 9.2 | 12 | 1.8 | 0.1 | |
| 2-17-1988 | 60 | 260 | 7.80 | 142 | 12.0 | 41 | 4.2 | 5.0 | 1.4 | 0.2 | 105 | 20 | 4.1 | 14 | 0.56 | 0.1 | |
| 65 | 250 | 7.80 | 138 | 12.0 | 38 | 4.2 | 5.9 | 1.7 | 0.2 | 101 | 18 | 5.0 | 15 | 0.6 | 0.1 | ||
| 5-3-1988 | 65 | 230 | 7.25 | 7.70 | 130 | 16.0 | 36 | 4.0 | 5.1 | 1.2 | 0.2 | 97 | 17 | 3.7 | 15 | ||
| 8-2-1988 | 65 | 235 | 7.1 | 7.80 | 131 | 22.0 | 36 | 4.1 | 5.5 | 1.5 | 0.2 | 96 | 17 | 3.5 | 16 | 0.56 | 0.2 |
| Analyses performed by the KGS Analytical Services Section. | |||||||||||||||||
Table C.4--Additional chloride and bromide data for site 6. Chloride analyses perfonned by the KGS Analytical Services Section.
| Date (mo-d-yr) |
Depth (ft) |
Cl (mg/L) |
Br (mg/L) |
|---|---|---|---|
| Wells | |||
| 9-16-1987 | 20 | 1137 | 2.35 |
| 9-21-1987 | 20 | 1074 | 1.31 |
| 9-22-1987 | 20 | 1105 | 1.24 |
| 9-25-1987 | 20 | 1022 | 1.23 |
| 9-29-1987 | 20 | 1063 | 1.17 |
| 9-29-1987 | 34 | 113 | 0.29 |
| 9-29-1987 | 45 | 84 | 0.17 |
| 10-1-1987 | 20 | 1060 | 1.21 |
| 10-1-1987 | 34 | 108 | 0.27 |
| 10-1-1987 | 45 | 84 | 0.20 |
| 10-6-1987 | 34 | 107 | 0.30 |
| 10-6-1987 | 45 | 85 | 0.18 |
| 10-9-1987 | 20 | 1045 | 1.19 |
| 10-14-1987 | 34 | 109 | 0.24 |
| 10-14-1987 | 45 | 87 | 0.18 |
| 10-20-1987 | 20 | 1040 | 1.14 |
| 10-20-1987 | 45 | 89 | 0.21 |
| 10-27-1987 | 20 | 1017 | 1.16 |
| 10-27-1987 | 45 | 89 | 0.22 |
| 11-10-1987 | 20 | 957 | 1.07 |
| 12-1-1987 | 20 | 859 | 1.07 |
| 12-17-1987 | 20 | 815 | 1.04 |
| 1-20-1988 | 20 | 839 | 1.06 |
| Lysimeters | |||
| 9-15-1987(a) | 0.5 | 121 | |
| 9-15-1987(b) | 0.5 | 2.3 | |
| 9-15-1987(b) | 1 | 150 | |
| 9-15-1987(b) | 2 | 218 | 0.03 |
| 9-15-1987(b) | 3 | 296 | 0.09 |
| 9-15-1987(b) | 4 | 0.70 | |
| 9-16-1987(a) | 0.5 | 146 | 250 |
| 9-16-1987(a) | 1 | 155 | 120 |
| 9-16-1987(a) | 2 | 177 | 0.60 |
| 9-16-1987(a) | 3 | 280 | 0.18 |
| 9-16-1987(a) | 4 | 527 | 0.74 |
| 9-16-1987(a) | 5 | 259 | |
| 9-16-1987(a) | 6 | 215 | 0.03 |
| 9-16-1987(b) | 1 | 156 | 231 |
| 9-16-1987(b) | 2 | 174 | 6.8 |
| 9-16-1987(b) | 3 | 1.07 | |
| 9-16-1987(b) | 4 | 0.79 | |
| 9-16-1987(b) | 5 | 1.00 | |
| 9-16-1987(b) | 6 | 0.12 | |
| 9-17-1987 | 1 | 163 | 308 |
| 9-17-1987 | 3 | 277 | 2.9 |
| 9-17-1987 | 4 | 0.82 | |
| 9-17-1987 | 5 | 237 | 1.97 |
| 9-18-1987 | 0.5 | 346 | |
| 9-18-1987 | 1 | 149 | 325 |
| 9-18-1987 | 4 | 529 | 0.83 |
| 9-21-1987 | 3 | 259 | 13.6 |
| 9-21-1987 | 4 | 537 | 0.82 |
| 9-21-1987 | 5 | 254 | 3.4 |
| 9-21-1987 | 6 | 0.70 | |
| 9-23-1987 | 1 | 165 | 316 |
| 9-23-1987 | 2 | 179 | 32.8 |
| 9-23-1987 | 4 | 0.73 | |
| 9-23-1987 | 6 | 200 | 0.64 |
| 9-25-1987 | 1 | 153 | 312 |
| 9-25-1987 | 2 | 167 | 72 |
| 9-25-1987 | 6 | 0.73 | |
| 9-29-1987 | 4 | 553 | 1.03 |
| 9-29-1987 | 5 | 266 | 3.1 |
| 9-29-1987 | 6 | 229 | 1.16 |
| 10-1-1987 | 4 | 539 | 0.84 |
| 10-1-1987 | 5 | 264 | 3.0 |
| 10-1-1987 | 6 | 239 | 1.10 |
| 10-6-1987 | 4 | 547 | 0.91 |
| 10-6-1987 | 6 | 254 | 1.15 |
| 6-16-1988 | 1 | 117 | 197 |
| 6-16-1988 | 4 | 484 | 3.8 |
Table C.5--Additional chloride and bromide data for site 7. Chloride analyses performed by the KGS Analytical Services Section. a. Outside flooded perimeter.
| Date (mo-d-yr) |
Depth (ft) |
Cl (mg/L) |
Br (mg/L) |
|---|---|---|---|
| Wells | |||
| 10-7-1987 | 30 | 0.20 | |
| 10-13-1987 | 50 | 0.15 | |
| 10-13-1987 | 70 | 0.07 | |
| 10-20-1987 | 30 | 96 | 0.10 |
| 10-20-1987 | 50 | 76 | 0.14 |
| 10-28-1987 | 30 | 0.13 | |
| 10-28-1987 | 50 | 0.17 | |
| Lysimeters | |||
| 10-5-1987 | 0.5 | 87 | 0.05 |
| 10-7-1987(a) | 3 | 27 | 0.08 |
| 10-7-1987(a) | 4 | 20 | 0.11 |
| 10-7-1987(a) | 5 | 28 | 0.11 |
| 10-7-1987(a) | 6 | 49 | 0.13 |
| 10-7-1987(a) | 1a | 0.11 | |
| 10-7-1987(a) | 2a | 0.22 | |
| 10-7-1987(b) | 0.5 | 131 | 147 |
| 10-7-1987(b) | 1 | 45 | 2.0 |
| 10-7-1987(b) | 2 | 32 | 3.2 |
| 10-7-1987(b) | 3 | 28 | 0.10 |
| 10-7-1987(b) | 4 | 19 | 0.11 |
| 10-7-1987(b) | 5 | 25 | 0.11 |
| 10-7-1987(b) | 6 | 49 | 0.13 |
| 10-7-1987(b) | 1a | 0.32 | |
| 10-7-1987(b) | 2a | 0.22 | |
| 10-8-1987(a) | 0.5 | 162 | 313 |
| 10-8-1987(a) | 2 | 40 | 5.7 |
| 10-8-1987(a) | 3 | 31 | 7.6 |
| 10-8-1987(a) | 4 | 18 | 4.6 |
| 10-8-1987(a) | 1a | 0.3 | |
| 10-8-1987(a) | 2a | 0.12 | |
| 10-8-1987(b) | 0.5 | 148 | 365 |
| 10-8-1987(b) | 1 | 36 | 44 |
| 10-8-1987(b) | 2 | 5.8 | |
| 10-8-1987(b) | 3 | 39 | 29 |
| 10-8-1987(b) | 4 | 29 | 43 |
| 10-8-1987(b) | 5 | 24 | 7.0 |
| 10-8-1987(b) | 6 | 54 | 16 |
| 10-8-1987(b) | 2a | 0.12 | |
| 10-9-1987 | 0.5 | 152 | 357 |
| 10-9-1987 | 3 | 46 | 48 |
| 10-9-1987 | 4 | 45 | 106 |
| 10-9-1987 | 5 | 28 | 8.2 |
| 10-9-1987 | 6 | 50 | 6.4 |
| 10-9-1987 | 1a | 0.06 | |
| 10-10-1987 | 2 | 44 | 21 |
| 10-10-1987 | 3 | 54 | 90 |
| 10-10-1987 | 4 | 61 | 173 |
| 10-10-1987 | 6 | 49 | 3.9 |
| 10-10-1987 | 1a | 0.11 | |
| 10-11-1987 | 5 | 31 | 20 |
| 10-11-1987 | 6 | 2.0 | |
| 10-12-1987 | 2 | 53 | 52 |
| 10-12-1987 | 3 | 65 | 129 |
| 10-12-1987 | 5 | 38 | 62 |
| 10-12-1987 | 6 | 44 | 0.84 |
| 10-13-1987 | 1a | 0.16 | |
| 10-15-1987 | 3 | 73 | 144 |
| 10-15-1987 | 5 | 42 | 78 |
| 10-15-1987 | 6 | 41 | 2.5 |
| 10-15-1987 | 1a | 0.06 | |
| 10-15-1987 | 2a | 0.11 | |
| 10-20-1987 | 3 | 81 | 168 |
| 10-20-1987 | 6 | 41 | 5.6 |
| 10-20-1987 | 1a | 0.07 | |
| 10-22-1987 | 3 | 90 | 204 |
| 10-22-1987 | 5 | 52 | 105 |
| 10-22-1987 | 6 | 48 | 6.4 |
| 10-28-1987 | 3 | 214 | |
| 10-28-1987 | 6 | 48 | 10.6 |
| 10-28-1987 | 1a | 0.04 | |
| 11-10-1987 | 6 | 52 | 17 |
| 11-10-1987 | 1a | 0.04 | |
| 2-17-1988 | 6 | 51 | 82 |
| 3-3-1988 | 0.5 | 66 | 80 |
| 3-3-1988 | 1 | 112 | 182 |
| 3-3-1988 | 2 | 88 | 128 |
| 6-15-1988 | 0.5 | 27 | 32.7 |
| 6-15-1988 | 1 | 39 | 61 |
| 6-15-1988 | 2 | 129 | 205 |
| 6-15-1988 | 4 | 102 | 267 |
| 6-15-1988 | 5 | 74 | 155 |
| 10-7-1987 Bromide solution 1 |
103 | 430 | |
| 10-7-1987 Stafford water |
132 | 0.07 | |
| 10-7-1987 Bromide solution 2 |
140 | 457 | |
Table C.6--Application schedule for chemicals at site 7, Pratt County. No chemicals were added after July 1988. Information from Servi-tech, Inc., Dodge City, Kansas.
| Chemical type |
Chemical name |
Quantity applied |
Date (mo-d-yr) |
|---|---|---|---|
| Herbicide | 2,4-D LV Ester | 0.75 pt/acre | 4-19-1987 |
| Fertilizer | 28-0-0 | 10 lb/acre | 4-19-1987 |
| Fertilizer | 28-0-0 | 50 lb/acre | 4-23-1987 |
| Fertilizer | 10-34-0 | 50 lb/acre | 4-23-1987 |
| Fertilizer | Thio-sul | 30 lb/acre | 4-23-1987 |
| Herbicide | Lass EC | 2.5 pt/acre | 4-24-1987 |
| Herbicide | Atrazine 4L | 1.5 pt/acre | 4-24-1987 |
| Fertilizer | 28-0-0 | 107 lb/acre | 5-1987/6-1987 |
| Fertilizer | 82-0-0 | 98 lb/acre | 5-20-1987 |
| Bacteriacide | N-Serve | 1 pt/acre | 5-20-1987 |
| Fertilizer | 82-0-0 | 98 lb/acre | 6-03-1987 |
| Insecticide | Lorsban | 1.5 pt/acre | 7-23-1987 |
| Insecticide | Lorsban | 1.5 pt/acre | 7-30-1987 |
| Fertilizer | 46-0-0 | 87 lb/acre | 9-20-1987 |
| Fertilizer | 18-46-0 | 50 lb/acre | 9-20-1987 |
| Fertilizer | 0-0-60 | 100 lb/acre | 9-20-1987 |
| Fertilizer | 46-0-0 | 130 lb/acre | 3-10-1988 |
| Fertilizer | 28-0-0 | 55 lb/acre | 4-06-1988 |
| Fertilizer | Thio-sul | 35 lb/acre | 4-06-1988 |
| Fungicide | Tilt | 4 oz/acre | 4-27-1988 |
| Fertilizer | 28-0-0 | 50 lb/acre | 6-25-1988 |
| Fertilizer | 10-34-0 | 50 lb/acre | 6-25-1988 |
| Fertilizer | Thio-sul | 30 lb/acre | 6-25-1988 |
| Herbicide | Lasso EC | 2 qt/acre | 6-27-1988 |
| Herbicide | Treflan EC | 1.5 pt/acre | 6-27-1988 |
| Herbicide | Cobra | 12.5 oz/acre | 7-13-1988 |
Appendix D: Atrazine analyses in soil and water
Table D.1--Atrazine in water samples, site 6, Stafford County.
| Sample date (mo-d-yr) |
Well depth (ft) | Lysimeter depth (ft) | ||||||||||||||||||
|---|---|---|---|---|---|---|---|---|---|---|---|---|---|---|---|---|---|---|---|---|
| 20.0 | 34.0 | 45.0 | 0.5 | 1.0 | 2.0 | 3.0 | 4.0 | 5.0 | 6.0 | |||||||||||
| µg/L | limit (µg/L) |
µg/L | limit (µg/L) |
µg/L | limit (µg/L) |
µg/L | limit (µg/L) |
µg/L | limit (µg/L) |
µg/L | limit (µg/L) |
µg/L | limit (µg/L) |
µg/L | limit (µg/L) |
µg/L | limit (µg/L) |
µg/L | limit (µg/L) |
|
| 6-23-1987 | ND | 0.5 | ND | 0.5 | ND | 0.5 | ||||||||||||||
| 9-09-1987 | ND | 0.5 | ND | 0.5 | ND | 0.5 | ND | 3.8 | ND | 3.8 | ND | 6.3 | ND | 3.8 | ||||||
| 9-09-1987/A | ND | 7.1 | ||||||||||||||||||
| 9-09-1987/C | ND | 5.6 | ||||||||||||||||||
| 9-10-1987 | ND | 3.8 | ||||||||||||||||||
| 9-14-1987/1A | ND | 5.0 | ||||||||||||||||||
| 9-15-1987 | ND | 16.7 | ND | 3.8 | ND | 3.8 | ||||||||||||||
| 9-15-1987/1A | ND | 5.3 | ||||||||||||||||||
| 9-15-1987/1B | 11.6 | 5.9 | ||||||||||||||||||
| 9-16-1987 | ND | 0.5 | ||||||||||||||||||
| 9-16-1987/2A | 160 | 5.7 | 35.4 | 2.3 | ND | 2.5 | ND | 4.5 | ||||||||||||
| 9-16-1987/2B | 202.0 | 5.6 | 97.2 | 2.5 | ND | 6.3 | ND | 7.7 | ||||||||||||
| 9-17-1987/3A | 235 | 26.3 | 135 | 3.8 | ND | 7.1 | ||||||||||||||
| 9-18-1987 | ND | 0.5 | ||||||||||||||||||
| 9-18-1987/4A | 156 | 2.5 | ND | 3.8 | ND | 3.3 | ND | 8.3 | ||||||||||||
| 9-21-1987/5A | ND | 2.0 | ||||||||||||||||||
| 9-22-1987 | ND | 0.5 | ||||||||||||||||||
| 9-23-1987/6A | 137 | 5.9 | ND | 6.7 | ND | 6.2 | ||||||||||||||
| 9-25-1987 | ND | 0.5 | ||||||||||||||||||
| 9-25-1987/7A | 110 | 5.6 | ND | 5.6 | ND | 16.7 | ND | 8.3 | ||||||||||||
| 9-29-1987 | ND | 0.5 | ND | 0.5 | ND | 0.5 | ||||||||||||||
| 9-29-1987/8A | 107 | 6.3 | ND | 8.3 | ND | 3.8 | ||||||||||||||
| 10-1-1987 | ND | 0.5 | ND | 0.5 | ND | 0.5 | ||||||||||||||
| 10-1-1987/9A | 97.0 | 6.3 | ND | 4.2 | ND | 16.7 | ||||||||||||||
| 10-6-1987 | ND | 0.5 | ||||||||||||||||||
| 10-6-1987/13A | ND | 3.8 | ND | 10.0 | ||||||||||||||||
| 10-6-1987/14A | ND | 0.5 | ND | 0.5 | ND | 0.5 | ||||||||||||||
| 10-9-1987/17A | ND | 0.5 | ||||||||||||||||||
| 10-14-1987 | ND | 0.5 | ND | 0.5 | ND | 0.5 | ||||||||||||||
| 10-20-1987 | ND | 0.5 | ND | 0.5 | ||||||||||||||||
| 10-27-1987 | ND | 0.5 | ND | 0.5 | ||||||||||||||||
| 11-10-1987 | ND | 0.5 | ND | 0.5 | ||||||||||||||||
| 1-20-1988 | ND | 0.5 | ||||||||||||||||||
| 2-16-1988 | ND | 1.0 | ND | 1.0 | ND | 1.0 | ||||||||||||||
| 5-4-1988 | ND | 0.4 | ||||||||||||||||||
| 5-19-1988a | 61.9 | 3.1 | 6.2 | 1.5 | ND | 0.8 | ND | 4.4 | ||||||||||||
| 8-3-1988/B | 0.9 | 0.4 | ND | 0.4 | 2.4 | 1.7 | ||||||||||||||
| 9-13-1988 | ND | 0.4 | ND | 0.4 | ||||||||||||||||
| 11-1-1988 | ND | 0.4 | ||||||||||||||||||
Table D.2--Atrazine in soils, site 6, Stafford County. Atrazine analyses performed by the Division of Laboratories, Kansas State Board of Agriculture. a. Repeat analysis. b. Sample probably contaminated. C. Field (and plot) plowed after this date. d. Outside cornfield but within flooded site. e. Inside cornfield and within flooded site.
| Date (mo-d-yr) |
Depth (in) | |||||||
|---|---|---|---|---|---|---|---|---|
| 0-3 | 3-6 | 6-9 | 9-12 | |||||
| mg/kg | limit mg/kg |
mg/kg | limit mg/kg |
mg/kg | limit mg/kg |
mg/kg | limit (mg/kg) |
|
| 6-23-1987 | ND | 0.04 | ND | 0.04 | ND | 0.04 | ND | 0.04 |
| 7-16-1987 | 0.04 | 0.04 | ND | 0.04 | ND | 0.04 | ND | 0.04 |
| 8-6-1987A | ND | 0.04 | ND | 0.03 | ND | 0.04 | ND | 0.03 |
| 8-6-1987B | 0.13 | 0.04 | ND | 0.04 | ND | 0.04 | ND | 0.03 |
| 9-10-1987A | 0.06 | 0.04 | ND | 0.04 | ND | 0.03 | ND | 0.03 |
| 9-10-1987B | 0.04 | 0.04 | 0.06 | 0.04 | ND | 0.03 | ND | 0.03 |
| 9-16-1987 | 0.54 | 0.04 | 0.21 | 0.04 | 0.26 | 0.03 | ||
| 9-16-1987REa | ||||||||
| 9-17-1987 | 0.62 | 0.04 | 0.23 | 0.04 | 0.09 | 0.03 | 0.03 | 0.03 |
| 9-18-1987 | 0.63 | 0.04 | 0.35 | 0.03 | 0.12 | 0.03 | 0.08 | 0.03 |
| 9-22-1987 | 0.18 | 0.04 | ND | 0.03 | 0.05 | 0.04 | ND | 0.03 |
| 9-25-1987 | 0.14 | 0.04 | ND | 0.03 | ND | 0.04 | ND | 0.03 |
| 10-1-1987 | 0.43 | 0.04 | 0.05 | 0.04 | ND | 0.03 | ND | 0.03 |
| 10-6-1987 | 0.13 | 0.03 | 0.08 | 0.03 | ND | 0.04 | ND | 0.03 |
| 10-9-1987 | 0.36 | 0.04 | 0.05 | 0.04 | ND | 0.04 | ND | 0.03 |
| 10-14-1987 | 0.18 | 0.04 | 0.07 | 0.04 | ND | 0.03 | ND | 0.03 |
| 10-20-1987 | 0.06 | 0.04 | ND | 0.03 | ND | 0.05 | ND | 0.04 |
| 10-27-1987 | 0.08 | 0.03 | ND | 0.04 | ND | 0.04 | ND | 0.03 |
| 11-10-1987 | 0.14 | 0.04 | 0.08 | 0.03 | ND | 0.04 | ND | 0.03 |
| 12-1-1987c | ND | 0.03 | ND | 0.03 | ND | 0.04 | ND | 0.03 |
| 12-17-1987 | 0.27 | 0.05 | 0.36 | 0.04 | 0.29 | 0.04 | 0.20 | 0.03 |
| 2-25-1988 | 0.10 | 0.03 | ND | 0.04 | ND | 0.04 | ND | 0.04 |
| 5-4-1988Ad | ND | 0.03 | ND | 0.03 | ND | 0.04 | ND | 0.03 |
| 5-4-1988De | 0.24 | 0.03 | 0.05 | 0.03 | ND | 0.03 | ND | 0.03 |
| 8-3-1988B | 0.17 | 0.03 | 0.06 | 0.03 | 0.07 | 0.05 | 0.04 | 0.03 |
| 9-13-1988 | 0.07 | 0.04 | 0.07 | 0.03 | 0.03 | 0.03 | ND | 0.04 |
| 11-2-1988 | ND | 0.05 | ND | 0.04 | ND | 0.05 | ND | 0.05 |
Table D.2, continued
| Date (mo-d-yr) |
Depth (in) | |||||||
|---|---|---|---|---|---|---|---|---|
| 12-18 | 18-24 | 24-30 | 30-36 | |||||
| mg/kg | limit (mg/kg) |
mg/kg | limit (mg/kg) |
mg/kg | limit (mg/kg) |
mg/kg | limit (mg/kg) |
|
| 6-23-1987 | ND | 0.04 | ND | 0.04 | ND | 0.04 | ND | 0.04 |
| 7-16-1987 | ND | 0.04 | ||||||
| 8-6-1987A | ||||||||
| 8-6-1987B | ||||||||
| 9-10-1987A | ND | 0.04 | ||||||
| 9-10-1987B | ND | 0.04 | ||||||
| 9-16-1987 | 0.30b | 0.04 | 0.04 | 0.04 | ND | 0.04 | ND | 0.04 |
| 9-16-1987REa | 0.21b | 0.04 | 0.12b | 0.03 | ||||
| 9-17-1987 | ND | 0.04 | ND | 0.04 | ND | 0.04 | ND | 0.04 |
| 9-18-1987 | ND | 0.04 | ND | 0.04 | ND | 0.04 | ND | 0.04 |
| 9-22-1987 | ||||||||
| 9-25-1987 | ||||||||
| 10-1-1987 | ||||||||
| 10-6-1987 | ||||||||
| 10-9-1987 | ||||||||
| 10-14-1987 | ||||||||
| 10-20-1987 | ||||||||
| 10-27-1987 | ||||||||
| 11-10-1987 | ||||||||
| 12-1-1987c | ||||||||
| 12-17-1987 | 0.19 | 0.04 | 0.09 | 0.04 | ND | 0.04 | 0.09 | 0.04 |
| 2-25-1988 | ND | 0.04 | ND | 0.04 | ND | 0.04 | ND | 0.04 |
| 5-4-1988Ad | ND | 0.04 | ND | 0.04 | ND | 0.04 | ND | 0.04 |
| 5-4-1988De | 0.24 | 0.04 | ND | 0.04 | 0.28 | 0.04 | ND | 0.04 |
| 8-3-1988B | 0.1b | 0.04 | ND | 0.04 | ||||
| 9-13-1988 | ND | 0.04 | ND | 0.04 | ND | 0.04 | ND | 0.03 |
| 11-2-1988 | ND | 0.04 | ND | 0.04 | ND | 0.04 | ND | 0.04 |
Table D.3--Atrazine in water samples, site 7, Pratt County. Atrazine analyses performed by the Division of Laboratories, Kansas State Board of Agriculture. a. Outside the perimeter of the flooded area.
| Sample date (mo-d-yr) |
Well depth (ft) | Lysimeter depth (ft) | ||||||||||
|---|---|---|---|---|---|---|---|---|---|---|---|---|
| 30.0 | 50.0 | 70.0 | 0.5 | 1.0 | 2.0 | |||||||
| µg/L | limit (µg/L) |
µg/L | limit (µg/L) |
µg/L | limit (µg/L) |
µg/L | limit (µg/L) |
µg/L | limit (µg/L) |
µg/L | limit (µg/L) |
|
| 6-23-1987 | ND | 0.5 | ND | 0.5 | ND | 0.5 | ||||||
| 9-3-1987 | ND | 5.9 | ND | 3.8 | ||||||||
| 10-5-1987 | ND | 0.5 | ND | 7.7 | ||||||||
| 10-7-1987/1A | ND | 1.0 | ND | 0.5 | ND | 0.5 | 22.2 | 7.7 | ||||
| 10-8-1987/2A | ND | 1.0 | 38.0 | 5.9 | ND | 16.7 | ||||||
| 10-8-1987/2B | 121 | 6.3 | ||||||||||
| 10-9-1987/3A | ND | 1.0 | 24.9 | 5.6 | ||||||||
| 10-10-1987/4A | ND | 1.0 | ND | 50.0 | ND | 16.7 | ||||||
| 10-12-1987/6A | ND | 0.5 | ND | 7.1 | ||||||||
| 10-13-1987 | ND | 0.5 | ND | 0.5 | ND | 0.5 | ||||||
| 10-15-1987 | ND | 0.5 | ND | 33.3 | ||||||||
| 10-20-1987 | ND | 0.5 | ND | 0.5 | ||||||||
| 10-22-1987 | ||||||||||||
| 10-28-1987 | ND | 0.5 | ND | 0.5 | ||||||||
| 11-10-1987 | ND | 0.5 | ND | 0.5 | ||||||||
| 1-20-1988 | ND | 0.5 | ||||||||||
| 2-17-1988 | ND | 1.0 | ND | 1.0 | ND | 1.0 | ||||||
| 3-3-1988 | 53 | 4.5 | 28 | 2.9 | 20 | 6.7 | ||||||
| 5-4-1988 | ND | 0.4 | 36.3 | 0.8 | ||||||||
| 8-3-1988 | ND | 0.4 | ND | 0.4 | ND | 0.4 | ||||||
| 9-12-1988 | 8.8 | 2.3 | 3.4 | 0.9 | ||||||||
| 9-14-1988 | ND | 0.4 | ND | 0.4 | 3.9 | 2.2 | ||||||
| 9-16-1988 | 5.3 | 2.2 | 3.4 | 1.6 | ND | 2.4 | ||||||
| 11-1-1988 | ND | 0.4 | ND | 4.5 | ||||||||
| 11-3-1988 | ND | 2.7 | ND | 3.6 | ||||||||
Table D.3, continued
| Sample date (mo-d-yr) |
Lysimeter depth (ft) | |||||||||||||
|---|---|---|---|---|---|---|---|---|---|---|---|---|---|---|
| 3.0 | 4.0 | 5.0 | 6.0 | 1Ea | 2Ea | 1Sa | ||||||||
| µg/L | limit (µg/L) |
µg/L | limit (µg/L) |
µg/L | limit (µg/L) |
µg/L | limit (µg/L) |
µg/L | limit (µg/L) |
µg/L | limit (µg/L) |
µg/L | limit (µg/L) |
|
| 6-23-1987 | ||||||||||||||
| 9-3-1987 | ND | 3.8 | ND | 3.8 | ND | 3.8 | ND | 3.8 | ||||||
| 10-5-1987 | ND | 5.0 | ||||||||||||
| 10-7-1987/1A | ||||||||||||||
| 10-8-1987/2A | ND | 3.3 | ND | 5.6 | ND | 12.5 | ND | 20.0 | ND | 12.5 | ND | 8.3 | ||
| 10-8-1987/2B | ND | 12.5 | ND | 16.7 | ND | 10.0 | ||||||||
| 10-9-1987/3A | ND | 10.0 | ND | 16.7 | ND | 12.5 | ||||||||
| 10-10-1987/4A | ND | 11.1 | ND | 20.0 | ||||||||||
| 10-12-1987/6A | ND | 8.3 | ND | 10.0 | ND | 16.7 | ||||||||
| 10-13-1987 | ND | 10.0 | ||||||||||||
| 10-15-1987 | ND | 6.7 | ND | 9.1 | ND | 5.0 | ND | 10.0 | ||||||
| 10-20-1987 | 4.9 | 4.5 | ND | 11.1 | ND | 2.3 | ||||||||
| 10-22-1987 | ND | 10.0 | ||||||||||||
| 10-28-1987 | ND | 16.7 | ND | 2.5 | ||||||||||
| 11-10-1987 | ND | 11.1 | ND | 3.8 | ||||||||||
| 1-20-1988 | ||||||||||||||
| 2-17-1988 | ND | 7.7 | ||||||||||||
| 3-3-1988 | ||||||||||||||
| 5-4-1988 | 48.7 | 0.4 | 48.0 | 0.4 | 57.8 | 0.8 | 1.0 | 0.8 | ||||||
| 8-3-1988 | 28.1 | 1.1 | 21.1 | 0.8 | 2.9 | 1.7 | ||||||||
| 9-12-1988 | 7.9 | 1.6 | 9.2 | 1.9 | 6.0 | 2.9 | ND | 1.7 | ||||||
| 9-14-1988 | 6.3 | 1.6 | ||||||||||||
| 9-16-1988 | 6.1 | 1.8 | 13.7 | 1.8 | 4.9 | 3.2 | ND | 4.7 | ||||||
| 11-1-1988 | 18.7 | 0.4 | 3.4 | 0.8 | ||||||||||
| 11-3-1988 | ND | 4.4 | ND | 3.5 | ||||||||||
Table D.4--Atrazine in soils, site 7, Pratt County. a. Sample drawn at 10:30 A.M. b. Sample drawn at 5:00 P.M.
| Date (mo-d-yr) |
Depth (in) | |||||||||||
|---|---|---|---|---|---|---|---|---|---|---|---|---|
| 0-3 | 3-6 | 6-9 | 9-12 | 12-18 | 18-24 | |||||||
| mg/kg | limit mg/kg |
mg/kg | limit mg/kg |
mg/kg | limit mg/kg |
mg/kg | limit mg/kg |
mg/kg | limit mg/kg |
mg/kg | limit (mg/kg) |
|
| 6-23-1987 | ND | 0.04 | ND | 0.04 | ND | 0.04 | ND | 0.04 | ND | 0.04 | ND | 0.04 |
| 8-6-1987 | ND | 0.04 | ND | 0.03 | ND | 0.03 | ND | 0.03 | ||||
| 9-10-1987 | ND | 0.04 | ND | 0.04 | ND | 0.04 | ND | 0.04 | ||||
| 10-6-1987 | ND | 0.03 | ND | 0.04 | ND | 0.03 | ND | 0.03 | ||||
| 10-8-1987a | 0.25 | 0.04 | 0.28 | 0.03 | 0.13 | 0.03 | 0.04 | 0.03 | 0.12 | 0.04 | ND | 0.04 |
| 10-8-1987b | 0.42 | 0.04 | 0.29 | 0.03 | 0.20 | 0.03 | 0.09 | 0.03 | 0.26 | 0.04 | 0.17 | 0.04 |
| 10-9-1987 | 0.44 | 0.04 | 0.11 | 0.03 | ND | 0.03 | ND | 0.03 | ||||
| 10-10-1987 | 0.32 | 0.04 | ND | 0.03 | ND | 0.04 | ND | 0.03 | ND | 0.04 | ND | 0.04 |
| 10-12-87 | 0.47 | 0.08 | 0.30 | 0.03 | 0.21 | 0.05 | 0.15 | 0.03 | 0.16 | 0.04 | 0.19 | 0.04 |
| 10-13-1987 | 0.41 | 0.06 | 0.27 | 0.03 | 0.20 | 0.03 | 0.12 | 0.03 | 0.20 | 0.04 | 0.22 | 0.04 |
| 10-20-1987 | 0.14 | 0.03 | 0.19 | 0.03 | ND | 0.03 | ND | 0.03 | ||||
| 10-28-1987 | 0.08 | 0.05 | 0.21 | 0.04 | 0.12 | 0.03 | 0.05 | 0.03 | ND | 0.04 | ND | 0.04 |
| 11-10-1987 | 0.27 | 0.04 | 0.21 | 0.03 | 0.06 | 0.03 | 0.04 | 0.03 | 0.08 | 0.04 | 0.08 | 0.04 |
| 11-30-1987 | 0.30 | 0.04 | 0.14 | 0.04 | ND | 0.03 | 0.05 | 0.03 | 0.15 | 0.04 | 0.12 | 0.04 |
| 12-17-1987 | 0.28 | 0.04 | 0.18 | 0.03 | ND | 0.03 | ND | 0.03 | ND | 0.04 | 0.04 | 0.04 |
| 2-24-1988 | 0.12 | 0.03 | ND | 0.04 | ND | 0.03 | ND | 0.03 | ND | 0.04 | ND | 0.04 |
| 5-4-1988 | 0.11 | 0.03 | 0.11 | 0.04 | 0.21 | 0.04 | 0.09 | 0.03 | 0.09 | 0.04 | ND | 0.04 |
| 8-2-1988 | 0.03 | 0.03 | ND | 0.03 | ND | 0.03 | ND | 0.03 | ND | 0.03 | ND | 0.04 |
| 9-14-1988 | ND | 0.03 | ND | 0.03 | ND | 0.03 | ND | 0.04 | ND | 0.04 | ND | 0.04 |
| 11-2-1988 | ND | 0.04 | ND | 0.04 | ND | 0.04 | ND | 0.04 | ND | 0.04 | ND | 0.04 |
Table D.4, continued
| Date (mo-d-yr) |
Depth (in) | |||||||||||
|---|---|---|---|---|---|---|---|---|---|---|---|---|
| 24-30 | 30-36 | 36-42 | 42-48 | 48-54 | 54-60 | |||||||
| mg/kg | limit mg/kg |
mg/kg | limit mg/kg |
mg/kg | limit mg/kg |
mg/kg | limit mg/kg |
mg/kg | limit mg/kg |
mg/kg | limit (mg/kg) |
|
| 6-23-1987 | ND | 0.04 | ND | 0.04 | ||||||||
| 8-6-1987 | ||||||||||||
| 9-10-1987 | ||||||||||||
| 10-6-1987 | ||||||||||||
| 10-8-1987a | 0.19 | 0.04 | 0.06 | 0.04 | ||||||||
| 10-8-1987b | ||||||||||||
| 10-9-1987 | ||||||||||||
| 10-10-1987 | ND | 0.04 | ND | 0.04 | ||||||||
| 10-12-1987 | 0.06 | 0.04 | ND | 0.04 | 0.19 | 0.04 | 0.12 | 0.04 | 0.04 | 0.04 | ND | 0.04 |
| 10-13-1987 | 0.18 | 0.04 | 0.17 | 0.04 | 0.16 | 0.04 | 0.05 | 0.04 | 0.05 | 0.04 | ND | 0.04 |
| 10-20-87 | ||||||||||||
| 10-28-87 | ||||||||||||
| 11-10-1987 | 0.06 | 0.04 | 0.06 | 0.04 | 0.11 | 0.04 | 0.05 | 0.04 | 0.07 | 0.04 | ND | 0.04 |
| 11-30-1987 | 0.13 | 0.04 | 0.13 | 0.04 | 0.12 | 0.04 | 0.12 | 0.04 | 0.04 | 0.04 | ND | 0.04 |
| 12-17-87 | ||||||||||||
| 2-24-1988 | ND | 0.04 | ND | 0.04 | ||||||||
| 5-4-1988 | 0.10 | 0.04 | 0.05 | 0.04 | ND | 0.04 | ND | 0.04 | ND | 0.04 | ND | 0.04 |
| 8-2-1988 | ND | 0.04 | ND | 0.04 | ND | 0.04 | ND | 0.04 | ND | 0.04 | ND | 0.04 |
| 9-14-1988 | ND | 0.04 | ND | 0.04 | ND | 0.04 | ND | 0.04 | ||||
| 11-2-1988 | ND | 0.04 | ND | 0.04 | ND | 0.04 | ND | 0.04 | ND | 0.04 | ND | 0.04 |
Appendix E: Determination of atrazine degradation by-products
Table E.1--Determination of atrazine degradation by-products for sites 6 and 7. a. Moisture-corrected residues. Detection limit 0.05 mg/kg. Analyses by Minnesota Valley Testing Laboratories, Inc.
| Sampling date (mo-d-yr) |
Depth (in.) |
Parent atrazine (mg/kg) |
Biodegradation by-productsa | ||
|---|---|---|---|---|---|
| G-34048 hydroxy- atrazine (mg/kg) |
G-28279 ethyl- atrazine (mg/kg) |
G-30033 isopropyl- atrazine (mg/kg) |
|||
| Site 6 | |||||
| 2-25-1988 | 0-6 | 0.078 | 0.124 | <0.05 | <0.05 |
| 6-12 | 0.299 | 0.116 | <0.05 | <0.05 | |
| 12-18 | 0.175 | <0.05 | <0.05 | ||
| 18-24 | 0.077 | <0.05 | <0.05 | ||
| 24-30 | 0.054 | 0.167 | <0.05 | <0.05 | |
| 30-36 | <0.05 | 0.185 | <0.05 | <0.05 | |
| 5-4-1988 | 12-18 | <0.05 | 0.163 | 0.631 | 0.090 |
| 18-24 | <0.05 | <0.05 | <0.05 | 0.082 | |
| 8-3-1988 | 0-6 | 0.085 | 0.177 | 0.351 | 0.202 |
| 6-12 | <0.05 | <0.05 | <0.05 | <0.05 | |
| Site 7 | |||||
| 2-24-1988 | 0-6 | 0.062 | <0.05 | <0.05 | |
| 6-12 | 0.050 | <0.05 | <0.05 | ||
| 12-18 | 0.056 | <0.05 | <0.05 | ||
| 18-24 | <0.05 | <0.05 | <0.05 | ||
| 24-30 | 0.056 | 0.172 | <0.05 | <0.05 | |
| 30-36 | <0.05 | 0.408 | <0.05 | <0.05 | |
| 8-2-1988 | 0-6 | <0.05 | <0.05 | 0.073 | <0.05 |
| 6-12 | <0.05 | <0.05 | 0.124 | 0.061 | |
| 12-18 | <0.05 | <0.05 | 0.089 | 0.063 | |
| 18-24 | <0.05 | <0.05 | <0.05 | 0.081 | |
| 24-30 | <0.05 | <0.05 | 0.105 | 0.120 | |
| 30-36 | <0.05 | 0.134 | 0.067 | 0.189 | |
Prev Page--Conclusions || Next Page--References
Kansas Geological Survey, Geohydrology
Placed on web Aug. 23, 2010; originally published 1990.
Comments to webadmin@kgs.ku.edu
The URL for this page is http://www.kgs.ku.edu/Publications/Bulletins/GW12/08_app.html