
![]()
Prev Page--Calibration || Next Page--Recommendations, References
Predicted Water-level Declines--Management Options
Introduction
The main purpose of this report is to evaluate the impacts of present and future groundwater withdrawals in the region. The calibration procedure, consisting of the automated parameter estimation technique described previously, resulted in a very satisfactory match between observed and simulated water-level data. Therefore, the present model is considered an acceptable representation of the hydrogeologic system in the study area within the limitations of data inadequacies as discussed in previous sections of this report. This model can be used to predict the effect of any management scheme on the groundwater levels. This report, however, describes only six predictive simulations or management options. In all options the period 1979-1980 was chosen as initial condition for the predictive simulations because it is the only recent period for which detailed data on water levels are available. The predictive simulations were designed to terminate 20 years in the future. Results obtained by applying each option are presented every ten years for a 20-year period. The results displayed consist of the following two items: 1) predicted average water-level declines for each grid subregion, 2) subregions where the saturated thickness dropped below a specified lower limit; pumpage in these grid subregions cannot be supported and thus all wells within that area will have to shut down. It should be noted that such wells may resume pumping once the saturated thickness is built up to a specified level. The significant reduction in pumpage due to the shut-down of such wells provides such an opportunity, as may be seen by comparing the tenth and twentieth-year projected declines for some subregions.
Management Options
The following six options were considered.
Option 1: All registered wells (as of 1979) are assumed to pump the appropriated amount of water on a yearly basis for the next 20 years. They continue to do so until the saturated thickness in the vicinity of the wells drops to eight feet or less, at which time they are shut down. These wells do not resume pumping until the saturated thickness is built up to at least 15 feet. Average climatic conditions are assumed.
Option 2: all registered wells (as of 1979) are assumed to pump the appropriated amount of water on a yearly basis for the next 20 years. they continue to do so until the saturated thickness in the vicinity of the wells is reduced by 40% of the initial (1979) saturated thickness, at which time they are shut down. these wells do not resume pumping until the saturated thickness is built up to at least 62% of the initial saturated thickness. average climatic conditions are assumed.
Option 3: All registered wells (as of 1979) are assumed to increase their appropriated pumpage by 20% and keep it constant on a yearly basis for the next 20 years. Otherwise Option 3 is the same as Option 1.
Option 4: All registered wells (as of 1979) are assumed to reduce their appropriated pumpage by 20% and keep it constant on a yearly basis for the next 20 years. Otherwise Option 4 is the same as Option 1.
Option 5: A five-year wet period is assumed to occur just before the middle of the 20-year projection period. All registered wells reduce their appropriated pumpage in half, while the amount of natural recharge doubles during that period. Otherwise Option 5 is the same as Option 1.
Option 6: A five-year dry period is assumed to occur just before the middle of the 20-year projection period. All registered wells double their appropriated pumpage while the amount of natural recharge is reduced by half during that period. Otherwise Option 6 is the same as Option 1.
Projected Water-level Declines
[Note: Appendix B contains the actual values of water-level declines for each grid of the model area for all options considered.]
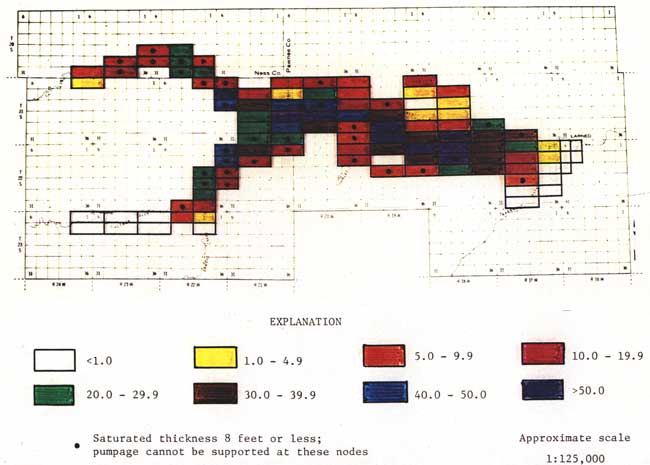
Option 1: This management option assumes no more development after 1979. The critical question asked in this situation is whether, after an initial adjustment, the water levels will stabilize to the existing pumping regime if no additional wells are installed. Figures 36 and 37 summarize the results of the simulation and illustrate that water levels will continue to decline despite a cessation of development in 1979. This simulation indicates that by the year 2000 most of the central part of the valley will experience more than 30 feet of water-level decline, with portions south, west, and around Sanford; north and west of Burdett; and the area around Rozel experiencing more than 50 feet of declines. However, the areas around the Arkansas River in Pawnee County and the Jetmore area in Hodgeman County will not experience any water-level declines according to this simulation. In a great number of subregions, as can be seen in Figure 37, pumpage will be stopped due to drastic reductions in saturated thickness.
Figure 36--Projected average water-level declines, in feet, from 1979-80 to 1989-1990 under option 1.
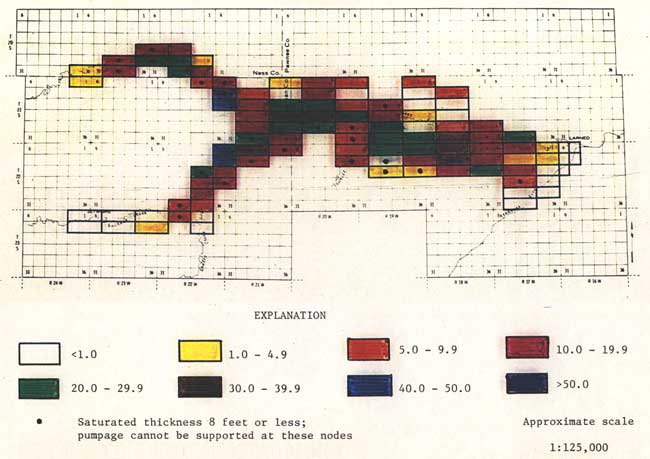
Figure 37--Projected average water-level declines, in feet, from 1979-80 to 1999-2000 under option 1.
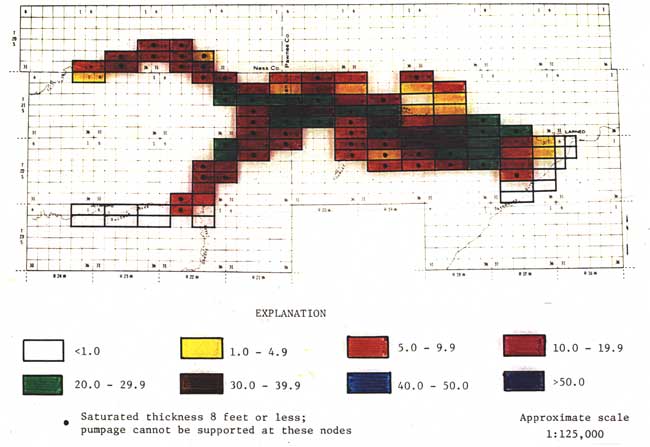
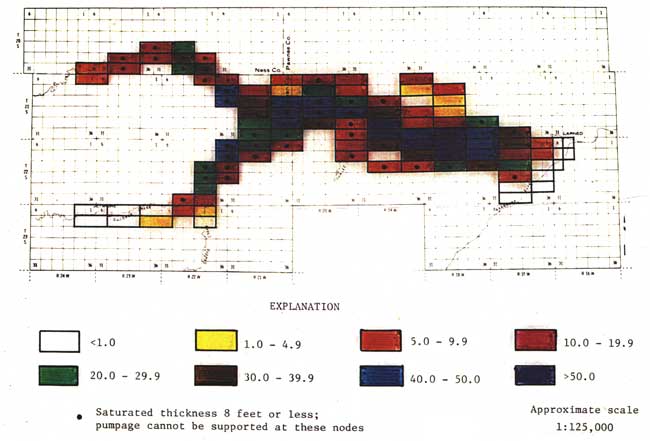
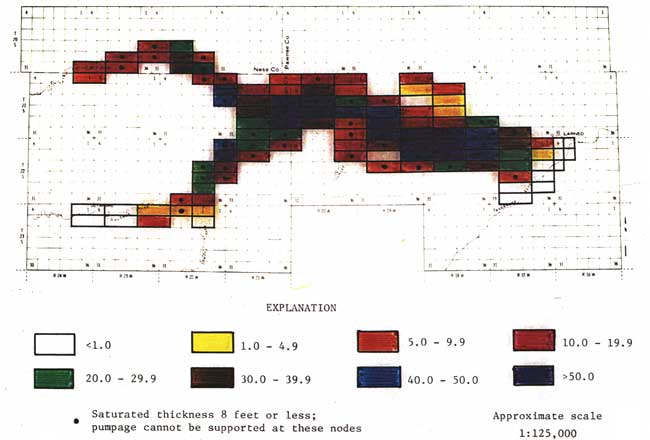
Option 2: This management option of allowing only 40% saturated-thickness reduction for the next 20 years produces the least amount of water-level decline in 20 years of all options considered. However, the number of grid subregions where the saturated thickness is reduced to that level, causing closure of wells in those areas, is so numerous that irrigated agriculture in most of the Pawnee Valley would have to cease by the year 2000. Figures 38 and 39 detail the above observations. However, for the next decade, this policy will not result in such a prohibitive situation for the Pawnee County as may be seen in Figure 38. Therefore, the beneficial results from this policy for the next decade should be carefully considered in any management decision.
Figure 38--Projected average water-level declines, in feet, from 1979-80 to 1989-1990 under option 2.
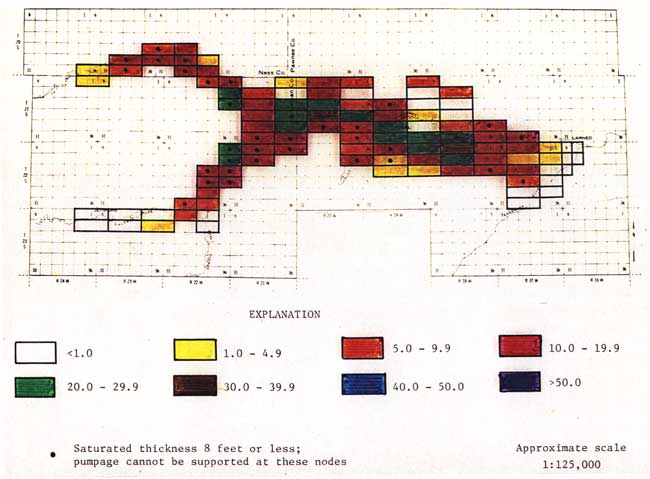
Figure 39--Projected average water-level declines, in feet, from 1979-80 to 1999-2000 under option 2.
Option 3: This management option allows for an immediate 20% increase in the amount of present (1979) groundwater pumpage followed by no further development. The results of this simulation are indicated in Figures 40 and 41. As expected, more serious declines, compared to Option 1, are observed.
Figure 40--Projected average water-level declines, in feet, from 1979-80 to 1989-90 under option 3.
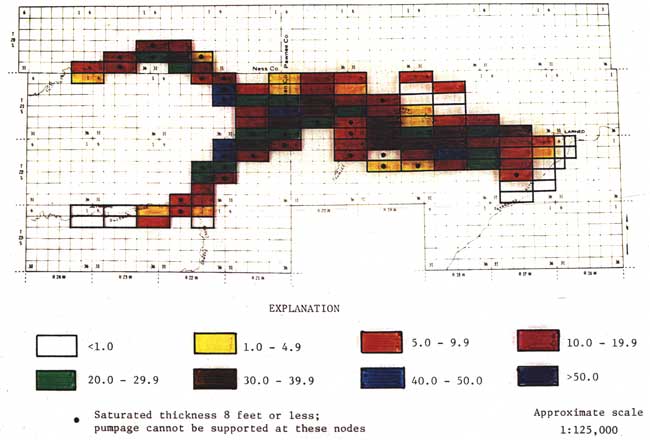
Figure 41--Projected average water-level declines, in feet, from 1979-80 to 1999-2000 under option 3.
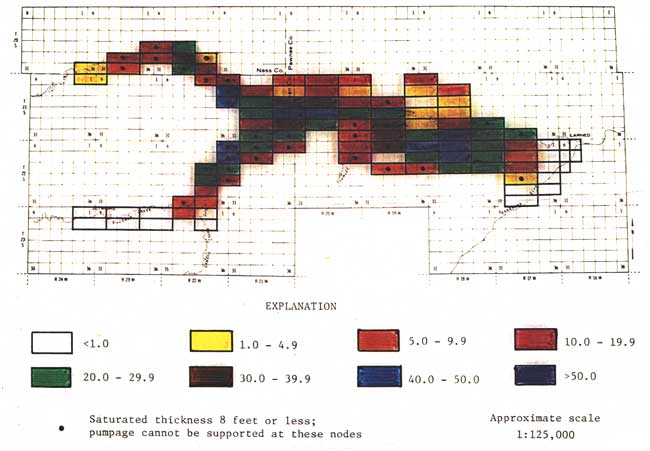
Option 4: This option is the opposite of Option 3 in that it calls for an immediate 20% reduction in the amount of present groundwater pumpage followed by no further development. The simulated improvement in water-level declines is indicated in Figures 42 and 43. Compared to Option 1, a number of regions--as those around Sanford, Burdett, and Rozel--will experience between 10 and more than 17 foot recovery in water levels. A greater number of regions will have between five and 10 foot recovery by the year 2000.
Figure 42--Projected average water-level declines, in feet, from 1979-80 to 1989-1990 under option 4.
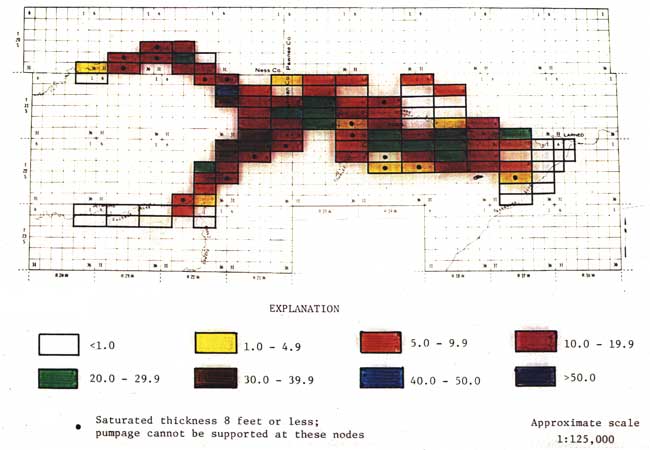
Figure 43--Projected average water-level declines, in feet, from 1979-80 to 1999-2000 under option 4.
Options 5 and 6: These two options are introduced to answer the question on the effects of droughts or wet periods on water levels. In the case of an extended drought in the area, heavy demand would be made on the groundwater system. Similarly, in the case of a period of unusually wet years, the rate of groundwater withdrawals would be substantially reduced and have a positive effect on water levels. In order to examine the behavior of the aquifer under sustained periods of extreme climatic conditions, both a five-year wet period (Option 5) and a five-year drought period (Option 6) were simulated.
The wet period was simulated between the beginning of 1986 and the end of 1990 by reducing by half the appropriated pumpage from the wells; at the same time natural groundwater recharge was doubled uniformly over the region. The five-year drought period was simulated between the beginning of 1986 and the end of 1990 by uniformly decreasing by half natural recharge throughout the region while pumpage from wells was doubled. Figures 44 and 45 summarize the results of the wet period, and Figures 46 and 47 summarize the results of the drought period. While the effects of the wet periods are temporary (compare Figs. 44 and 45) the effects of an extended drought are very severe (compare Figs. 47 and 45). Under the drought option, the areas between Frizell and Rozel as well as some areas around the Hodgeman-Pawnee County line will experience by the year 2000 more than 10 to 19 feet of groundwater declines over those of Option 1. The benefits from an extended wet period, as in Option 5, would result in holding water-level declines to 5 to 10 feet above those of Option 1 by the year 2000.
Figure 44--Projected average water-level declines, in feet, from 1979-80 to 1989-1990 under option 5.
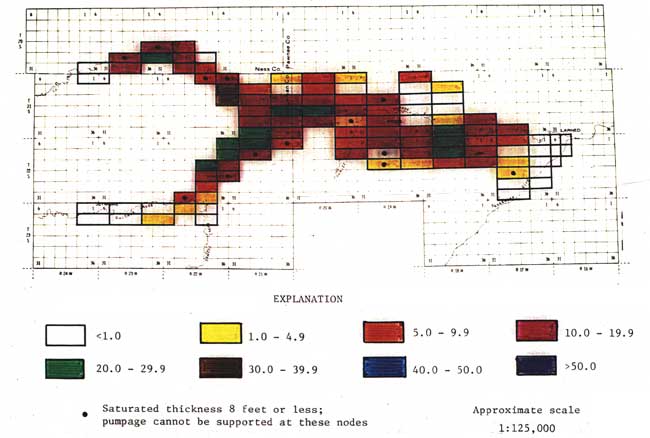
Figure 45--Projected average water-level declines, in feet, from 1979-80 to 1999-2000 under option 5.
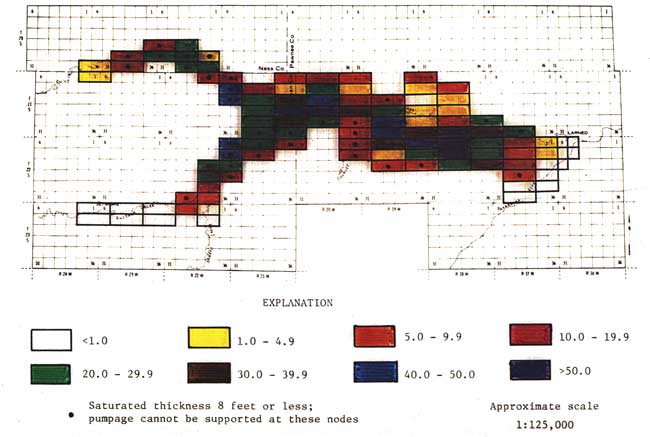
Figure 46--Projected average water-level declines, in feet, from 1979-80 to 1989-1990 under option 6.
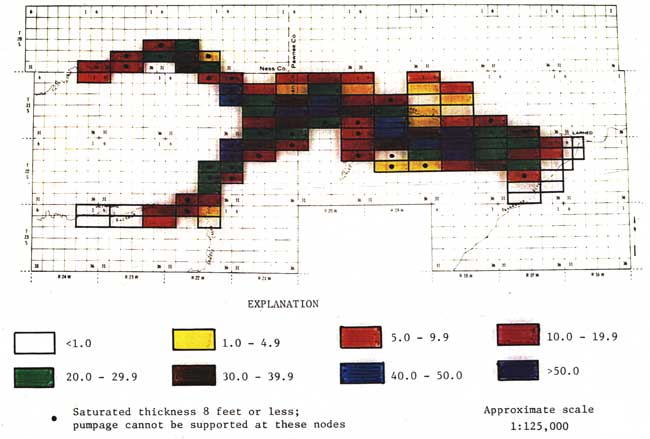
Figure 47--Projected average water-level declines, in feet, from 1979-80 to 1999-2000 under option 6.
It should be recognized that these predictions represent general regional trends in water levels and not necessarily detailed, point-accurate, and definitive projections. Much more data, as mentioned in the first part of the report, and even more elaborate models are required for such a purpose. Such sophisticated models would have to encompass surface and subsurface water interactions and saturated-unsaturated flow mechanisms. Although the detailed water-level distribution may change as a result of these models, the general trends as predicted by the present basic model would not change at all.
Prev Page--Calibration || Next Page--Recommendations, References