![]()
Prev Page--Ground Water Start || Next Page--Water Bearing Formations
Ground Water, continued
Recovery of Ground Water
Principles of Recovery
The following discussion on the principles of recovery of ground water has been adopted in part from Lohman (1938, pp. 54-56).
When water is withdrawn from a well there is a difference in head between the water inside the well and the water in the surrounding material for some distance from the well. The water table in the vicinity of the well develops a cone of depression (fig. 9). In any given well a higher pumping rate produces a greater drawdown (depression of the water level, commonly expressed in feet), and the diameter of the cone of influence and of the area of influence will be greater.
The specific capacity of a well is its rate of yield per unit of drawdown, and is generally stated in gallons a minute per foot of drawdown. When a well is pumped the water level drops rapidly at first and then more slowly, and it may continue to decline for several hours or days. In testing the specific capacity of a well, therefore, it is important to continue pumping until the water level remains approximately stationary. When the pump is stopped the water level rises rapidly at first, then more slowly, and may continue to rise long after pumping has ceased (fig. 10).
Figure 10--Recovery curves of wells 14, 31, 33, and 36, based on measurements made at termination of pumping tests. Rate and period of pumping are given in table 4.
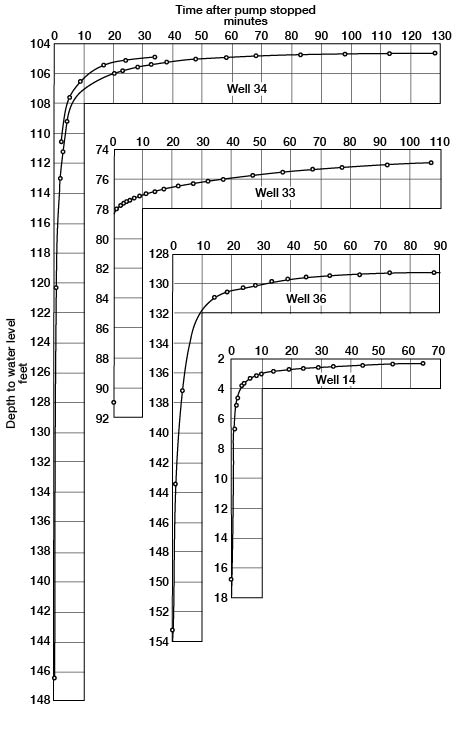
Table 4--Pumping tests of irrigation wells in Thomas County. Pumping tests by Howard Palmer and Allan Graffham, Division of Water Resources, Kansas State Board of Agriculture, in cooperation with State and Federal Geological Surveys.
| Well No. in pl. 2 and table 9 |
Depth to water level at beginning of pumping test |
Discharge (gallons a minute) |
Length of time well was pumped (minutes) |
Drawdown at end of pumping period (feet) |
Specific capacity (gallons a minute per foot of drawdown) |
|---|---|---|---|---|---|
| 14 | 14.09 | 637 | 180 | 15.37 | 41.4 |
| 31 | 104.32 | 588 | 184 | 40.08 | 14.0 |
| 33 | 72.90 | 1021 | 201 | 18.05 | 56.5 |
| 36 | 128.01 | 295 | 210 | 26.33 | 11.2 |
The character and thickness of the water-bearing materials have a definite bearing on the yield and drawdown of a well and hence on its specific capacity. Drawdown increases the height that water must be lifted in pumping, thus increasing the cost of pumping. If the water-bearing material is coarse and of fairly uniform size it will readily yield large quantities of water to a well with a minimum drawdown; if the water-bearing material is fine and poorly sorted it will offer more resistance to the inflow of water, thereby decreasing the yield and increasing the drawdown. Other things being equal, the drawdown of a well varies inversely with the permeability of the water-bearing materials.
Dug Wells
Dug wells are excavated with picks, shovels, spades, or by power machinery. They generally are between 2 and 10 feet in diameter and are quite shallow. Many of the early wells in Thomas County were dug by hand, but most of these have since been replaced by drilled wells. A few dug wells are now in use in the major valleys. Of the 114 wells listed in table 9 only three are dug wells, two are bored wells, and 109 are drilled wells.
Bored and Driven Wells
Bored wells are made by augers or post-hole diggers. Some wells are bored to the water-bearing formation by this method and a well point is driven into the sand or gravel from which the water is obtained. In some shallow water areas well points are driven from the surface without recourse to boring. These are called driven wells. Bored and driven wells are in use in Thomas County in the valley areas and at some places on the uplands.
Drilled Wells
A drilled well is one that is excavated by means of a percussion or rotary drill. Most of the wells in Thomas County are drilled wells. The drilled domestic and stock wells generally are 6 inches in diameter and those used for irrigation and public supply purposes generally are 14 to 18 inches in diameter.
All the wells in Thomas County obtain water from relatively unconsolidated deposits. Wells in such deposits generally are cased nearly to the bottom of the hole with galvanized or wrought-iron casing. In some wells the water may enter only through the open end of the casing, but to provide greater intake facilities in many wells a strainer or well screen is used or the casing is perforated below the water table. The size of the perforations is an important factor in the construction of a well and the capacity or even the life of the well may be determined by it. If the perforations are too large the fine material may filter through and Jill the well; if the perforations are too small they may become clogged so that water is prevented from entering the well freely.
Some wells in unconsolidated sediments are equipped with well screens or strainers. It is good practice to select a slot size that will pass 30 to 60 percent of the water-bearing material, depending on the texture and degree of sorting. The coarser particles that remain around the screen form a natural gravel pack which increases the effective diameter and therefore the capacity of the well.
Gravel-wall wells generally are effective for obtaining large supplies of water from relatively fine-grained unconsolidated deposits and have been used in many public supply and irrigation wells. In such wells a large-diameter hole is first drilled with a rotary drill or excavated by a hoist and orange-peel bucket and the hole generally is temporarily cased with unperforated casing. A well screen or perforated casing is then centered in the hole opposite the water-bearing material and enough blank casing added to reach the surface. The space between the two casings is filled with carefully screened gravel and all but 20 or 30 feet of the outer casing is pulled from the hole. A well-sorted medium to coarse gravel packing generally gives the best results, but where the water-bearing material is extremely fine a coarse sand or fine gravel mat give best results. The slots in the screen or slotted casing should be as large as possible yet small enough to keep out the gravel used for packing the well. If the water-bearing formation consists of well-sorted coarse gravel the capacity of the well probably will not be increased by addition of a gravel pack around the screen.
McCall and Davison (1939, p. 29) stated that drawdown can be kept at a minimum in several ways:
"First, the well should be put down through all valuable water-bearing material. Secondly, the casing should be properly perforated so as to admit water to the well as rapidly as the surrounding gravel will yield the water. Third, the well should be completely developed so that the water will flow freely into the well ... Increasing the depth of a well will have a greater effect on reducing the drawdown than will increasing the diameter, so long as additional water-bearing formations are encountered."
A report (Davison, 1989) containing descriptions of different types of pumping plants, the conditions for which each is best suited, construction methods, and a discussion of construction costs is available from the Division of Water Resources, Kansas State Board of Agriculture, Topeka, Kansas, and the reader is referred to this publication for additional details of well construction.
Methods of Lift and Types of Pumps
Water from many of the domestic and stock wells in Thomas County is obtained by windmill-operated lift or force pumps. The cylinder or working barrels in lift pumps and force pumps are similar and are located below the land surface, either above or below the water surface, but a lift pump is capable of discharging water only at the pump head, whereas a force pump can raise water above this point--such as to an elevated tank. Pitcher pumps are used on a very few dug or bored wells in the shallow water areas of the major valleys. Most of the pitcher pumps and a few of the lift and force pumps are hand operated.
Several types of power-driven pumps are in use on the irrigation and city wells in the county. For the most part these are turbine pumps and are powered by electric motors, stationary gasoline engines, and tractor engines. Data concerning such wells are given in table 9. One irrigation well is equipped with a centrifugal pump powered by a stationary gasoline engine. Several of the city wells at Colby and several of the railroad supply wells in the county are equipped with double action plunger pumps, and one railroad well is powered by a steam engine.
Utilization of Ground Water
During the course of this investigation data were obtained on 114 wells in Thomas County. All types of wells in all parts of the county were visited. Of the 114 wells listed in table 9, 13 were used primarily for stock water, 10 for domestic supplies, and 24 for both purposes, making a total of 47 domestic and stock wells listed. Of the remaining wells, 10 were used for public supplies, 9 were irrigation wells, and 2 were railroad supply wells; 23 were not in use at the time they were visited and 23 were test holes drilled by the cooperatively owned drilling machine and subsequently plugged. Although table 9 includes only a small percentage of the domestic and stock wells in the county, all of the public supply and irrigation wells that I could locate in 1942 were visited and are listed.
Domestic and Stock Supplies
Nearly all of the domestic and stock supplies in rural areas are obtained from wells--mainly drilled wells. In parts of the county ponds are used to some extent to supply stock water, but ponds are not as extensively used in Thomas County as they are in areas to the east (Moore, 1940, p. 55).
The domestic use of water generally includes drinking, cooking, washing, and in some cases the disposal of sewage. In Thomas County the ground waters are generally satisfactory for all domestic purposes (see "Quality of Water"), and ground water in sufficient quantity for such uses can be obtained at nearly any locality in the county.
Public Supplies
Three municipalities in Thomas County have public water supplies obtained from wells.
Brewster--The city of Brewster, located in the west-central part of the county, obtains its water supply from two drilled wells (nos. 69, 70). Water is pumped from these wells to an elevated steel storage tank having a capacity of 50,000 gallons. The daily capacity of the system was reported to be 30,000 gallons, but the average daily consumption is not known. Data on the wells are given in table 9, and a chemical analysis of the water is given in table 5. The water is of good quality and is not treated.
Colby--Colby, the county seat and largest city in the county, obtains its water supply from five drilled wells (44-48) at the west edge of town. Data concerning these wells are given in table 9, and a chemical analysis of the water is given in table 5. Two of the wells are equipped with turbine pumps and the remaining three with double action plunger pumps. Storage is provided in a reservoir at ground level having a capacity of 500,000 gallons and an elevated tank holding 70,000 gallons.
According to O.L. Day, the largest consumption of the year occurs during the months from June to September. The greatest monthly consumption was in August, 1939, when 21,000,000 gallons was pumped. About 115,500,000 gallons, or 845 acre feet, was pumped during 1941. If the annual recharge is 18.3 acre feet (page 33) per square mile this would amount to the recharge from about 25 square miles.
Rexford--The city of Rexford, located in the northeastern part of the county, obtains its water supply from two drilled wells (26,27) at the east edge of town. Water is pumped from the wells to an elevated storage tank having a capacity of 50,000 gallons. Data on the wells are given in table 9, and a chemical analysis of the water is given in table 5.
Irrigation Supplies
The only adequate source of irrigation water in Thomas County is from pumped wells. Although irrigation has not been carried on extensively in the county, nine of the wells visited during the summers of 1942 and 1943 and listed in table 9 (7, 13, 14, 31, 33, 35, 36, 37, and 77) are classed as irrigation wells (pl. 4.). Of these, two wells (7 and 37) did not have pumps installed and were not in use, and two others had been used very little since their construction. Of the remaining five irrigation wells, three are located in valley areas and two on intermediate uplands. The static water level in two of the five wells was about 13 feet below land surface, and only one of them had a static water level of more than 100 feet. Chemical analyses of water from four of the irrigation wells (14, 31, 33, and 77) given in table 5 indicate that the quality of the water is satisfactory for irrigation purposes (Scofield, 1933). The total acreage irrigated each year in the county is not known but it is not large.
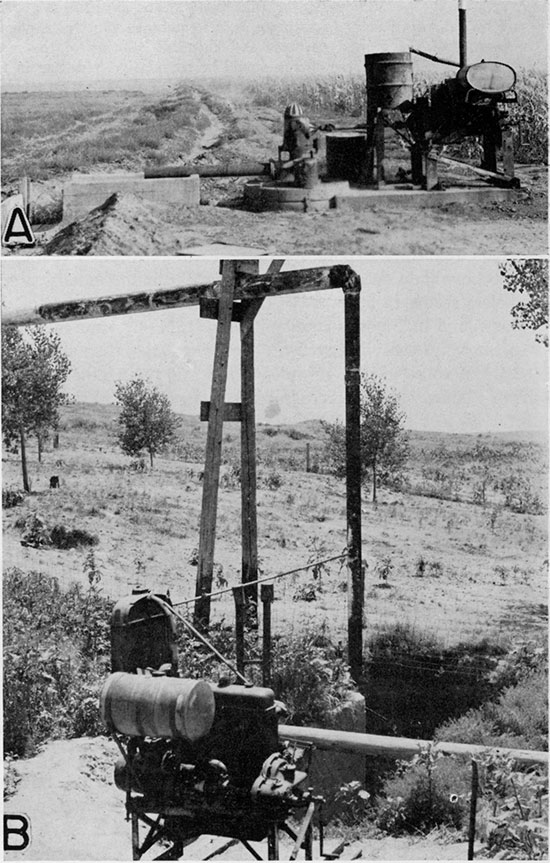
Plate 4--Irrigation wells in Thomas county: A, irrigation well (31) of E. F. Rail, SW SW sec. 26, T. 7 S., R. 31 W.; B, Irrigation well (14) of Jones Brothers, SE NW sec. 33, T. 6 S., R. 33 W. Six-inch centrifugal pump mounted in the bottom of the pit is driven by belt from the stationary engine. Elevated discharge pipe extends to left and empties into concrete flume on hillside.
The yields of irrigation wells in Thomas County range widely. In 1943, pumping tests were conducted on four of the seven irrigation wells in the county equipped with pumps, by Howard Palmer and Allan Graffham of the Division of Water Resources of the Kansas State Board of Agriculture in cooperation with the State and Federal Geological Surveys. The results of these pumping tests are given in table 4, and the recovery curves are shown in figure 10. It will be noted that the yields of these four wells ranged from 295 to 1,021 gallons a minute and their specific capacities ranged from 11.2 to 56.5. The average specific capacity of the four wells was 30.8.
The most extensive well-irrigation area in Kansas lies due south of Thomas County in the Arkansas River valley and the shallow water basins of Scott, Finney, and Grant counties. In Hamilton and Kearny counties (McLaughlin, 1943, p. 89) the range in yield of eight single-well pumping plants was 480 to 1,280 gallons a minute. The specific capacities of these wells ranged from 8.5 to 55.2 and averaged 20.9. In Finney and Gray counties (Latta, 1944, p. 107), the range in yield of 17 single-well pumping plants was 348 to 1,770 gallons a minute, and the specific capacities ranged from 10 to 141 and averaged 46.9. Although the yields of the four wells tested in Thomas County are slightly lower than in the large irrigation areas to the south, they nevertheless are in the same general range. Also, the specific capacities of these wells compare favorably with wells in Hamilton and Kearny counties but are appreciably lower than the specific capacities of irrigation wells in Finney and Cray counties.
A comparison of depth and diameter of the irrigation wells in Thomas County with those farther south shows that the Thomas County wells are generally deeper and of somewhat smaller diameter. In Hamilton and Kearny counties (McLaughlin, 1948, pp. 92, 98) 77 wells were less than and 19 more than 100 feet in depth, and the prevalent diameters were 16 and 18 inches. In Finney and Gray counties (Latta, 1944, pp. 111, 112) 170 wells were less than and 59 more than 100 feet deep, and the prevalent diameters were 15, 16, 18, and 20 inches. In Thomas County two of the irrigation wells are less than 100 feet in depth and 7 are more than 100 feet. The diameters of the nine wells are: two wells, 14 inches; five wells, 16 inches; one well, 18 inches; and one well, 32 inches.
In 1914 a well-irrigation plant was installed at the Colby experiment station at the southwest corner of the city of Colby, but the irrigation wells were later abandoned. Embert Coles has generously furnished data from his files concerning the operation of this plant. The plant consisted of two wells, 12 feet apart, equipped with 534-inch cylinder pumps powered by an eight-horsepower Fairbanks-Morse engine. The log of the well is given at the end of this report (no. 30). The depth to water level was reported to be 112 feet in 1914, and 112.5 feet in November, 1919. On May 18,1945, the east well was uncovered and measured by George S. Knapp and J. B. Kuska. The depth to water was found to be 114.8 feet below the 1919 measuring point. During 1919 the pumping plant was operated for 318 hours at a rate of 97.8 gallons a minute, which produced about 5.7 acre-feet of water. The cost of fuel and oil per acre foot of water pumped was reported to be $5.62, but it was impossible to determine the cost of plant depreciation, repair, and operation of equipment, so the total cost of the water per acre foot is not known. Although the cost of fuel probably could be lowered by using more economical pumping equipment, the fuel cost will be relatively high where the pumping lift (static water level plus draw-dawn) is great.
Possibilities of Future Development of Irrigation Supplies
The feasibility of further development of irrigation supplies from wells is dependent upon the safe yield of the groundwater reservoir (the amount of water that can be withdrawn annually over a long period of years without depletion), the cost of drilling and pumping, the topography of the land, and the soil and other factors beyond the scope of this report. The ability of an underground reservoir to yield water over a long period of years is limited, as is that of a surface reservoir. If water is withdrawn from an underground reservoir faster than water enters it, the supply will be depleted and the water level in wells will decline. The amount of water that can be withdrawn annually over a long period of years without depletion of the groundwater reservoir is dependent upon the capacity of the underground reservoir and the amount of water added annually by recharge.
The depth to water level and type of water-bearing material determine in part the cost of drilling and pumping. Some wells that may encounter relatively fine-grained material will have relatively small yields. Gravel packing may increase the yield of such wells but it also adds to the cost of construction.
For the purpose of more detailed description, Thomas County may be divided into three general areas. In the order of their irrigation possibilities these are (1) major valleys in northeastern and eastern parts of the county, (2) uplands in the northern and eastern parts of the county, and (3) southwestern upland area.
Major valleys in northeastern area--With respect to supply and cost of water, the major valleys in northeastern Thomas County present the most favorable areas for future irrigation development. Plate 2 shows that the depth to water level is less than 50 feet below the valley of South Sappa Creek from near Brewster to the Rawlins County line, and that the depth to water level below the valley of Prairie Dog Creek is less than 50 feet from east of Colby to the Sheridan County line. From north of Colby eastward the depth to water level below the bottom of South Sappa Creek valley is less than 25 feet and under part of the valley the water table stands only a few feet below the surface. Two irrigation wells are in operation along South Sappa Creek and pumping test data are given for one of these wells (14) in table 4. This well, which is equipped with a 6-inch centrifugal pump, yielded 637 gallons a minute with a drawdown of 15.37 feet, and had a specific capacity of 41.4. The total pumping lift to land surface (the water is discharged through an elevated pipe as shown in pl. 4B) was less than 30 feet. Such a well compares favorably with many of the wells in the extensive irrigation areas to the south (p. 50) and to the north in Nebraska. The cross sections (figs. 3 and 4) show that more than 100 feet of saturated water-bearing material occurs below the bottoms of these valleys and above the bedrock floor of Pierre shale. None of the wells now in operation in these valleys (with the possible exception of well 13) penetrates the entire thickness of water-bearing material; thus deeper drilling to the top of the Pierre shale would make available a larger quantity of water. Several thousand acres of land along South Sappa Creek in north-central Thomas County and Prairie Dog Creek near the east county line have suitable topography for irrigation and wells can be obtained that yield more than 500 gallons a minute with a total pumping lift of 50 feet or less. There are smaller areas having equally good possibilities along the valleys of the South Fork of the Solomon River and the North and South Forks of the Saline River in the eastern part of the county. The character of the water-bearing materials varies in short distances; therefore one or more test holes to determine the character of the sand and gravel are advisable before drilling an irrigation well.
Northern and eastern upland areas--Reference to plate 2 will show that there are extensive areas in northern and eastern Thomas County, in addition to the valley areas, where the depth to water level is less than 100 feet. The cross sections (figs. 3 and 4) show that under the northern, eastern, and central parts of the county there is from 100 to 150 feet of saturated water-bearing material above the floor of Pierre shale. Two of the irrigation wells tested and reported in table 4 are on the upland and intermediate levels in the northeastern part of the county. The static water level in one of these wells was 72.90 feet below the surface and in the other it was 104.32 feet below the surface; they yielded 1,021 and 588 gallons a minute and had specific capacities of 56.5 and 14.0 respectively. One other upland irrigation well north of Colby which was tested had a static water level of 128.01 feet below the surface, a. yield of 295 gallons a minute, and a specific capacity of 11.2. The data on these three wells indicate a wide range in the characteristics of upland wells in these parts of the county.
Quantities of water sufficient for irrigation can be obtained at many places on the upland and intermediate levels of northern, eastern, and central Thomas County. The pumping lifts will range generally from slightly less than 100 feet to more than 150 feet. Wells should be drilled through the entire thickness of the water-hearing material to the Pierre shale. The cost of construction and of pumping water from this depth, in addition to other factors, should be considered in any contemplated irrigation undertaking. Owing to the lateral variation in the water-bearing material of this area, one or more test holes should be put down before an irrigation well is drilled.
Southwestern upland area--As shown on plate 2, the dept to water level under nearly all of southwestern Thomas County is more than 100 feet and at some places it is as much as 200 feet. Cross section B-B' in figure 3 and cross section F-F' in figure 4 show that the thickness of saturated water-bearing material under this area is much less than in other parts of the county - in fact at some places there is less than 10 feet of saturated material above the Pierre shale. Although an adequate quantity of water is available for domestic or stock wells at most places in the southwestern part of the county, yields sufficient for irrigation purposes could be obtained at only a few places. The great depth to water level and relatively small quantities of water available under the uplands of the southwestern part of the county make this area generally unsatisfactory for well irrigation.
Quality of Water
The chemical character of ground water in Thomas County is indicated by the analyses in table 5 and in figures 11 and 12. The analyses were made by Howard Stoltenberg in the Water and Sew-age Laboratory of the Kansas State Board of Health. Twenty-four samples of water were collected for chemical analysis from representative wells distributed as uniformly as possible within the county. Twenty-three of the water samples were pumped from the Ogallala formation, and one sample (well 14) was pumped from the alluvium and the Ogallala formation. Analyses of the water pumped from the municipal wells at Brewster, Colby, and Rexford are also given in table 5.
Figure 11--Analyses of waters from the Ogallala formation in Thomas County. Numbers refer to analyses in table 5.
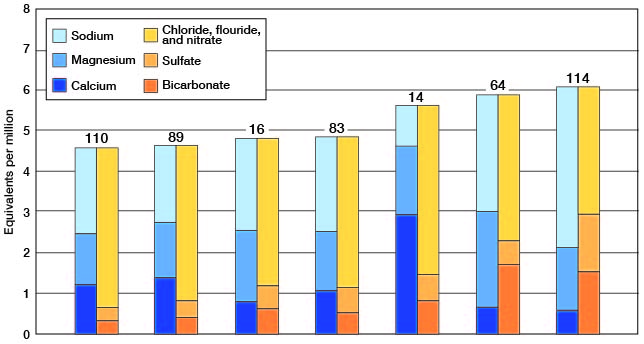
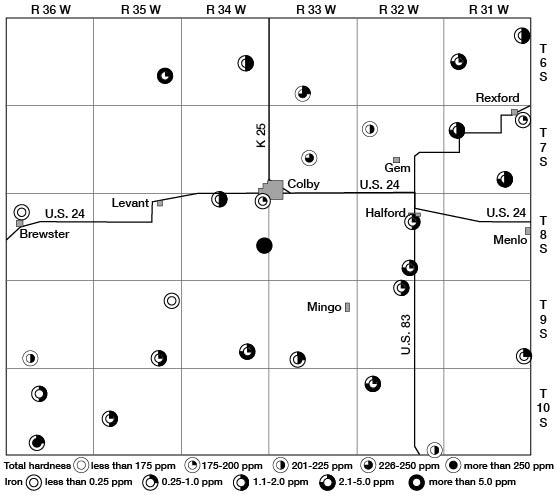
Figure 12--Map of Thomas County showing areal distribution of iron and total dissolved solids in well waters in Thomas County.
Chemical Constituents in Relation to Use
The following discussion of the chemical constituents of ground water has been adapted from publications of the United States Geological Survey and the State Geological Survey of Kansas.
Total dissolved solids--The residue left after a natural water has evaporated consists of rock materials, with which may be included some organic materials and a small amount of water of crystallization. Water containing less than 500 parts per million of dissolved solids generally is entirely satisfactory for domestic use, except for difficulties resulting from its hardness, and, in some areas, because of excessive iron corrosiveness. Water having more than 1,000 parts per million of dissolved solids is likely to contain enough of certain constituents to produce a noticeable taste or to make the water unsuitable in some other respects.
The total dissolved solids in samples of water collected from private wells in this area ranged from 225 parts per million in well 101 to 349 parts in well 114. As all of the samples collected contained less than 850 parts per million the water is suitable for most ordinary purposes. Thirteen of the samples contained less than 250 parts per million, eight samples contained between 250 and 300 parts, and only three samples contained more than 300 parts.
Hardness--The hardness of water, which is the property that generally receives the most attention, is most commonly recognized by its effect when soap is used with the water in washing. Calcium and magnesium cause almost all of the hardness of ordinary water. These constituents are also the active agents in the formation of the greater part of all the scale formed in steam boilers and in other vessels in which water is heated or evaporated.
In addition to total hardness, the table of analyses indicates the carbonate hardness and the non-carbonate hardness. The carbonate hardness is that due to the presence of calcium and magnesium bicarbonate, and it is largely removed by boiling. In some reports this type of hardness has been called temporary hardness. The non-carbonate hardness is due to the presence of sulphates or chlorides of calcium and magnesium, but it cannot be removed by boiling and has sometimes been called permanent hardness. With reference to use with soap, there is no difference between the carbonate and non-carbonate hardness. In general, the non-carbonate hardness forms harder scale in steam boilers.
Water having a hardness less than 50 parts per million is generally rated as soft, and its treatment for removal of hardness under ordinary circumstances is not necessary. Hardness between 50 and 150 parts per million does not seriously interfere with the use of water for most purposes, but it does slightly increase the consumption of soap; its removal by a softening process is profitable for laundries or other industries using large quantities of soap. Water in the upper part of this range of hardness will cause considerable scale in steam boilers. Hardness exceeding 150 parts per million can be noticed by anyone; if the hardness is 200 or 300 parts per million it is common practice to soften water for household use or to install a cistern to collect soft rainwater. Where municipal water supplies are softened, an attempt is generally made to reduce the hardness to 60 or 80 parts per million. The additional improvement from further softening of a whole public supply is not deemed worth the increase in cost.
The hardness of samples of water collected from wells in Thomas County ranged from 162 (well 89) to 270 (well 114) parts per million. Only two samples had more than 250 parts per million of hardness and 14 samples had less than 200 parts per million of hardness.
Iron--Next to hardness, iron is the constituent of natural waters that receives the most attention. The quantity of iron in ground waters may differ greatly from place to place, even though the waters are from the same formation. If a water contains much more than 0.1 part per million iron, the excess may separate out and settle as a reddish sediment. Iron, which may be present in sufficient quantity to give a disagreeable taste and to stain cooking utensils, may be removed from most waters by simple aeration and filtration, but a few waters require the addition of lime or some other substance.
Two of the samples collected in Thomas County (wells 33 and 92) contained less than 0.15 part per million of iron; 20 samples contained between 0.15 and 5.0 parts, and two samples (wells 64 and 21) contained more than 5.0 parts. The highest iron content was in the sample collected from well 21, which contained 10 parts per million.
Fluoride--Although determinable quantities of fluoride are not as common as fairly large quantities of other constituents of natural waters, it is desirable to know the amount of fluoride present in water that is likely to be used by children. Fluoride in water has been shown to be associated with the dental defect known as mottled enamel which may appear on the teeth of children who drink water containing excessive quantities of fluoride during the period of formation of the permanent teeth. It has been stated that waters containing 1 part per million or more of fluoride are likely to produce mottled enamel, although the effect of 1 part per million is not usually very serious (Dean, 1936). If the water contains as much as 4 parts per million of fluoride, 90 percent of the children exposed are likely to have mottled enamel and 35 percent or more of the cases will be classed as moderate or worse. Recent work has indicated a beneficial effect from the presence of a small amount of fluoride in drinking water in decreasing the incidence of dental caries. Discussions in the literature suggest that this beneficial effect may be produced by quantities of fluoride of less than 1 part per million which would not have any measurable effect upon the quality of tooth enamel (Dean, Jay, Arnold, and Elvove, 1941).
Two samples of water collected from wells 2 and 33 in Thomas County contained 2.0 parts per million of fluoride, 19 samples contained less than 2.0 parts but more than 1.0 part, and 3 samples contained less than 1.0 part. Well 101 had the lowest fluoride content--0.5 part per million.
Sanitary Considerations
The analyses of water given in table 5 indicate only the amount of dissolved mineral matter in the water and do not indicate the sanitary quality of the water. An abnormal amount of certain mineral constituents, such as nitrate or chloride, however, may indicate pollution of the water.
The entire population of Thomas County and nearly all of the livestock are dependent on well-water supplies as there are no permanently flowing streams in the county. Although the county has three municipal water plants that are safeguarded against pollution, a large percentage of the population is dependent upon private wells, and every precaution should be taken to protect these supplies from pollution. Deep drilled wells on the uplands that penetrate relatively impervious silt above the water table are less subject to pollution than are shallow dug or driven wells in the valleys where pervious sandy material extends from the surface down to the shallow water table. A well should not be located close to or below possible sources of pollution, such as barnyards, privies, and cesspools, and every well should be tightly sealed down to a level somewhat below the water table. It is generally advisable to locate a well on a spot that is slightly higher than the surrounding ground, or bank earth around the top of the well so that surface drainage will run away from rather than into the well. If a well must be located near a source of possible pollution it should be up slope from it so that rain water will run from the location of the well toward the source of pollution rather than toward the well. Drilled wells are generally satisfactorily protected by the casing, although some are poorly sealed at the top.
Quality in Relation to Stratigraphy
Nearly all the water wells in Thomas County obtain water from the sand and gravel beds of the Ogallala formation, but a few wells draw water from the alluvial deposits along the valleys and some wells penetrate water-bearing material in both the alluvium and the Ogallala formation. Although thin beds of sand and gravel occur locally in the basal part of the Sanborn formation, very few wells obtain any water from that source. The Pierre shale, which underlies the Ogallala formation, is encountered at greater depths than the other water-bearing formations, and because of its impervious nature it is not a good water-bearing formation.
With the exception of the sample of water from well 14 that encounters both alluvium and the Ogallala sediments, all of the analyses reported in table 5 and figure 11 are of water pumped from the Ogallala formation; therefore the general discussion of chemical constituents in relation to use applies specifically to water in the Ogallala formation.
Prev Page--Ground Water Start || Next Page--Water Bearing Formations
Kansas Geological Survey, Thomas County Geohydrology
Web version Nov. 2001. Original publication date Dec. 1945.
Comments to webadmin@kgs.ku.edu
The URL for this page is http://www.kgs.ku.edu/General/Geology/Thomas/05_gw2.html