Prev Page--Geology || Next Page--More on Ground Water
Ground Water
Source
The following discussion on the source and occurrence of ground water has been adopted from Meinzer (1923, pp. 2-102) and the reader is referred to his report for a more complete discussion of the subject. A summary of groundwater conditions in Kansas has been made by Moore (1940).
Water that occurs in the pores or openings of the rocks and within the zone of saturation is called ground water. The amount of ground water that can occur below any region and the manner and rate of its movement to wells or springs is largely controlled by the character of the rocks.
In Thomas County, as in other parts of the High Plains, ground water is derived almost entirely from precipitation in the form of rain or snow. Part of the water that falls as rain or snow is carried away by surface runoff and is lost to streams, part of it may evaporate or be absorbed by vegetation and transpired into the atmosphere. The part that escapes surface runoff, evaporation, and transpiration percolates downward through the soil and underlying strata until its reaches the water table, where it joins the body of ground water in the zone of saturation. In the southern High Plains the average amount of rainfall entering the groundwater body each year has been determined by two different investigations as about one-fourth inch (Frye, 1942, p. 66) and as about one-half inch (Theis, Burleigh, and Waite, 1935, pp. 1-4). The geologic conditions in Thomas County are somewhat different from those in the two areas farther south, but the average annual rainfall is about the same and the amount of rainfall reaching the groundwater body in this area is probably of the same order of magnitude. Although this is a small percentage of the annual rainfall it should be noted that one-fourth inch of water entering the groundwater reservoir under 1 square mile amounts to 4,344,674 gallons or 13.3 acre feet, and one-half inch of rainfall over 1 square mile amounts to 8,689,348 gallons.
Ground water moves slowly through the rocks in directions determined by the shape and slope of the water table, which is controlled by topography, local variations in the quantity of recharge or discharge, and the stratigraphy and structure of the rocks. It is eventually discharged through springs or wells, through seeps into streams, or by evaporation or transpiration in bottom lands adjacent to streams. Most of the water obtained from wells in Thomas County comes from precipitation in the general vicinity and adjacent areas to the west.
Occurrence
Nearly all rocks that underlie the surface of the earth at depths shallow enough to be penetrated by drills contain various percentages of open spaces. These voids or interstices range in size from microscopic openings to the large caverns developed in limestone regions. The percentage of the volume of the rock mass consisting of such open spaces determines the porosity. Therefore, if we know the porosity of any rock we can determine the amount of water that it can hold. Although it is desirable when considering problems of groundwater supply to know the porosity of the strata under an area it is the permeability of the material that influences the amount of ground water which can move through it toward a pumping well. The permeability of a rock is determined by the size, shape, and arrangement of the openings. For instance, a bed of fine silt or clay might have a relatively high porosity, but because of the size of the particles each opening is very small. As the force known as molecular attraction holds a very thin layer of water on the surface of each grain, these layers of water (that are not free to move) might fill or almost fill all the openings in such a fine-textured sediment; thus the permeability, or water yielding capacity of the rock, is very low even though its porosity, or water holding capacity, is quite high. Likewise, larger openings that are not connected or are poorly connected might produce a high porosity and a low permeability. Water moves most freely through a rock that has relatively large and well-connected openings. Several common types of openings or interstices and the relation of texture to porosity are shown in figure 5.
Figure 5--Diagram showing several types of rock intensities and the relation of rock texture to porosity. A. Well-sorted sedimentary deposit having high porosity; B. poorly sorted sedimentary deposit having low porosity; C. Well-sorted sedimentary deposit consisting of pebbles that are themselves porous, so that the deposit as a whole has a very high porosity; D. well-sorted sedimentary deposit whose porosity has been diminished by the deposition of mineral matter in the interstices; E. rock rendered porous by solution; F. rock rendered porous by fracturing. (From O.E. Meinzer.)

The Water Table and Movement of Ground Water
Shape and slope
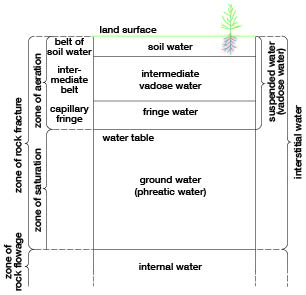
The water table is defined as the upper surface of the zone of saturation, except where that surface is formed by an impermeable body (Meinzer, 1923a, p. 32). It may also be regarded as the boundary between the zone of saturation and the zone of aeration (fig. 6). The water table is not a static level surface but rather is generally a sloping surface which shows many irregularities caused by differences in permeability of the water-bearing materials or by unequal additions to or withdrawals from the groundwater reservoir at different places.
Figure 6--Diagram showing divisions of subsurface water. (From O.E. Meinzer.)

The shape and slope of the water table in Thomas County are shown on the map (pl. 1) by means of contour lines drawn on the water table. Each point on the water table along a given contour line has the same altitude. These water-table contours show the configuration of the water surface just as contours on a topographic map show the configuration of the land surface. The direction of movement of the ground water is at right angles to these contour lines--in the direction of the greatest slope.
The map shows that the water under the plains moves through the county in a general easterly direction, but that the direction of movement and the slope are somewhat different in various parts of the county. The average gradient, of the water table is about 12.5 feet to the mile. In the area south of Brewster and Levant the slope of the water table is as much as 30 feet to the mile and in an area south of Colby the slope is as little as 6 feet to the mile.
In general the contours show a remarkable evenness of water-table slope throughout the county. In the northern and particularly the northwestern part of the county the shape of the contours indicates a northerly component to the direction of groundwater movement. This is probably caused by the deeply entrenched stream valleys in Rawlins County to the north which afford points of groundwater discharge.
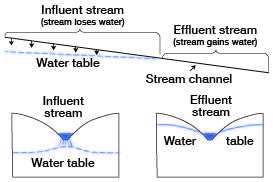
The only stream valley in Thomas County that seems to exert a noticeable influence on the shape of the water table is South Sappa Creek. This is probably because South Sappa Creek is the only stream that has entrenched its valley to the level of the water table, and this has been accomplished only in the area north of Gem. For several miles upstream from the point where the 3,000-foot contour line crosses the valley the contours under the valley are convex to the east, indicating a slight ridge on the water table; whereas downstream from this point to the Rawlins County line the contours are concave eastward, indicating a depression in the water table. This change in shape is due to the fact that the floor of the valley is slightly above the water table and along the valley surface water enters the groundwater body more rapidly than elsewhere in the county. At the 3,000-foot line the valley floor is just at the level of the water table, and downstream from that point, where the valley bottom is slightly below the general level of the water table, some water enters the valley as seepage. A stream whose channel neither gains nor loses with respect to ground water is in equilibrium with respect to the water table. Figure 7 shows these relationships.
Figure 7--Diagrammatic sections showing influent and effluent streams. (From O.E. Meinzer.)

Other than South Sappa Creek the only stream in the county that has reduced its valley bottom to the level of the water table is the South Fork of the Solomon River. In the first few miles of this valley west of the Sheridan County line and south of Menlo the stream is about at the level of the water table. All other streams in Thomas County flow at a level above the water table and receive no discharge from the groundwater reservoir. The relatively impervious nature of the surficial materials seemingly prevents water in large quantities from entering the ground from the channels as only one stream coincides for any appreciable distance with a "mound" or "ridge" on the water table. As can be seen on plate 1 this stream flows through a valley cut into the sand and gravel beds of the Ogallala formation which are relatively permeable and afford good infiltration possibilities. Stream channels that are above the water table (influent streams) do not gain water from groundwater seepage; thus they contain flowing water only during and immediately after rains.
The elevation of the low water levels in the major streams was determined instrumentally at selected points. These elevations are shown on plate 1 and give a direct comparison between the altitude of stream channels and the surface of the water table.
Relation to topography
On the map (pl. 2) are shown the depths to water level in Thomas County. In preparing this map the more general irregularities of the topography were taken into account by using aerial photographs and a drainage map. As topographic maps are not available for any part of Thomas County, the depth to water map must be considered generalized and not presumed to be accurate in all details. As shown on the map, the depth to water level ranges from more than 200 feet below the surface in an area north and northeast of Brownville to depths of only a few feet along the lower courses of such valleys as Sappa Creek, Prairie Dog Creek, and the Solomon and Saline rivers. The water level under several large areas in the east-central part of the county is less than 100 feet below the surface.
In general the shape of the water table conforms to the regional topography but is little affected by minor or local features. That is, the water table is essentially a plane and in that respect conforms to the regional topography of the High Plains, but its shape is not affected by local features of topography, for it passes below the valleys of the area with no perceptible change (with the exceptions noted above). Thus local low areas in the topography result in a reduced depth to water level almost directly proportional to the depth of the surface features.
Fluctuations of the water table
The water table does not remain in a stationary position but fluctuates up and down much like the water level in a surface reservoir. If the inflow to the underground reservoir exceeds the draft, the water table will rise; conversely, if the draft exceeds the inflow, the water table will decline. Thus the rate and magnitude of fluctuation of the water table depends upon the rate and magnitude at which the underground reservoir is replenished or depleted.
Factors controlling the rise of the water table in Thomas County are the amount of rainfall within the county that descends through the soil to the water table, the amount of seepage that reaches the underground reservoir from surface streams, and the amount of water entering the county beneath the surface from areas to the west. All these factors depend upon precipitation either in or immediately adjacent to the west edge of the county.
Factors controlling the decline of the water table are the amount of water pumped from wells, the amount of water absorbed directly from the water table by plants (transpiration), the amount of water lost from the groundwater reservoir by evaporation, and the amount of ground water passing beneath the surface into adjacent areas.
Changes in the water levels in wells record the fluctuations of the water table, which in turn record the recharge and discharge of the groundwater reservoir. In order to determine the character and magnitude of water-level fluctuations in Thomas County, 10 wells were selected for observation, and periodic measurements of the depth to water level in them were begun in July, 1942. Since the original measurements by me in 1942, measurements of water levels in these wells have been made by W.W. Wilson, Allan Graffham, and Howard Palmer. Complete records for these wells are published annually by the Federal Geological Survey (Meinzer and Wenzel, 1944, pp. 174-177). The numbers of the observation wells previously published and the numbers used in this report are given in table 3.
Table 3--Observation wells in Thomas County.
| Well No. in this report |
Well no. in Meinzer and Wenzel (1944) |
Well No. in this report |
Well no. in Meinzer and Wenzel (1944) |
|
| 25 | 12 | 60 | 26 | |
| 37 | 9 | 71 | 7 | |
| 43 | 21 | 72 | 2 | |
| 53 | 4 | 82 | 33 | |
| 54 | 13 | 91 | 1 |
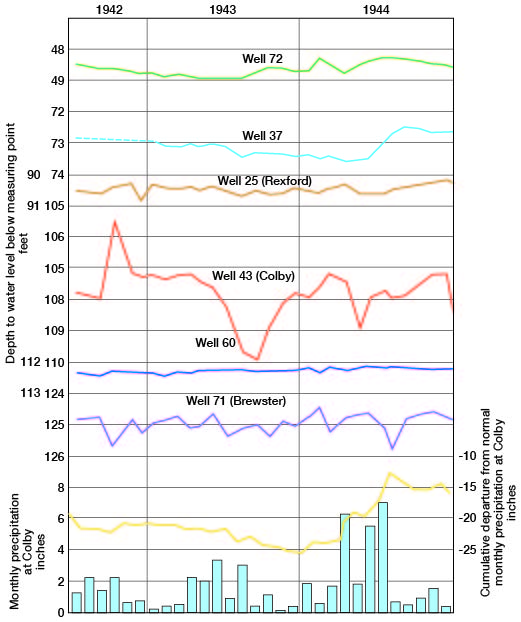
The fluctuations of the water level in six typical observation wells in Thomas County during the period of and monthly precipitation at Colby are shown in figure 8.
Figure 8--Hydrographs of six typical observation wells in Thomas County and the monthly precipitation at Colby. (Precipitation data from U.S. Weather Bureau.)

Recharge
Recharge is the addition of water to the underground reservoir and may be accomplished in several ways. All ground water within a practicable drilling depth beneath Thomas County--that is, the water in the Tertiary and Quaternary deposits above the Pierre shale--is derived from water that falls as snow or rain either within the area or on nearby areas to the west. Once the water becomes a part of the groundwater body it moves down the slope of the water table, later to be discharged, for the most part at some point beyond the limits of the county.
Recharge from local precipitation--The average annual precipitation in Thomas County is about 18 inches but probably only a small fraction of this amount enters the zone of saturation, thus serving to recharge the groundwater reservoir. The depth to the water table exerts an important influence on the amount and frequency of recharge. The valley of South Sappa Creek receives above average recharge, for the water table stands only a few feet below the surface and the material above the water table consists dominantly of sand and gravel. The gently rolling divide areas underlain by thick silt deposits are areas of below average recharge because of good surface drainage and low permeability of surficial materials.
Rodent burrows and sod cracks probably are important avenues of access for rainwater entering the ground. During dry seasons extensive sod cracks are reported to have developed in various parts of Thomas County. Although I have not observed these cracks they are reported to attain a width of several inches and to extend along the surface for several hundred feet. Cracks or openings not visible at the surface probably occur within the body of the massive silt. This was demonstrated when the test drill lost circulation while drilling several test holes through this material.
Recharge to the groundwater reservoir is indicated by a rise in the water level in wells not influenced by pumping. Selected wells throughout the county have been measured periodically and the records of six of these are given in figure 8 with the monthly rainfall data at Colby. Three of these wells (25, 43, 71) are less than a half mile from the city pumping plants of Brewster, Colby, and Rexford and therefore may be influenced by the pumping of these city wells. In any case they show no recognizable correlation with rainfall. Well 72 is the only one of the three wells unaffected by pumping having a water level of less than 50 feet. Although the correlation between the water-level fluctuations in this well and the precipitation at Colby is not too apparent, the water level nevertheless seems to exhibit some response to rainfall. Well 37, which has a water level of more than 70 feet, had a pronounced rise in water level starting in July, 1944, in response to the unusually heavy rainfall from April to July, 1944. In well 60, which has a depth to water level of more than 110 feet, there was a slight rise in water level during the period of record.
Recharge from streams and ponds--During periods of maximum flow in the major streams of the county some water probably leaves the channels and moves into the adjacent alluvium and underlying Ogallala formation. Most of the water from surface streams that recharges the groundwater reservoir represents water that fell as rain within the county, for North and South Sappa creeks are the only two streams that have any appreciable drainage area outside of Thomas County.
The massive silt of the Sanborn formation which underlies much of the upland surface of the county is relatively impervious, thus retarding or preventing the downward percolation of water. Many shallow undrained depressions on this surface catch and hold rainwater and prevent surface runoff. The fact that these shallow depressions, some of which are more than 150 feet above the water table, are occupied by shallow ponds for weeks after a heavy rain seems to indicate that even in these areas the water percolates downward very slowly and most of it evaporates (pls. 5A and 6A). Recent studies of recharge from shallow depressions in the High Plains of Texas (White, Broadhurst, and Lang, 1940, pp. 6-8) showed that recharge from some ponds was quite rapid, whereas in others it was slow or nonexistent. The problems of the two areas are not entirely similar, for in the Texas area beds of caliche locally prevent downward movement of water, whereas in Thomas County caliche does not seem to be effective in this respect but nearly all the ponds are underlain by homogeneous deposits of silt. In advocating his hypothesis for the origin of High Plains depressions, Johnson (1901) assumed that significant quantities of water entered the ground from these depression ponds.
Recharge from subsurface inflow--As indicated by the slope of the water table (pl. 1), the movement of ground water in this area is in an easterly direction; hence recharge from precipitation or stream flow that occurs in areas immediately adjacent to the west eventually moves into this area and contributes to the available supply of ground water. As shown by the cross sections in figures 3 and 4, the water-bearing materials are relatively thin along the western edge of the county in the area south of Brewster; therefore, the quantity of water entering the county as subsurface inflow is probably small.
Discharge
Natural discharge at the surface--Before any wells were drilled the groundwater reservoir of Thomas County was in a state of approximate equilibrium--that is, the average annual recharge was balanced by an approximately equal average annual discharge. The greater part of the discharge occurred by groundwater movement out of the county beneath the surface to the north, east, and south. A small amount of discharge probably occurred from seeps along the valley of South Sappa Creek where it is at the level of the water table and a small amount of water was discharged by direct evaporation and by transpiration from trees, grasses, and shrubs in the shallow water areas along the major valleys.
Discharge from wells--At the present time wells constitute one of the principal means of discharge of ground water within the county. Although the quantity of water pumped annually from wells in Thomas County is not known, the city supplies of Brewster, Colby, and Rexford and several railroad supplies are obtained from wells, and several irrigation wells have been in operation. Most of the rural residents of the county obtain their domestic and livestock supplies from wells, but the total volume of water pumped for such use is comparatively small.
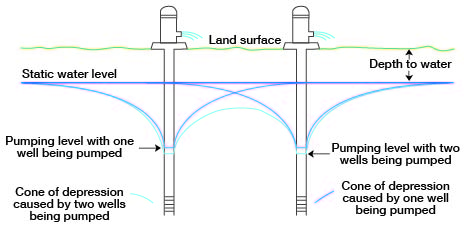
Fluctuations caused by pumping--The water table in the vicinity of a well that is being pumped declines and an inverted cone with its apex at the well (fig. 9) is developed. This cone represents a loss of storage by the unwatering of a portion of the previously saturated material surrounding the well. When pumping stops, the movement of water from surrounding areas into the depressed area continues until the depression is filled. This results in a slight decline of the adjacent regional water table. In an area such as the city well field at Colby where several wells are pumped intermittently, the fluctuations of water level in any one well are complicated and represent the sum of the effects of pumping or recovery from many nearby wells.
Figure 9--Diagrammatic section of two closely spaced pumping wells showing mutual interference between wells and the resulting cones of depression.

Prev Page--Geology || Next Page--More on Ground Water
Kansas Geological Survey, Thomas County Geohydrology
Web version Nov. 2001. Original publication date Dec. 1945.
Comments to webadmin@kgs.ku.edu
The URL for this page is http://www.kgs.ku.edu/General/Geology/Thomas/05_gw.html