![]()
Prev Page--Mineral Composition Profiles || Next Page--Resistivity Image Logging
The Dipmeter Tool
The determination of the dip and strike of beds is a routine measurement in outcrop descriptions as part of field mapping and the resolution of structural geometry and tectonics.
In addition, the dip and strike of crossbedding features is a key element in sedimentology studies of transport direction and facies.
The dipmeter is a tool with arms arranged radially around a central mandrel with pads pressed against the borehole wall by a spring mechanism. Each pad measures the microresistivity of the formation.
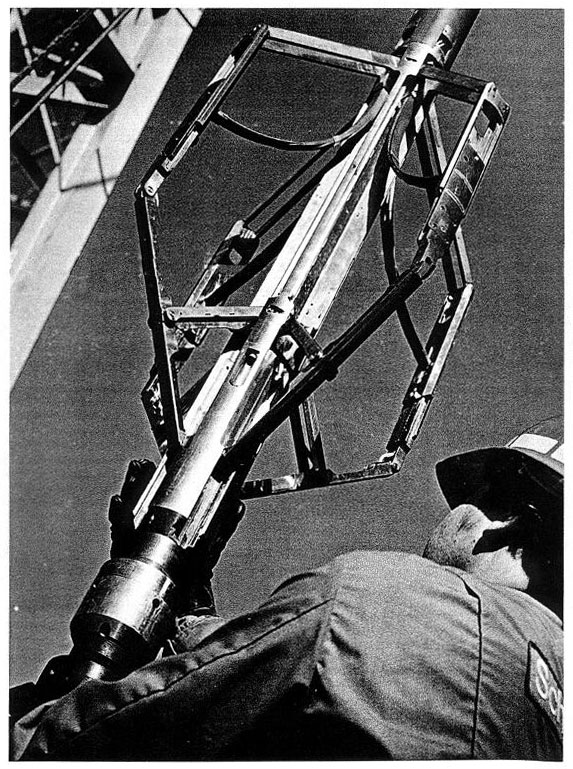
By correlating a microresistivity feature across the borehole, a plane can be defined and its dip and strike computed.
Early dipmeters in the 1940s had three pads which is the minimum number needed to define a plane.
These evolved to the four-arm dipmeter in the 1960's and the modern dipmeter which has six arms to help in the distinction of real bedding features from artefacts.
Next, we will see how the microresistivity curves are analyzed for dip and strike measurements.
Dip and Strike Determination from the Dipmeter
The graphic shows a highly simplified representation of the logs recorded by the dipmeter.
On a four-arm device the microresistivity pads are identified by number. Pad #1 is used as the reference pad for tool orientation.
As the tool is pulled upwards, the deviation of the borehole from the vertical causes it to tilt and this is recorded in Track 1 as the borehole deviation angle by a weighted pendulum
The winding of the logging cable on the winch causes the tool to rotate and the direction of Pad #1 is continuously recorded by a compass in Track 1 as the azimuth
The raw results of a dipmeter run are microresistivity traces.
The fine vertical resolution allows features as thin as one to two centimeters to be resolved.
Because lithological changes are relatively minor when traced across the width of the borehole, the overall form of the resistivity traces tends to be similar.
The relative depth shift between correlative features is a function of their strike and dip.A planar feature will sketch out a sinusoid on the "flattened" borehole wall.
The results of the microresistivity correlations of strike and dip are presented as a vector plot (or "tadpole plot").
Tadpole Pattern Recognition
The vector (or tadpole) plot summarises the correlation of microresistivity features recorded by the dipmeter.
- In the early days, the correlation of features was made visually and dip and strikes calculated laboriously.
- In perhaps the earliest routine geological computer application, the digital microresistivity logs were correlated statistically.
- The result of each successful correlation is displayed on the processed dipmeter log as a vector or "tadpole".
Each tadpole has the information of
- its depth
- its dip, as referenced to the scale
- its direction of dip, reflected by the orientation of the tail on a conventional compass circle
- its value, indicated by the tadpole head, with the strongest correlation shown by a solid circle, then progressive degrees of doubt expressed by an open circle, and then a cross. Depth ranges with no tadpoles signify intervals where the computer processing failed to find any reasonable correlation matches.
Patterns of tadpoles are then clustered by a color convention, prior to geological interpretation.
In order to be included in a pattern, the tadpoles must be contiguous and have a similar azimuth
- a GREEN pattern is signified by a common azimuth and essentially constant dip.This pattern most commonly represents regional stratigraphic dip.
- a RED pattern is signified by a common azimuth and increasing dip with depth. This pattern is most commonly associated with compactional drape.
- a BLUE pattern is signified by a common azimuth and decreasing dip with depth. Within sandstones and carbonates, the pattern often reflects cross-bedding.
- a "WHITE" pattern occurs when the tadpoles appear to be randomly scattered with respect to both dip and azimuth. The randomness is not attributed to tool or processing errors, but to systematic features on the borehole wall that appear to have random orientations. So, for example, chaotic bedsets in a braided stream deposit might show this character.
Examples of these patterns and their geological meaning will be shown by examples on the following pages.
An Unconformity with Change in Regional Dip
This dipmeter example was run in an offshore well on the east coast Canadian continental shelf.
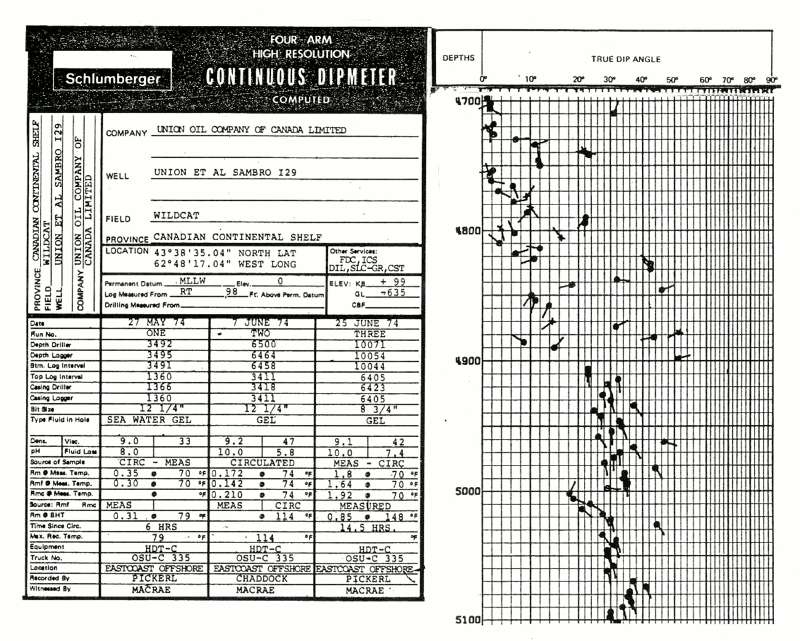
A major unconformity occurs at a depth of 4900 feet with
- rather erratic dips in the Cretaceous section above the unconformity, and
- an abrupt change to a systematic dip of about 30 degrees to the south-south-east in the Jurassic section below.the unconformity
This stratigraphic pattern is corroborated by a seismic section shot near the well, as shown next.
A Match of a Dipmeter Log with a Seismic Section
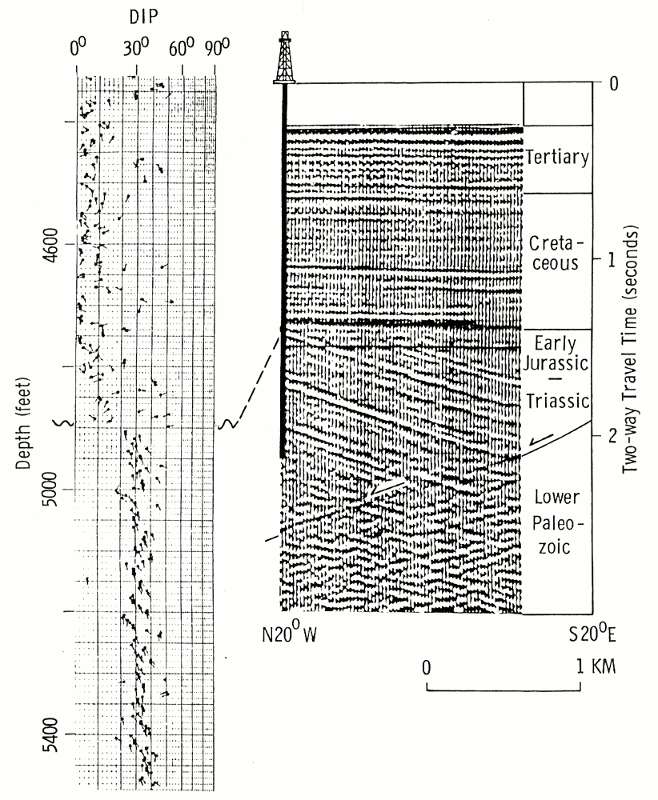
On the left of the graphic, we see an expanded section of the dipmeter log shown on the previous page.
On the right is the seismic section, with the location of the well to the left.
Notice that the seismic section has a N20W-S20E orientation, so that the dipping reflections in the Jurassic section match those indicated by the dips of the dipmeter log.
The relationship between dip in degrees shown on a dipmeter and stratigraphic correlation expressed in terms of depth difference should be considered carefully.
Dips and Stratigraphic Correlation
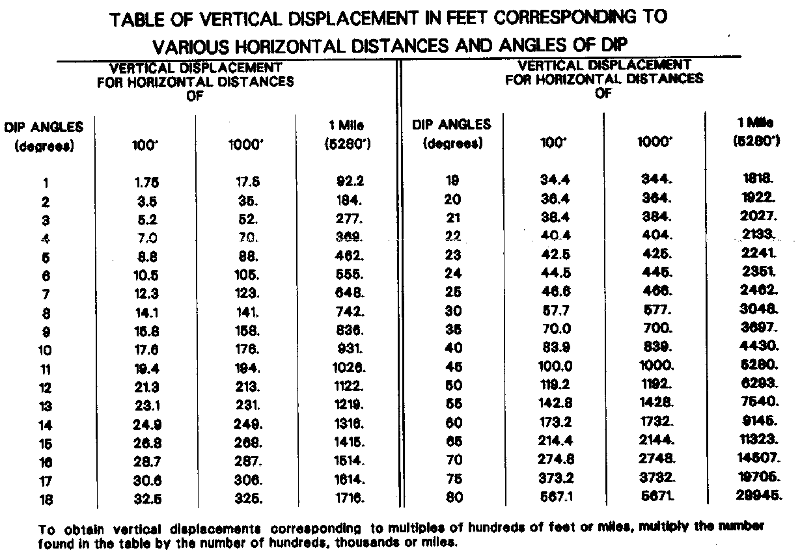
The relationship between dip and stratigraphic correlation is often not intuitively obvious because of the huge vertical exaggeration routinely used in the display of geological cross-sections. Regional dips are generally fairly gentle, so that formation stratigraphy would be obscure if sections were plotted on equant scales.
It is not uncommon for a table of dip degree and equivalent stratigraphic displacement between wells to be printed on dipmeter logs, as shown in the example below. Reference to the table allows a systematic integration of dipmeter dips with structural mapping.
In the next example, we see the dipmeter used as a tool to evaluate compactional drape in the Pennsylvanian Cherokee of southeast Kansas.
Locating a New Field Well from Dipmeter Analysis
The Pennsylvanian Cherokee sandstones of south-eastern Kansas are commonly elongate and sinuous bodies whose shape reflects their origin in alluvial channels and bars. Consequently, it is often difficult to locate and determine the position and orientation of sandstone units in an efficient manner that optimizes a successful drilling program.
This example shows the results and analysis of a dipmeter run from one of several dipmeter surveys made in a sequence of wells drilled through a productive development of the Bartlesville Sandstone. The purpose of the dipmeter work was to determine the orientation of the sandstone and the location of the central axis (the thickest part ;of the sandstone) with reference to the existing well control.
The gamma ray log shows a section that is primarily shale with a development of the Bartlesville Sandstone towards the base.
The shallow dips of the tadpole plot are characteristic of many Midcontinent stratigraphic sequences where regional structure is fairly subdued. The highest shales show very minor dips with no discernible preferred orientation, that grade downward to a zone with small dips in an eastern orientation. These sets probably match local structural dip.
In the zone immediately above the Bartlesville sandstone, there is a marked increase in dip, with an overly western orientation and probably represents structural drape of the shale over the sandstone. The data suggest that the long-axis of the sandstone is oriented north-south, and, if the upper surface of the sandstone is convex, that the central axis lies to the east of the well.
The dips within the sandstone show an abrupt contrast, with dips strongly aligned to the south. If the dips discriminate the surfaces of cross-bedding sets, then the cross-bedding direction is aligned with the axis of the sandstone body. This interpretation would suggest a current flow from north to south, and the depositional origin of the sandstone body as a channel.
Schlumberger recommended to the operator that the next development well should be drilled a short distance to the east.
In the next example, we will see a sedimentological interpretation of dips within a Morrow Sandstone section.
Sedimentological Interpretation of Dip Patterns in the Morrow Sandstone
Luchtel (1999) combined a core description of a Morrow Sandstone section with its dipmeter log as a composite analysis of facies and transport direction.
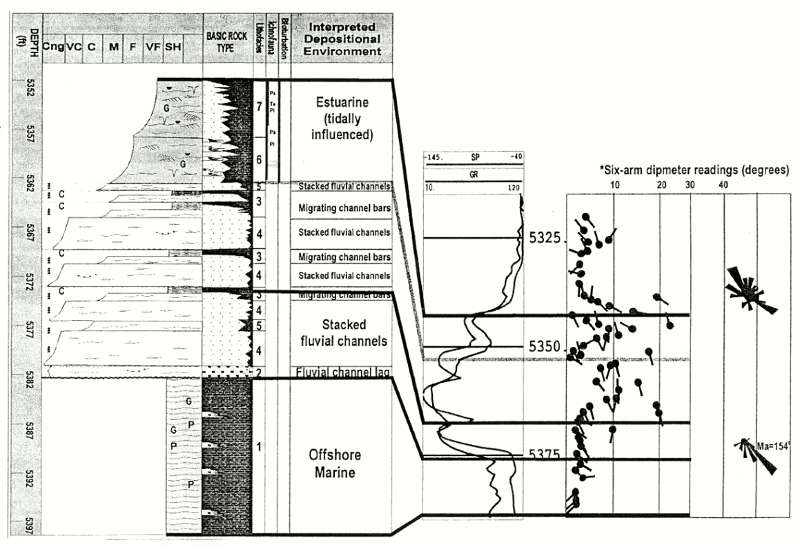
In the figure above, we can see distinctive dip patterns which are easy to interpret.
The shale above the sandstone shows small dips in a westerly direction that indicates regional stratigraphic dip and a red pattern near the sandstone contact that probably reflects compactional drape.
The uppermost sandstone unit was interpreted to be estuarine and tidal influence is suggested by the distinctive bimodal character of the dips that can be seen in the tadpoles and the rose diagram with directions to the south-east and north-west.
The middle sandstone unit consists of stacked fluvial channels with unimodal blue dip patterns of crossbeds oriented to the southeast
The lowest sandstone unit has a uniform pattern of low-angle dips to the south-south-east
The shale below the sandstone has a green pattern of shallow dips to the south-west that probably reflects regional stratigraphic dip.
In the final example, we look at crossbeds in a Pennsylvanian ooolitic bar limestone.
Oolite Bar Crossbeds in the Pennsylvanian Swope Limestone
The high-porosity oolitic bar limestone is immediately apparent in the Swope Limestone section of a well drilled in Seward County. Kansas.
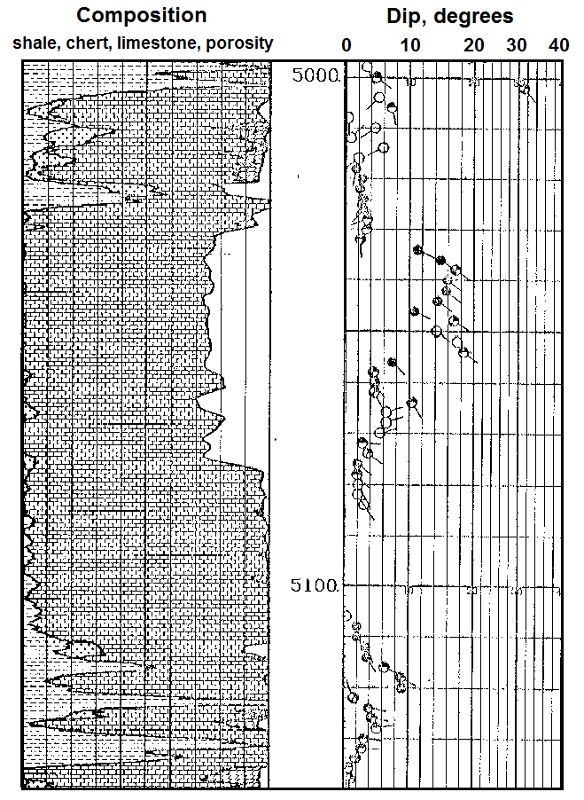
The composition plot was computed by the logging truck computer from gamma-ray, photoelectric factor, density, and neutron porosity logs.
The dip patterns of decreasing dip with depth and common azimuth to the south-east discriminate stacked cross-bedded units within the oolite bar.
Prev Page--Mineral Composition Profiles || Next Page--Resistivity Image Logging
Kansas Geological Survey
Placed on web March 24, 2017.
Comments to webadmin@kgs.ku.edu
The URL for this page is http://www.kgs.ku.edu/Publications/Bulletins/LA/13_dipmeter.html