![]()
Prev Page--Nuclear Porosity Logs || Next Page--The Photoelectric Factor (PeF) Curve
Reading Lithology from a Neutron-Density Porosity Log Overlay
In the last lesson we saw how it is now common practice to display BOTH the density and neutron porosity curves, as a means to correct for the effect of different lithologies.
When both curves are scaled to an equivalent limestone porosity, then the actual volumetric porosity is about midway between the curves in shale-free limestones, dolomites, and sandstones. Porosity estimation in these three major reservoir rock types is what pays for these logs to be run for the purposes of formation evaluation by petroleum engineers..
If the overlay is used to compensate for lithology effects on these logs, then it follows logically that a geologist should be able to "read" these same effects in a geological interpretation of logged sections. Let us see how this works from looking at what we would expect to see in a hypothetical overlay of neutron and density logs for a simple sequence of sandstone, limestone, and dolomite, interbedded with shales.
The Gamma-Ray, Neutron-Density Overlay Template
As shown by this template:
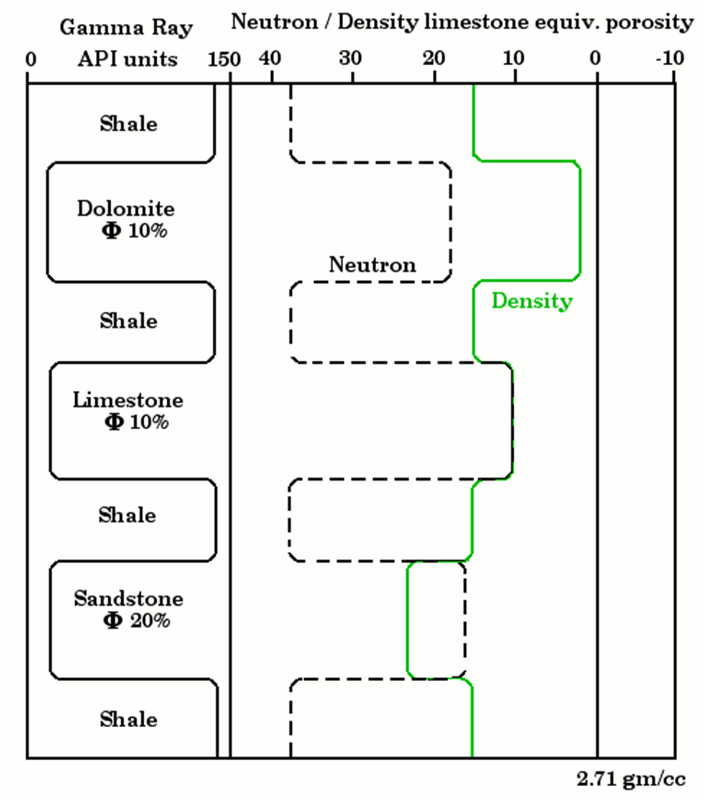
Limestones generally have a low gamma-ray value, and a coincident density and neutron response, because of common calibration to an assumed limestone porosity scale.
Dolomites have a low gamma-ray value, a relatively low density porosity (because the grain density of dolomite is higher than calcite) and a relatively high neutron reading ( because the neutron moderating character of dolomite is higher than calcite).
Sandstones have a low gamma -ray value, a relatively high density porosity ( because the grain density of quartz is less than calcite), and a relatively low neutron reading.
Shales show a high gamma-ray reading, a high neutron reading, and a moderate density reading. (However, the neutron and density readings of shales will vary with the degree of their compaction.)
Although shales, limestones, dolomites and sandstones constitute the bulk of sedimentary successions, this neutron/density overlay convention is highly serviceable in the recognition of many other minerals and lithologies, as we shall see in the next lesson.
The overlay method has been described in terms of theoretical expectations, but how well does it work in practice? As an example of the practical use of this overlay, gamma-ray, neutron and density logs are shown on the following pages for a Paleozoic sequence of mixed lithologies from a wildcat drilled in northern Kansas.
Cities Service #A-1 Beck: A Successful Wildcat
In 1978, the Cities Service Oil Company shot a seismic line in Nemaha County and located a structure on which they drilled a wildcat, #A-1 Beck through a Paleozoic sequence into the Precambrian.
Commercial oil was discovered in the Middle Ordovician Viola Limestone and the well was completed as the discovery of the Corning Field.
The reflections are marked for the base of the Hunton Limestone (Silurian), the Maquoketa Shale, Viola Limestone, Platteville Formation (Middle Ordovician), and the Precambrian granite.
We will next examine the gamma-ray, density and neutron porosity logs of the Hunton to Precambrian section and use the pattern recognition rules of the template to interpret lithology.
The Hunton and Maquoketa Section
The Hunton Group ranges from Silurian to Devonian in age and consists mainly of limestones and dolomites. The lowermost unit is the Chimneyhill Dolomite, which is shown in the section below.
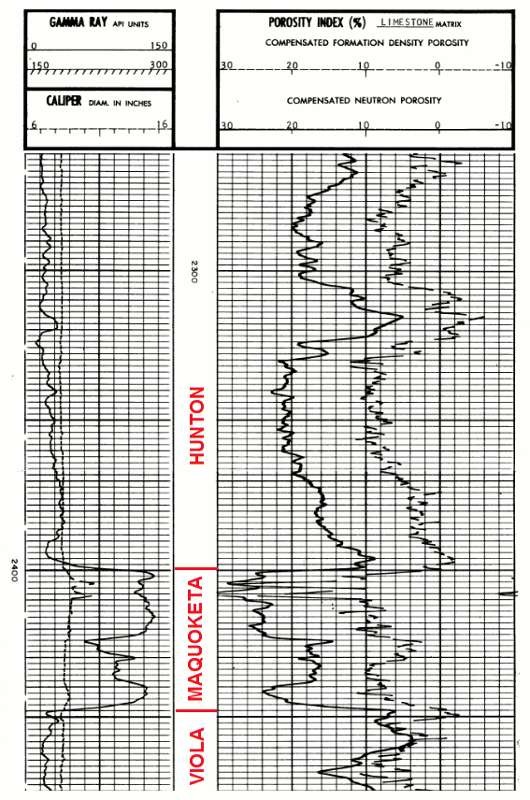
The Silurian Chimneyhill Dolomite disconformably overlies the Middle Ordovician Maquoketa Shale, which is made up of shale, dolomitic shale, and shaly dolomite.
From the "overlay template pattern recognition rules" shown earlier, what are the lithologies that are indicated on these logs?
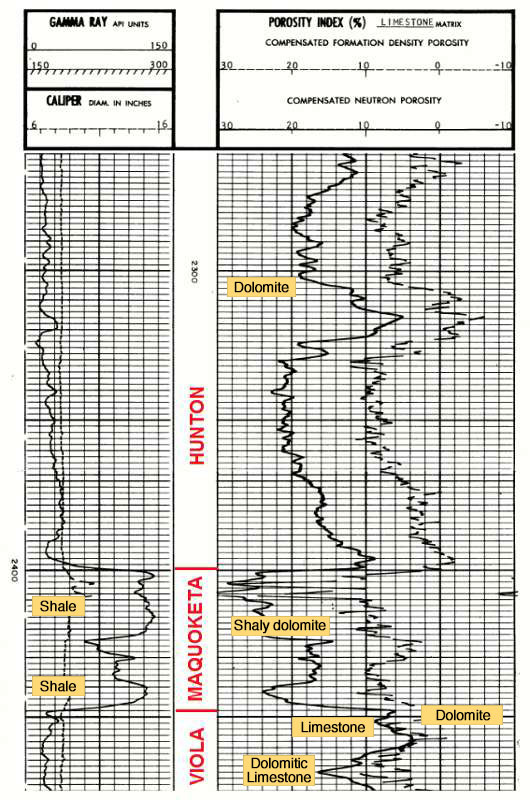
These lithology assignations match what the wellsite geologist saw in the drill-cuttings.
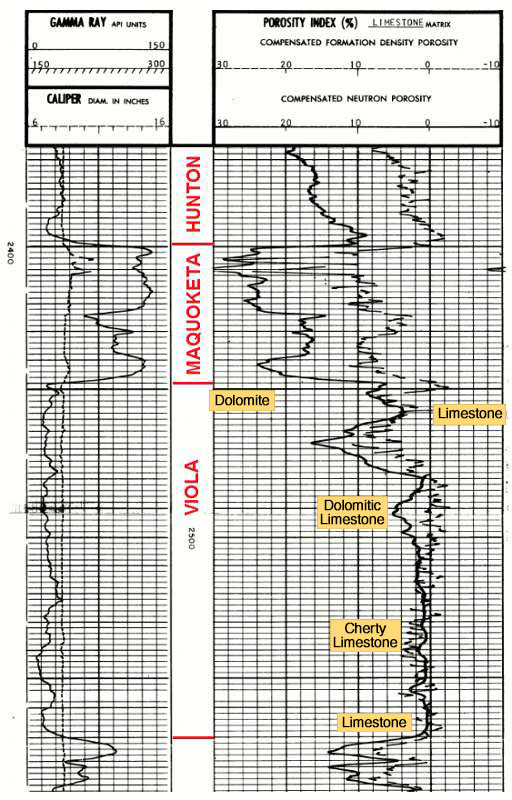
The Viola Limestone
The Viola Limestone is Middle Ordovician in age and named for outcrops near the ghost town of Viola in Oklahoma. In Kansas, the Viola consists primarily of dolomites, dolomitic limestones, and limestones with contents of chert.
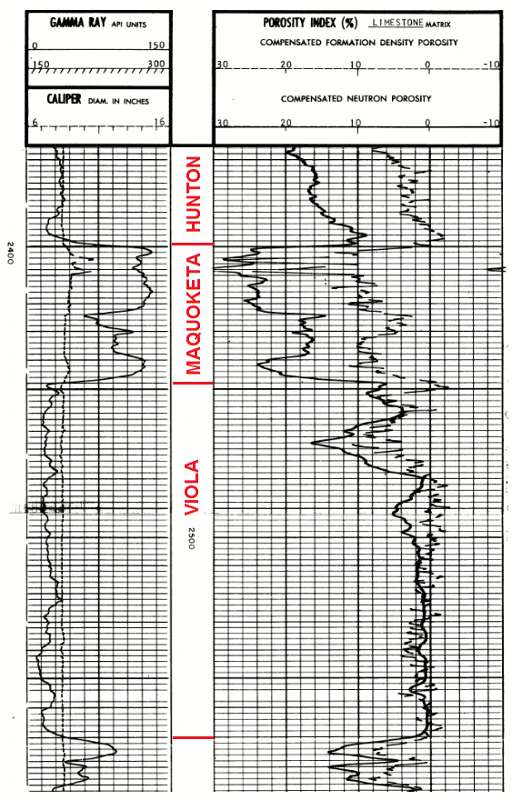
The high porosity zone near the top of the Viola in this well was tested and, with a recovery of commercial quantities of oil, the wildcat was completed as the discovery well of the Corning Field.
What are the lithologies that you see within the Viola?
The Platteville, St. Peter, and Precambrian
The Middle Ordovician Platteville Formation in Kansas is restricted to the north-east of the State and consists of dolomite, limestone, sandstone, and green shale. The basal part is a persistent dolomite that can be correlated across the region. The Platteville unconformably overlies the St. Peter Sandstone. The St. Peter is correlative to part of the Simpson Group of Oklahoma, where Simpson sandstones are prolific oil producers. Below the St. Peter, the "Granite Wash" consists of arkosic detritus that develops in localities where the Precambrian is granite.
The shaly unit that immediately underlies the Viola is equivalent to the Decorah Shale in outcrop. Notice how its gamma-ray response is much less then the shale that is marked 'SH' further down. The Decorah Shale is highly calcareous because it is crammed with fossil debris such as brachiopods and trilobites. Consequently, the unit on this log is marked as 'CS' to signify calcareous shale.
The unit below 'SH' is labelled with informal subdivisions of A, B, and C. Even though a casual glance at the gamma-ray log might suggest that they collectively represent a common lithology, the overlay of the neutron and density porosity logs shows otherwise.
The wildcat reached total depth in the Precambrian (PRE-C), when granite cuttings in the mudstream signaled that the entire Phanerozoic succession had been penetrated. Notice that below the St. Peter Sandstone (St.PETER), the gamma-ray curve exceeds the primary range of 0-150 API units and is now referenced to the secondary scale of 150-360 API units. The increased radioactivity is caused by granitic material, which in common with other acid igneous rocks has radioactive sources of uranium and thorium, but also high potassium associated with K-feldspars. The top zone has moderate neutron and density porosities that reflect pore volumes in an erosional "Granite Wash." However, below this zone is the granite, where the neutron curve flatlines to essentially zero because of the limited hydrogen sources in the granitic minerals. The "density porosity" of the granite has no immediate meaning, scaled as it is to a limestone-porosity system. However, a simple backcalculation of the bulk density measurement gives an estimated density of about 2.6 gm/cc. A more extensive discussion of log properties will be made in the section on Igneous and Metamorphic Rocks.
When only the neutron and density curves are available (no photoelectric factor curve), then some lithological interpretations may be ambiguous.
Limitations of the Neutron-Density Porosity Overlay
The neutron-density porosity overlay in conjunction with the gamma-ray log gives an excellent first look at lithologies. However, it has its limitations because the amount of information to be gained is restricted by the number of inputs - in this case, three logs. The gamma-ray log is the first key to shales versus non-shales. Dolomites and sandstones (or cherts) will be distinctive because of the separation on the density and neutron porosity curves. Limestones will be recognized when the neutron and density curves overlay. However, there can be some ambiguity when the curves show slight differences as in the example below, where we revisit part of the Viola in the Beck well.
From the drill-cuttings, the wellsite geologist considered this section to be dolomitic limestone. The log overlay is fully consistent with this call. However, there can be instances where a cherty or sandy dolomite can appear to be calcareous because the "dolomite effect" (neutron higher porosity than density) is compromised by the "quartz effect" (density higher porosity than neutron). The Viola commonly has chert, so that this section could equally be a cherty dolomite or a cherty dolomitic limestone.
Potential ambiguities of this type can be resolved by reference to the photoelectric factor (PeF) curve which has been recorded as fairly standard practice by almost all service companies since the mid-1980's. Cities Service #A-1 Beck was logged in 1978.
In the next lesson, we will review how the addition of the PeF curve can expand and refine lithology interpretation from logs.
Meanwhile, we will review the "gas effect" that can be shown on the neutron-density porosity overlay.
The Gas Effect
The overlay of the density-neutron porosity log overlay was introduced by logging companies as a means to evaluate volumetric porosity free from lithology effects.
However, the overlay immediately became popular for another reason - "the gas effect". This occurs because in calibrating a log responses to porosity, two endpoints are chosen: the matrix (calcite or quartz or dolomite) and a fluid point. The fluid is equated with mud filtrate which, for a fresh mud, is fresh water. If the pore space in the flushed zone contains significant amounts of gas, then:
- the density porosity appears to increase (because the rock is lighter)
and simultaneously
- the neutron porosity appears to decrease (because hydrogen is more diffuse in a gas than a liquid)
We have seen that in sandstones and cherts, the density porosity will read higher than the neutron. However, the gas effect typically results in:
- a much higher separation than quartz
and, diagnostically
- shows an "hourglass effect" (the increase in density porosity is mirrored by a decrease in neutron porosity)
We have already seen a gas effect in the Niobrara Chalk, when the logging operation was reviewed. Here is the gamma-ray and neutron-density porosity logs for #13-24 Helman P, now annotated with stratigraphy and the gas zone.
Notice the large separation of the neutron and density porosities in the Sharon Springs Shale which reflects the clay mineral content. A smaller separation occurs in the Smoky Hills Chalk below the gas zone, which picks up some clays within the chalk and demonstrates that it is not a pure limestone, but more like a marl.
The gas effect is reflected by the big separation in density and neutron porosity logs in a classic "hourglass" pattern.
There are times when no gas effect is shown by the density and neutron porosity log overlay when logging a commercial gas zone.
Now You See It, Now You Don't
It is common practice for exploration wells in western Kansas and Colorado that have a deep primary target, but consider Niobrara gas a viable secondary target, to stop in the Niobrara and log before drilling deeper (Pollastro and Scholle, 1984). The reason for this is that the gas effect on the logs is transient and disappears later as mud-filtrate invasion extends deeper beyond the borehole wall. Because both the density and neutron measurements are relatively shallow, flushing by invasion may mute or eliminate a gas effect.
An example is provided by the drilling of First Energy #21-23 Linin in Cheyenne County, Kansas.
Here is the gamma-ray, neutron-density logs recorded when the well had been drilled to a depth of 1400 feet into the Niobrara. The gas effect is small, but shows the highly distinctive "hourglass" pattern.
A week later, when the well had drilled to its primary target in the Mississippian, the hole was relogged. By this time, invasion has caused the gas effect to be eliminated, as shown below.
The well was completed as a Niobrara discovery in the Cherry Creek Gas Area.
Prev Page--Nuclear Porosity Logs || Next Page--The Photoelectric Factor (PeF) Curve
Kansas Geological Survey
Updated July 31, 2017.
Comments to webadmin@kgs.ku.edu
The URL for this page is http://www.kgs.ku.edu/Publications/Bulletins/LA/05_overlay.html