![]()
Prev Page--Mineral Composition Crossplot || Next Page--The Dipmeter
The RHOmaa-Umaa Crossplot Revisited
The last lesson of MINERAL COMPOSITION CROSSPLOT concluded with an example of a RHOmaa-Umaa crossplot of the Middle Ordovician Viola Limestone in a well from northern Kansas.
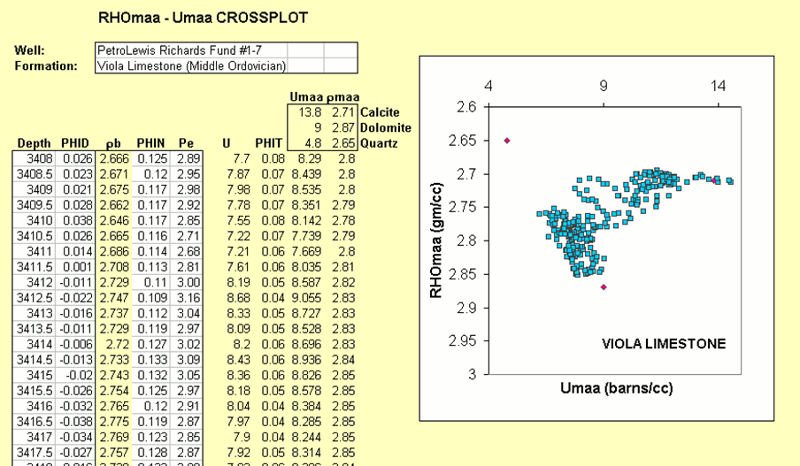
The crossplot shows two distinctive clouds of a cherty limestone and a cherty dolomite.
However, the stratigraphic location of these two lithofacies must be found by reference to the logs, because there is no depth information on the crossplot.
By computing a composition profile, we can relate the estimated proportions of minerals in terms of depth.
Computation of a Composition Profile from RHOmaa and Umaa
At any depth in the Viola Limestone, the RHOmaa and Umaa values can be located as a point within the quartz-calcite-dolomite composition triangle on the RHOmaa-Umaa crossplot.
The coordinates of this point can then be transformed into estimated proportions of quartz, calcite and dolomite.
The proportions of these three minerals sum to unity making it a "closed system".
Consequently, only two log variables (RHOmaa and Umaa) are needed to solve for three mineral unknowns.
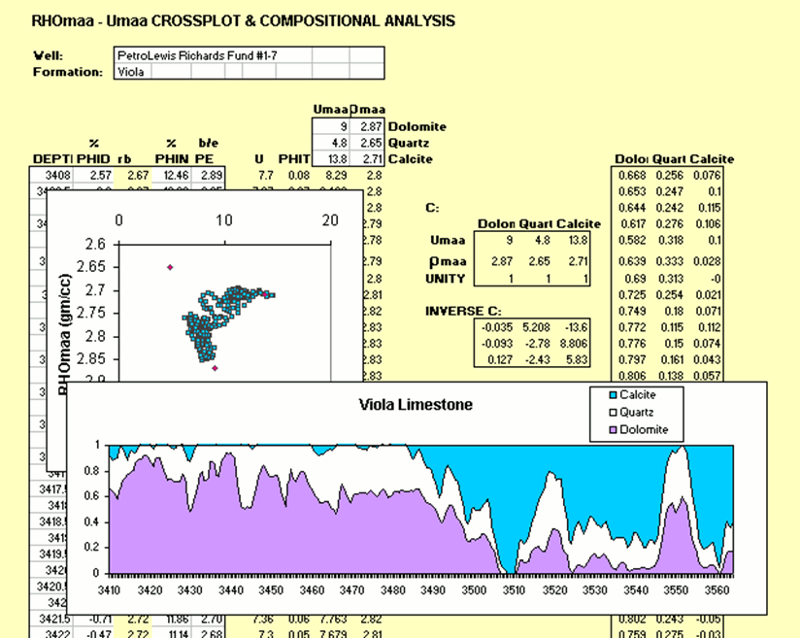
If the mineral proportions are estimated for all zones in the Viola Limestone, then the result can be displayed as a composition profile.
In the EXCEL sheet above, the composition calculations are made by:
- Setting up a matrix of RHOmaa and Umaa values for the three minerals as a coefficient matrix "C", with a final row of unit values.
- Computing the inverse matrix "INVERSE C" using the EXCEL function of MINVERSE
- Multiplying the RHOmaa and Umaa values by the INVERSE-C matrix to generate a column of Dolomite, Quartz, and Calcite proportions.
- Displaying the composition profile as a graphic, using EXCEL's CHART WIZARD tool.
The method used in the creation of this composition profile is the fundamental basis for mineral estimation profiles from logs produced routinely by high-end log analysis software packages in industry.
The computation can be expanded to include estimation of porosity.
Composition Profile of Minerals and Porosity
In computing RHOmaa and Umaa, the porosity is suppressed in order to enable a composition crossplot.
Porosity can be re-introduced into the system, by using the three log variables of density, neutron porosity, and photoelectric factor as input.
The coefficient matrix, "C" is now expanded to include the new output variable of porosity.
The log properties of porosity are those of the fluid in the pore space.
Because the nuclear tools have such shallow investigations beyond the borehole wall, the pore fluid is mostly, if not entirely, mud filtrate.
If the drilling mud is fresh, then the mud filtrate is fresh water.
The estimation of the composition profile that now includes porosity is simply an expansion of the matrix algebra solution of the three-mineral system.
Next, we will compare this EXCEL-driven result with the "Cyberlook" processing of the Viola Limestone in this well by the Schlumberger logging engineer.
The "Cyberlook" Analysis of Logs in the Viola Limestone Section
The Cyberlook analysis of the Viola Limestone was made by the Schlumberger logging engineer, using the computer in the logging truck.
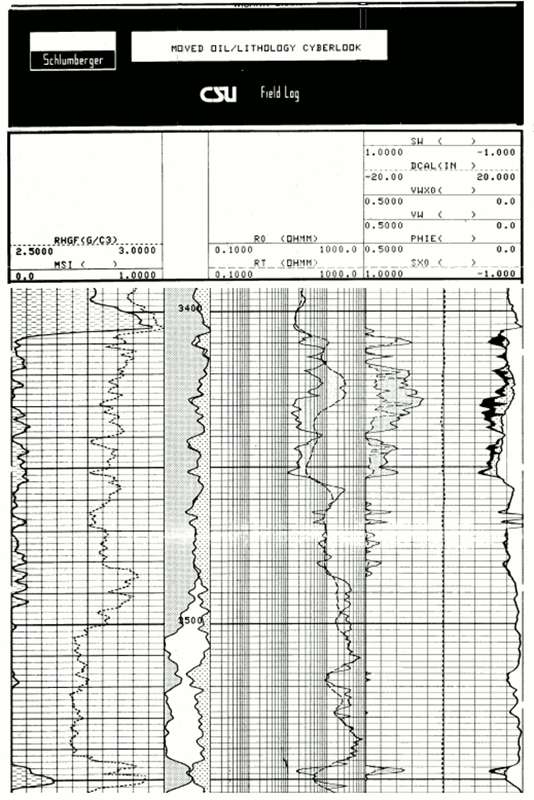
Track 1
- The shale proportion (dashed) computed from the gamma-ray log
- RHGF (G/C3) is the estimated grain density in grams/cc, which corresponds to RHOmaa
The depth track:
- The composition profile of dolomite (gray), calcite (white), and quartz (dotted).
Track 2:
- The measured resistivity (Rt) overlaid by the computed resistivity for a fully water-saturated rock (Ro).
Track 3:
- Water saturation estimations and the volume of porosity (PHIE)
The Viola Limestone in this well was perforated between 3419 and 3427 feet depth with an initial production of 114 barrels of oil per day and no water.
How does the composition profile computed from logs match with what we might see visually from an outcrop or core?
An Equivalent Viola Limestone Outcrop
The Viola Limestone in Kansas is restricted entirely to the subsurface, so that an outcrop must be located outside the state. The unit was first described near the ghost town of Viola, Oklahoma, but limestone outcrops in this vicinity are not mineralogically similar to the Viola in northern Kansas.
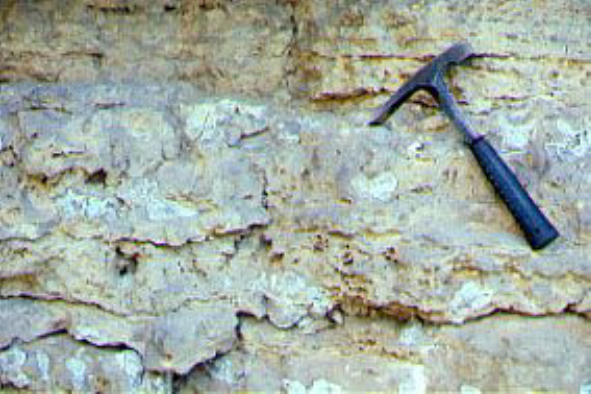
The equivalent formation in Iowa is the Galena Limestone which is broadly similar to Kansas Viola and outcrops as cliffs along the Mississippi River.
The picture shows an example of Galena Limestone outcrop in Dubuque, Iowa.
Notice the bed of nodular chert contained within the dolomite host.
The vertical resolution of the photoelectric factor, density, and neutron porosity logs is slightly broader than the length of the geological pick.
Consequently, a composition profile calculated from these logs should be thought of as a moving average of estimated mineral composition when relating it to core or outcrop.
Improvements in mineral compositional estimations from logs have been made with the introduction of the geochemical log which measures elements by neutron activation spectroscopy.
Geochemical Logging
Natural gamma-ray spectral measurements were reviewed in the lesson on THE GAMMA RAY LOG which described how gamma-rays from radioactive isotopes sources in the formation can be binned by their energy level, counted, and subdivided between potassium, uranium, and thorium sources. As such, it is a passive measurement that records natural gamma radioactivity.
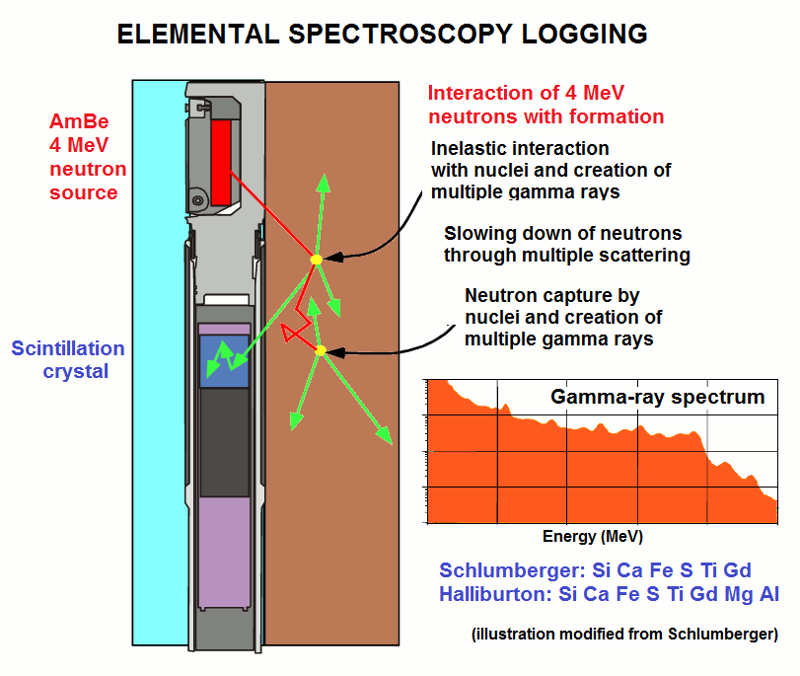
In contrast, neutron-induced capture spectroscopy tool is an active measurement in which the formation is bombarded with high-energy neutrons to create capture gamma-rays. The graphic illustrates the physics of the logging process:
- An Americium-Beryllium (AmBe) radioactive source generates high-energy neutrons (4 MeV) that radiate into the formation.
- At high energies the neutrons collide with the nuclei of atoms and generate inelastic gamma-rays with a variety of energies
- As a result of multiple collisions with nuclei (particularly of hydrogen), the neutrons progressively lose energy
- When the neutrons reach the thermal energy stage, they are vulnerable to be captured by nuclei
- When a nucleus captures a low-energy neutron, it emits a capture gamma-ray, whose energy is characteristic of the element
- The capture gamma-rays are counted by a scintillation crystal in the creation of a gamma-ray spectrum of energy
- The spectrum is then subdivided into the contributions made by different elements by "spectral stripping"
- A mineral model is then used to allocate the elemental analysis to a suite of minerals.
Although geochemical logging was introduced in the 1980's, recent developments and improvements have been spurred by resource plays of organic mudstones, where compositional analysis is important both for reservoir quality and production quality analyses.
Next, an example is shown of a compositional analysis of a Kinderhook/Woodford Shale section that used neutron-induced gamma-ray logging measurements.
Mineral Composition Profile of a Kinderhook/Woodford Shale Section from Geochemical Logging
The graphic shows a compositional profile of a Woodford Shale section overlain by Kinderhook Shale from a southern Kansas well.
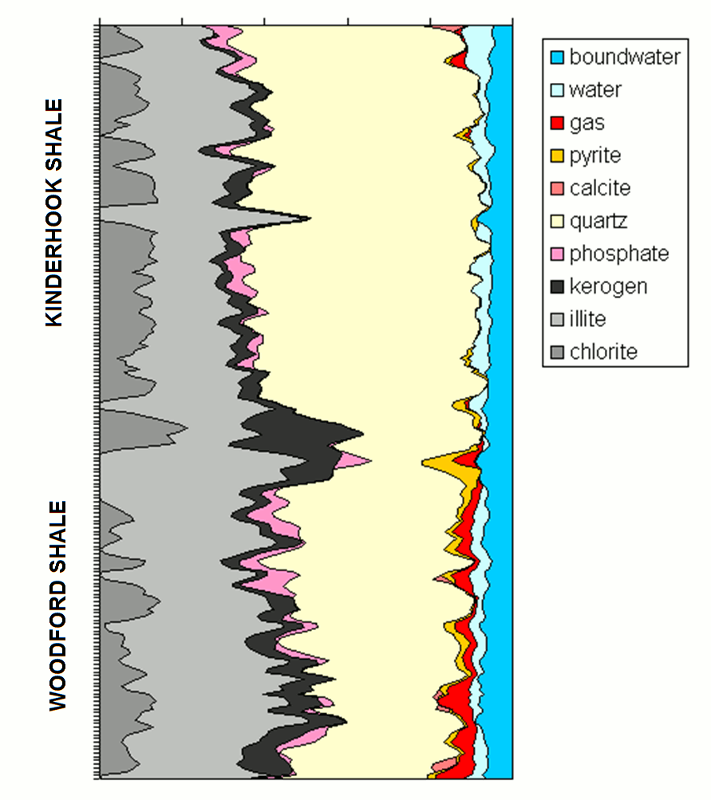
The analysis was created by combining measurements from neutron-induced spectral gamma-ray measurements with resistivity, photoelectric factor, density, and neutron logs.
A Cheaper Alternative to Compositional Analysis of Organic Mudstones
Neutron-induced gamma-ray spectroscopy logs give direct estimates of elemental concentration. An interpretation model is then used to distribute the elements between a set of minerals.This is an expensive logging program.
However, a reasonable approximation can be made from logs which are run routinely by using the volumetric mineral model approach described earlier in this lesson (where it was applied to the Viola Limestone).
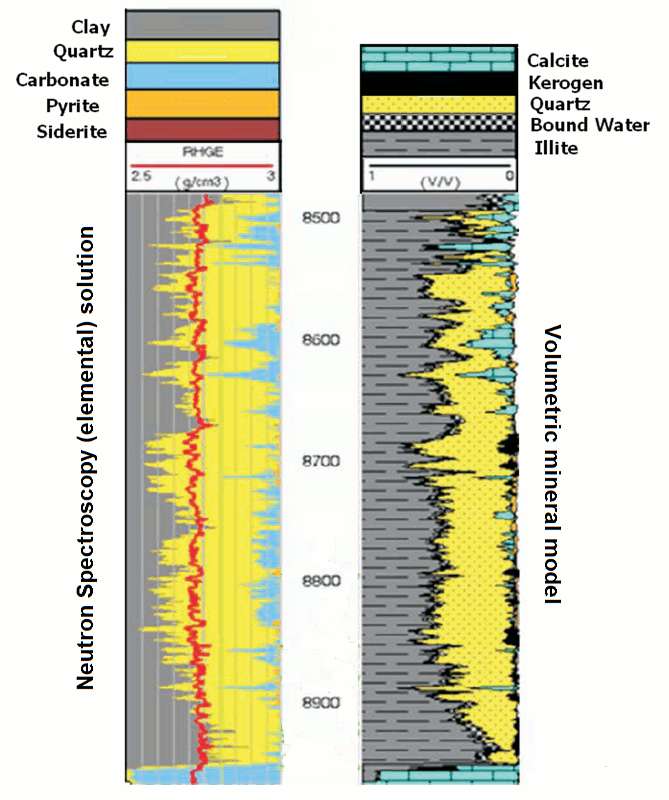
Spears and Jackson (2009) demonstrated this in an application to the Barnett Shale. The compositional model developed from elements measured by neutron-induced gamma-ray spectroscopy is shown on the left. The volumetric mineral model on the right was developed by using:
- log inputs of gamma-ray, photoelectric factor, bulk density and neutron porosity, and
- mineral outputs of quartz, calcite,illite, kerogen, and pore fluid
Prev Page--Mineral Composition Crossplot || Next Page--The Dipmeter
Kansas Geological Survey
Placed on web March 24, 2017.
Comments to webadmin@kgs.ku.edu
The URL for this page is http://www.kgs.ku.edu/Publications/Bulletins/LA/12_profiles.html