![]()
Prev Page--Igneous and Metamorphic Rocks || Next Page--Mineral Composition Crossplot
Organic Mudstones
In traditional exploration for oil and gas, shales used to be ignored, other than their role as:
- seals to trap petroleum
- or as potential source rocks.
However, with the technical advances brought about by directional drilling and hydraulic fracturing, organic mudstones are now a major exploration target.
The Barnett Shale was the first major play of what was originally termed "gas shales" as a source of "unconventional" gas.
More recently, production has expanded to include both oil and gas, while shale is recognized as a restrictive term, and unconventional seems dated as a useful descriptor.
The terminology is still in flux, but useful descriptors are:
- resource plays (as contrasted with porous reservoirs in structural or stratigraphic traps)
- organic mudstones (because compositions may contain significant quartz and/or calcite)
Organic mudstones that are potential resource targets should contain sufficient total organic carbon (TOC).
- less than 2% TOC is conventionally considered to make the mudstone too "lean"
- greater than 2% TOC classifies the mudstone as organic-rich.
An organic-rich mudstone is unconventional when compared with traditional reservoirs, because it is simultaneously:
- the source rock
- the reservoir and
- the seal.
The reservoir properties are also unconventional because:
- the porosity is very low and
- the permeability is extremely low (so that natural fractures and hydraulic fracturing are key considerations).
The organic matter that is the source of the hydrocarbons is kerogen whose properties are outlined next.
Kerogen
Kerogen is insoluble organic matter that has a:
- low bulk density (about 1.3 gm/cc)
- very high gamma-ray (500 to 4000 API units) linked with uranium
- low photoelectric factor (about 0.24 barns/electron)
- high neutron porosity (about 60 p.u.)
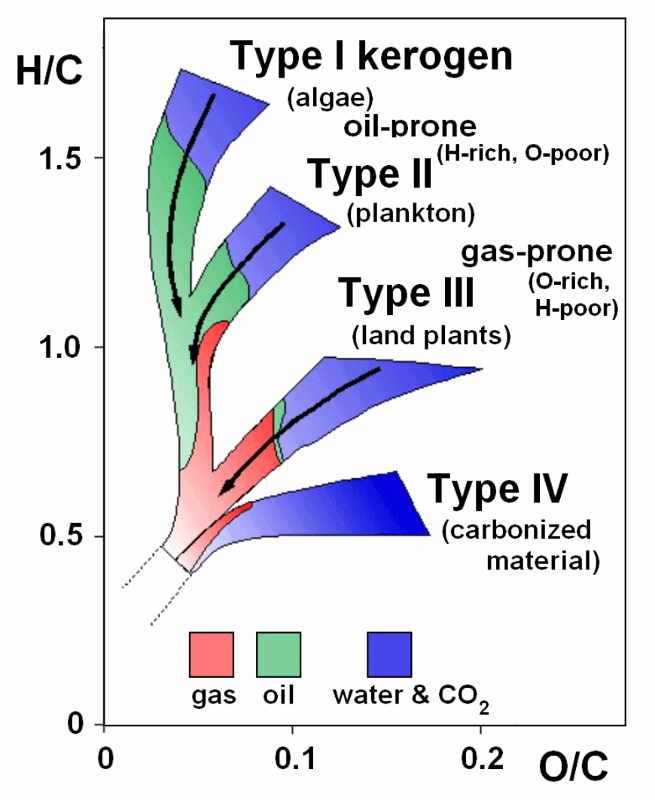
Kerogen is derived from a variety of organic matter sources.
When an organic mud is lithified and subjected to increasing temperature and pressure, the kerogen is progressively "cooked" to generate
- first water and carbon dioxide
- then oil
- then gas
- and finally carbonized material
as shown by the classic Van Krevelen diagram of maturation.
Exploration for commercial production therefore requires an organic-rich shale that has reached sufficient maturation for oil or gas production.
The Woodford Shale of Oklahoma has been a prolific gas producer.
Next, we will look at some logs from a Woodford Shale section in Barber County, southern Kansas.
Resistivity Log
The gamma-ray log shows a conventional gray-shale response of about 130 API units in the Kinderhook Shale, but a huge increase in the Woodford Shale, with two zones exceeding 330 API units.
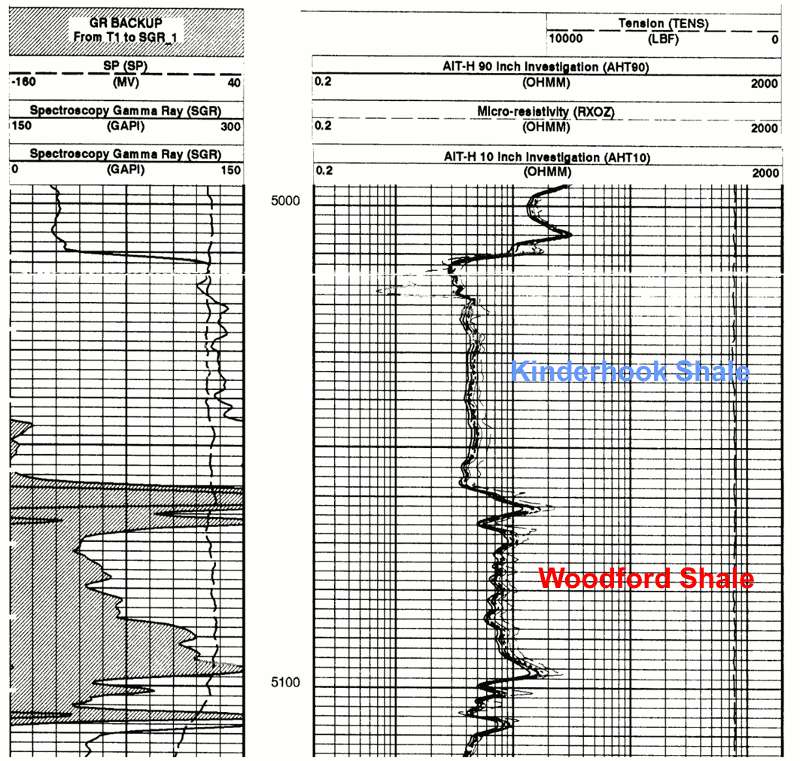
The higher radioactivity is caused by uranium associated with the kerogen content in the Woodford Shale.
On the resistivity log, there is a distinctive shift from about 5 ohm-m in the Kinderhook Shale to about 8 ohm-m in the Woodford Shale.
The increase in resistivity is caused by the kerogen content. (Notice how increasing resistivity in the Woodford tends to track with increasing gamma-ray values).
Let's look at the photoelectric factor, density, and neutron porosity logs for this section.
Neutron-Density Log
Both the SGR and CGR curves are shown for the gamma-ray log in Track 1.
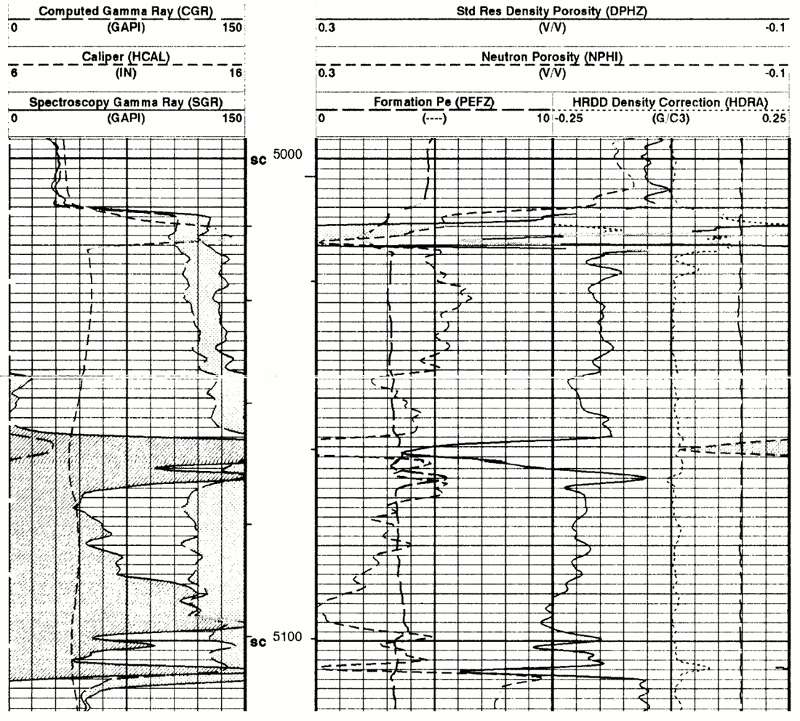
Notice how the Kinderhook Shale and the Woodford Shale show very similar CGR values. Because the CGR is the sum of the contributions from potassium and thorium sources, this demonstrates that their clay mineralogy is fairly similar.
From the porosity curves in the combined tracks 2 and 3 we can see that:
- the neutron porosity is higher in the Woodford Shale than the Kinderhook Shale
- and the density porosity is also higher (meaning lower bulk density) in the Woodford Shale than the Kinderhook Shale
These differences are caused by the kerogen in the Woodford Shale
Finally, let's look at the spectral gamma-ray log (potassium, uranium, thorium curves) for this section.
Potassium, Uranium, Thorium (KUT) Curves
The Woodford Shale shows slightly higher potassium and slightly lower thorium levels than the Kinderhook Shale, which suggests that it may have a higher illite content.
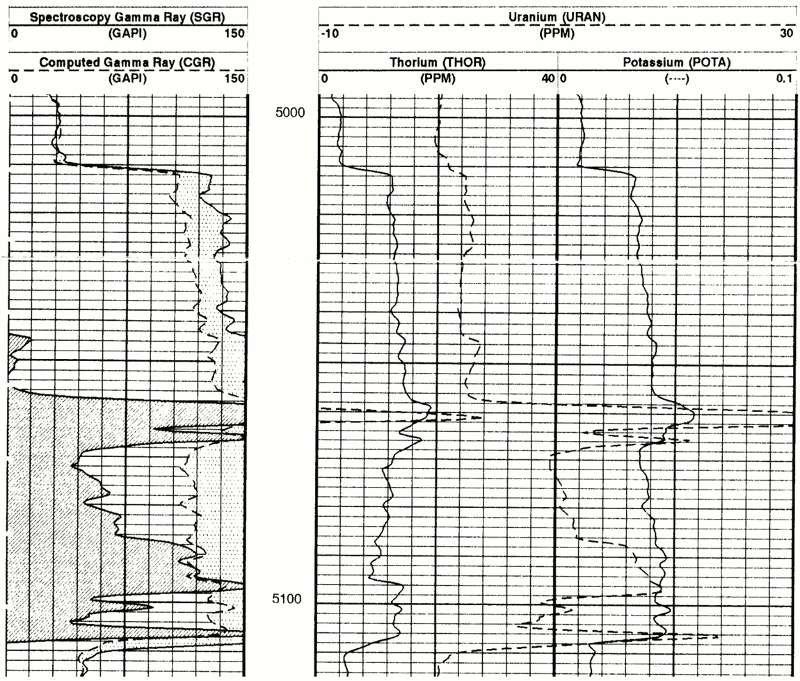
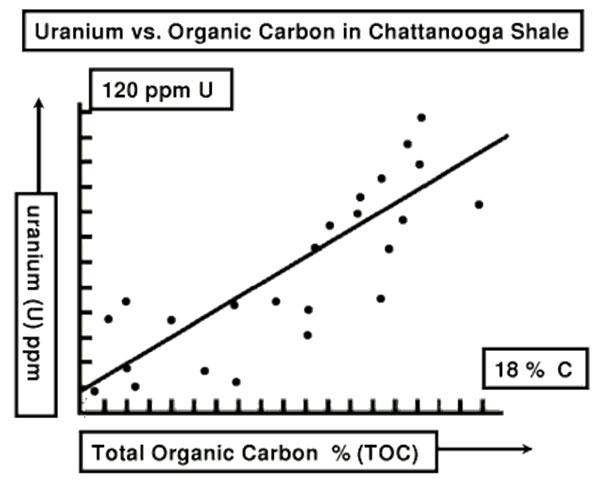
The uranium curve is scaled in ppm and reaches a maximum of about 43 ppm at the top of the Woodford Shale.
Since uranium is linked with kerogen let us see if we can make a prediction of TOC, using the chart on the next page.
Uranium and TOC
Hester et al. (1990) crossplotted measurements of uranium and TOC from core samples of the Chattanooga Shale (correlative with the Woodford Shale) and established a trend for prediction purposes.
Organic Mudstone Play Compositions
The composition triangle from Diaz et al. (2013) shows the wide range of compositions associated with organic mudstone plays.
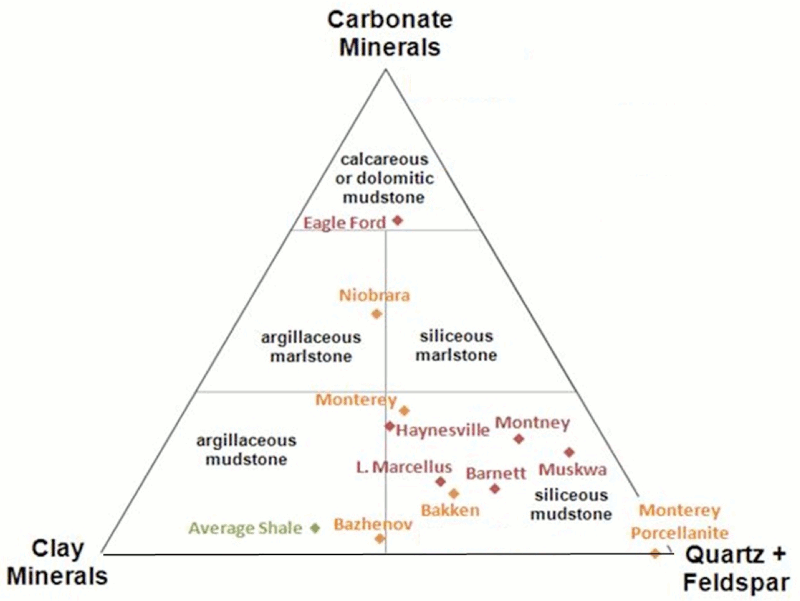
Notice how the "average shale" is mostly clay minerals with some quartz content, but minimal carbonate. Consequently, "mudstone" or "mudrock" is a better descriptor, particularly as many are not necessarily fissile.
The application of a carbonate-clay-quartz triangle is increasingly common as a fundamental descriptor in the classification of mudstone compositions calculated from logs, as shown next.
Organic Mudstone Log Compositions
This composition triangle from Diaz et al. (2013) shows examples of mineralogy profiles computed from logs that are matched with plays associated with the vertices of the mudstone composition triangle.
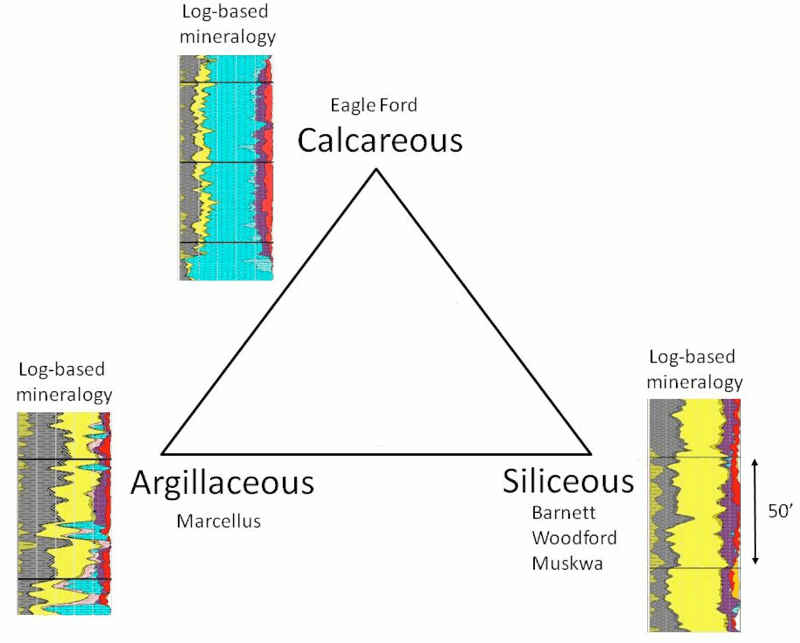
The log-based mineralogy profiles show continuous fluctuations of proportions with depth, but these can be allocated between mudstone lithofacies types as shown next.
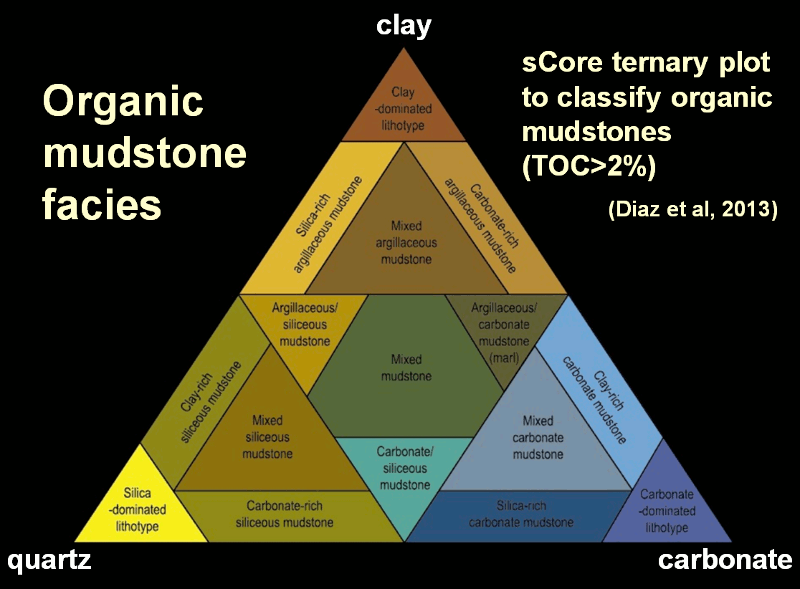
Organic Mudstone Lithology Triangle
Then, by using the sCore classification, a lithology column can be produced.
Organic Mudstone Lithology Column
sCore facies log of a Barnett Shale section within a vertical hole (from Diaz et al, 2013).
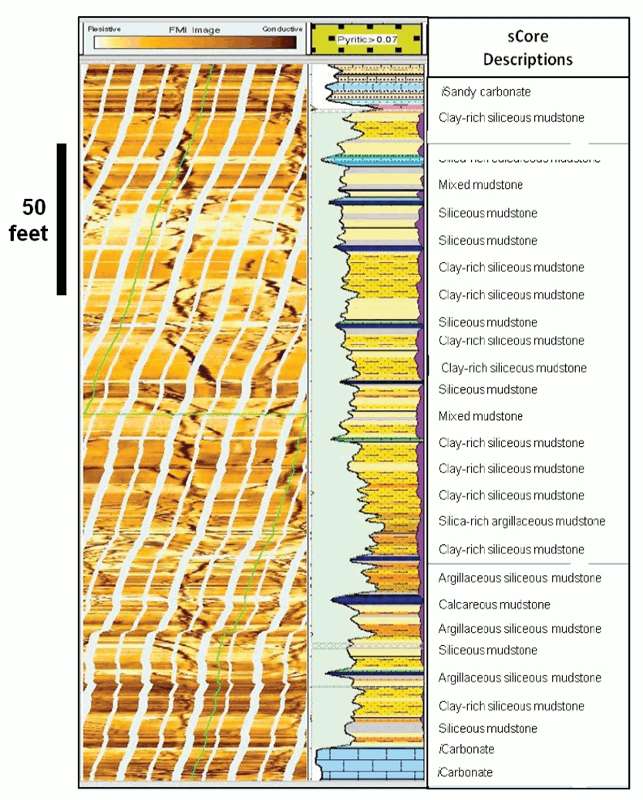
On the left in Track 1 is the image log of the section that will show not only bedding structure but the location and orientation of any natural fractures.
The facies classification is based on dry-weight mineral output from a geochemical log.
The left curve (pale green infill) in track 2 is the brittleness index computed from the mineral composition.
The right curve (purple infill) in track 2 is the TOC flag for contents > 2%.
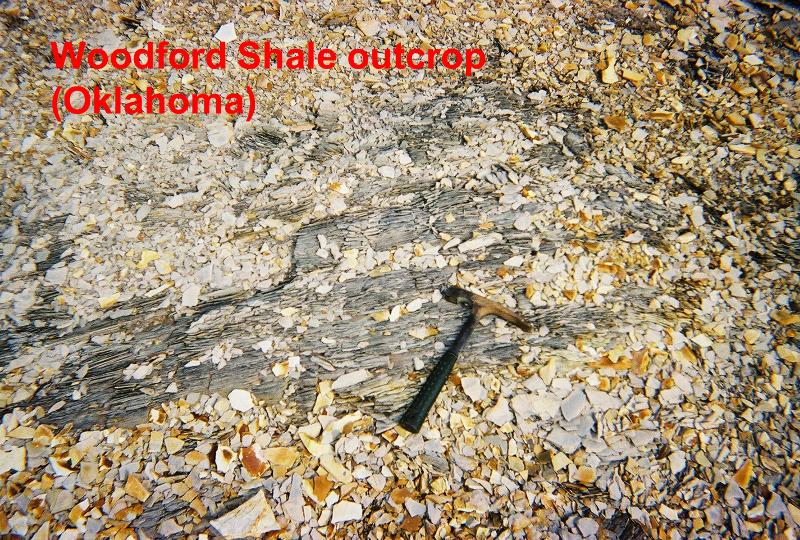
Woodford Shale Outcrop
Fieldtrips to organic mudstone outcrops are very popular with both geologists and engineers.
Color photo of an organic mudstone outcrop, the Woodford Shale in Oklahoma.
The geologist's focus is on Reservoir Quality (RQ)
- Organic Richness (TOC)
- Effective Porosity
- Matrix permeability (K) to gas
- Hydrocarbon Saturation
- Mineralogy
The engineer's focus is on Completion Quality (CQ)
- Fracture containment (Geomechanical Properties)
- Fracture complexity
- Retention of fracture area and fracture conductivity (minimum closure stress)
- Minimum Closure Stress
Prev Page--Igneous and Metamorphic Rocks || Next Page--Mineral Composition Crossplot
Kansas Geological Survey
Placed on web March 24, 2017.
Comments to webadmin@kgs.ku.edu
The URL for this page is http://www.kgs.ku.edu/Publications/Bulletins/LA/10_mudstones.html