![]()
Prev Page--Organic Mudstones || Next Page--Mineral Composition Profiles
Crossplot Identification of Minerals
With sufficient practice, lithologies can be recognized from an examination of the photoelectric factor, density, and neutron porosity logs.
By taking the values recorded by logs and plotting them on a chart scaled to mineralogy, we can not only identify the minerals in a zone, but make estimates of their numerical volumes.
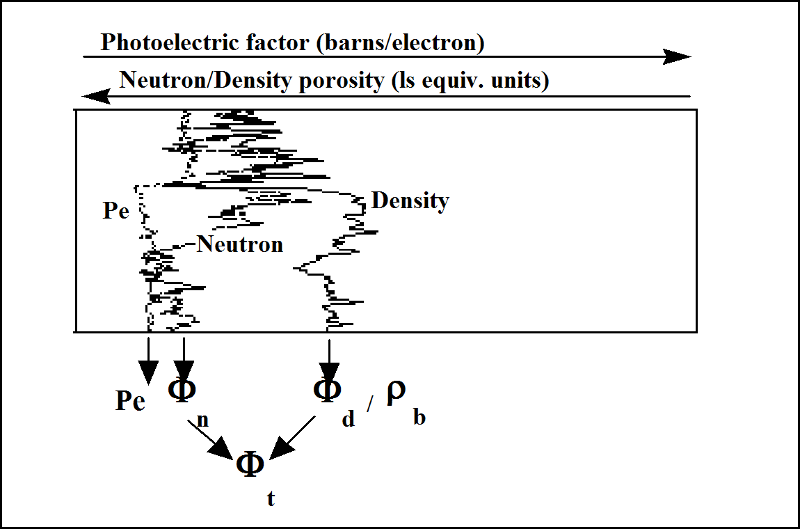
The first problem to be surmounted is that we have three log values that we wish to plot on a two-dimensional chart, regardless of whether the chart is a paper copy or shown on a computer screen.
This situation can be resolved by condensing the three log values of photoelectric factor, density, and neutron porosity logs into two variables that are linked with mineralogy.
The two variables are RHOmaa and Umaa, and their derivation is discussed next.
RHOmaa and Umaa calculations
The three measurements from photoelectric factor, density, and neutron porosity logs can be condensed into two variables that are keyed to mineralogy by eliminating porosity.
RHOmaa is the estimate of the density (RHO) of the mineral matrix (ma), where the final 'a' stands for "apparent," because it is estimated from the logs, rather than measured from core, when it would be termed the grain density. RHOmaa has units of gm/cc.
Umaa is the bulk photoelectric absorption (U) of the mineral matrix (ma) estimated from the logs (a, apparent). Umaa has units of barns/cc.
Notice that the photoelectric factor log is recorded in units of barns per electron (b/e) which is not linearly related to mineral volume.
Consequently it is converted to U, by:
U = PeF*RHOb
U now has units of barns/cc.
In order to eliminate the effect of porosity, we must first estimate its volume, either by using a neutron-density crossplot or by averaging the density and neutron porosity logs:
phi= (PHID+PHIN)/2
Now, because the relationship between density and porosity is given by the mass-balance relationship:
RHOb = phi*RHOf + (1-phi)*RHOma
then, rearranging to solve for an estimate of the matrix density:
RHOmaa = (RHOb-phi*RHOf)/(1-phi)
Similarly for U, the relationship of:
U = phi*Uf + (1-phi)*Uma
can be arranged to solve for:
Umaa = (U-phi*Uf)/(1-phi)
RHOf is the density of the water in the pore space. Because the density measurement is shallow, most of this fluid will be mud filtrate. If the drilling mud is fresh, the mud filtrate will be fresh water, so RHOf has a value of 1 gm/cc. Uf has a value of about 0.5 barns/cc.
When RHOmaa and Umaa are calculated for any zone, then the values can be located on a crossplot to determine its mineralogy, as shown next.
The RHOmaa-Umaa Crossplot
This RHOmaa-Umaa chart shows the basic plan of the crossplot found in logging service company chartbooks.
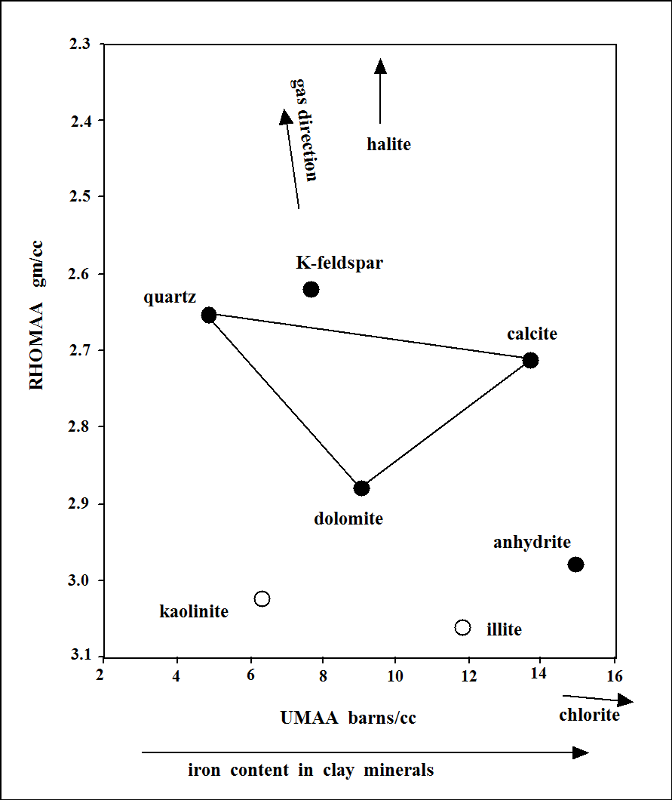
The quartz-calcite-dolomite composition triangle is usually drawn, together with percentage contours, because these are the principal components of traditional oil and gas reservoirs.
The vertices of the triangle match the reservoir lithologies os sandstone (or chert), limestone, and dolomite, while the interior expresses mixed lithologies such as calcareous sandstones, sandy dolomites, or cherty dolomitic limestones.
The RHOmaa values for shales are relatively high and place them towards the bottom of the chart, while their Umaa values are sensitive to iron content in their clay minerals. Many shales plot in the neighborhood of the dolomite point, so that attention should be paid to the gamma-ray curve, so that shales are not misidentified as dolomite.
If the flushed zone close to the borehole wall has significant gas content, then RHOmaa values will be false and zones will plot above the quartz-calcite-dolomite triangle.
Other minerals can be plotted on the RHOmaa-Umaa chart, such as anhydrite
Next, we examine the application of the RHOmaa-Umaa plot to a Viola Limestone section in northern Kansas.
Viola Limestone Example
Petrolewis #1-7 Richards Fund was drilled in the McClain Field of Nemaha County, Kansas, with oil production from the upper porous zone in the Middle Ordovician Viola Limestone.
In looking at the photoelectric factor, density, and neutron porosity log overlay, we can see two basic subdivisions:
- an upper porous dolomite
- a lower "tight" limestone
Closer inspection of these curves suggests that may be some silica content which, in the Viola, would be chert, rather than sand content.
We will gain a deeper insight into the Viola mineralogy by computing RHOmaa and Umaa values for this section and crossplotting them, as shown next.
Viola Limestone RHOmaa-UMAA Crossplot
The equations for calculating RHOmaa and Umaa were described earlier in this lesson and are easy to code in a standard EXCEL worksheet.
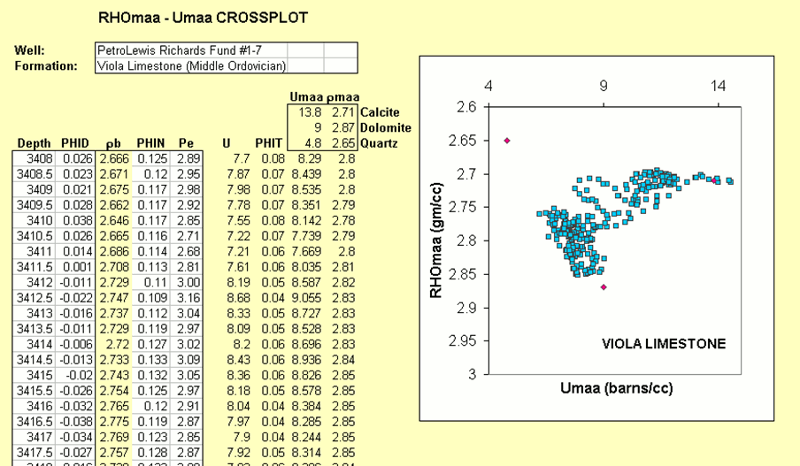
- The input data of density porosity (PHID), neutron porosity (PHIN), both in equivalent limestone fractional units, and photoelectric factor (Pe) are shown in the white columns together with depth.
- The bulk density (RHOB) is calculated from the density porosity (PHID)
- The volumetric photoelectric factor, U, is the product of the photoelectric factor (Pe) and the bulk density (RHOB)
- The volumetric porosity (PHIT) is estimated by the average of the density porosity (PHID) and the neutron porosity (PHIN)
The RHOmaa-Umaa crossplot of the Viola Limestone section zones (blue squares) shows a distinctive subdivision of clouds that is easy to interpret, especially when referred to the quartz, calcite, and dolomite endpoints (red diamonds).
The lower Viola subdivision is shown to be a cherty limestone, overlain by an upper subdivision of cherty dolomite, and with an intermediate transition of cherty dolomitic limestone.
Prev Page--Organic Mudstones || Next Page--Mineral Composition Profiles
Kansas Geological Survey
Placed on web March 24, 2017.
Comments to webadmin@kgs.ku.edu
The URL for this page is http://www.kgs.ku.edu/Publications/Bulletins/LA/11_crossplot.html