![]()
Prev Page--Evaporites || Next Page--Igneous and Metamorphic Rocks
Incised Valley Estuarine Sandstones
Pennsylvanian and Mississippian incised-valley fill systems occur in southeast and southwest Kansas and contain important oil and gas reservoirs. Their distinctive elongate shapes make them suitable targets for 3-D seismic exploration in locating sandstone bodies. The sandstone lithofacies show a distinctive lateral sequence from an upstream alluvial channel to inner estuarine, central bay, estuary mouth, and finally open marine deposits.
Buatois et al. (1999) made an integrated ichnologic, sedimentologic, and stratigraphic study of cores from the Lower Pennsylvanian Morrow Sandstone in southwest Kansas. They classified facies from numerous depositional environments within two distinctive systems estuarine- and open-marine deposits. Their interpretation model of the estuarine facies-assemblage is shown below, both as an idealized vertical sequence and as a depositional model of fluvial channels, interfluve paleosols, upper-estuarine channels, estuary bay, restricted tidal flats, tidal channels, and estuary mouth.
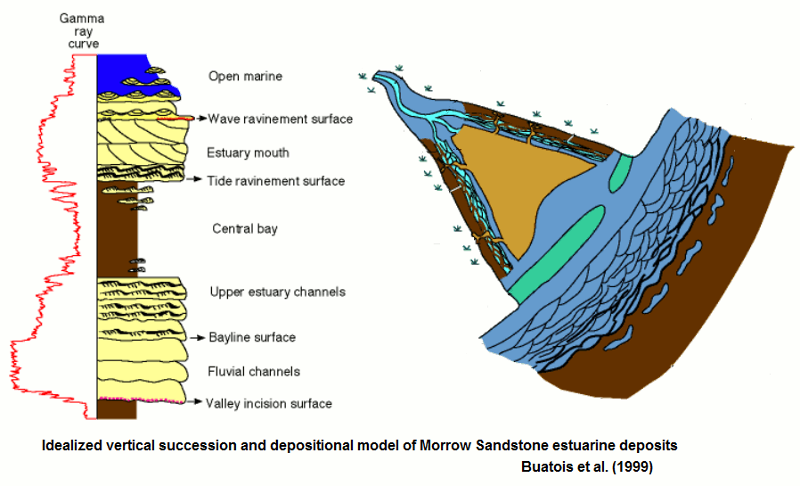
They concluded that the lower Morrow estuarine complex showed the typical subdivision of a marine sand face, a fine-grained central bay, and sandy landward zone associated with wave-dominated estuaries. The valley incision was considered to have been caused by a major sea-level lowstand at the Mississippian-Pennsylvanian boundary.
Next, we will examine the core description and interpretation of an Atokan incised valley estuarine deposit and then compare the core with the log responses.
Description and Interpretation of an Estuarine Facies Core
The reservoir unit of the Norcan East Field in Clark County, Kansas is a Pennsylvanian, Atoka/Morrow incised valley fill sandstone.
The Atokan estuarine section was cored in Murfin #1-3 Patton 3-30S-25W. The core description and interpretation by Lynn Watney are shown below.
Now let's see how the core description compares with the lithologies suggested by the gamma-ray, photoelectric factor, density and neutron porosity curves.
Comparison of Core and Logs in the Atokan Estuarine Unit
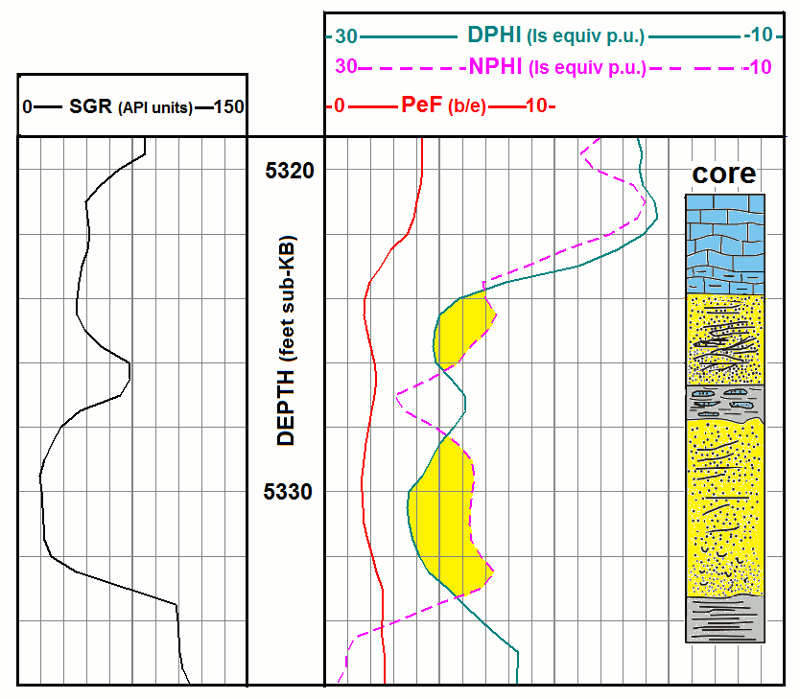
The marine limestone
The limestone core was described as a wackestone, which is certainly consistent with the log curve characters of slightly elevated gamma-ray response, coupled with a photoelectric factor value that approaches 5 b/e, and a neutron porosity that is only slightly higher than the density porosity.
The upper sandstone
The core contains very-fine grained shaly sandstone with ripple laminations. From the logging curves, it is clearly shown to be a sandstone by the photoelectric factor, and the density porosity that exceeds the neutron porosity. Its very fine-grained and shaly aspect is indicated by the higher gamma-ray, especially when compared with the lower sandstone.
The "interior" shale
The shale core is a heterolithic mix of carbonates and clastic material that is cross-laminated and flaser-bedded. The log curves show a shale character and suggest other "non-shale" components in this unit, when compared with the log responses of the "lower shale". visual examination of the curves.
The lower sandstone
The core is fine-grained and bioturbated. The log curves show this to be a sandstone whose grain-size is indicated to be larger than the upper sandstone by its lower gamma-ray response.
The lower shale
The core is carbonaceous and dark-gray to black in color. The log responses match a typical expectation for a shale.
An important aspect to be considered is the relative scale of perception, when relating the logs to the core.
The effective vertical resolution of these logs is between two and three feet, which is visually apparent on the curves as a smoothed average of the bed properties. Clearly, core provides resolution at all scales, but coring is much more expensive than logging and core recovery is commonly not complete.When core has not been taken, direct lithological observation will be tied to drill-cuttings. The most common practice is to bag cuttings at the rate of one for each ten feet of drilling. In this example, most of the cored interval is equivalent to one bag of drill-cuttings! In summary, both drill-cuttings and core provide ground-truth in validation of log interpretation. A cored well is valuable as a "Rosetta stone" for enriched lithology and facies interpretation from logs.
Now let us look at at a deltaic sandstone sequence that occurs in the Pennsylvanian Kanwaka Shale.
The Deltaic Elgin Sandstone in the Pennsylvanian Kanwaka Shale
The Elgin Sandstone occurs locally within the Kanwaka Shale between the Oread and Lecompton limestones in the Pennsylvanian of southern Kansas. Brown (1967) concluded that the distribution and facies patterns indicated that the Elgin was deposited in a shallow marine or marginal marine setting, associated with a large deltaic distributary complex, with a clastic source in the Arbuckle-Ouachita mountains. She suggested that Elgin Sandstone bodies represented deposits of bar-finger sands.
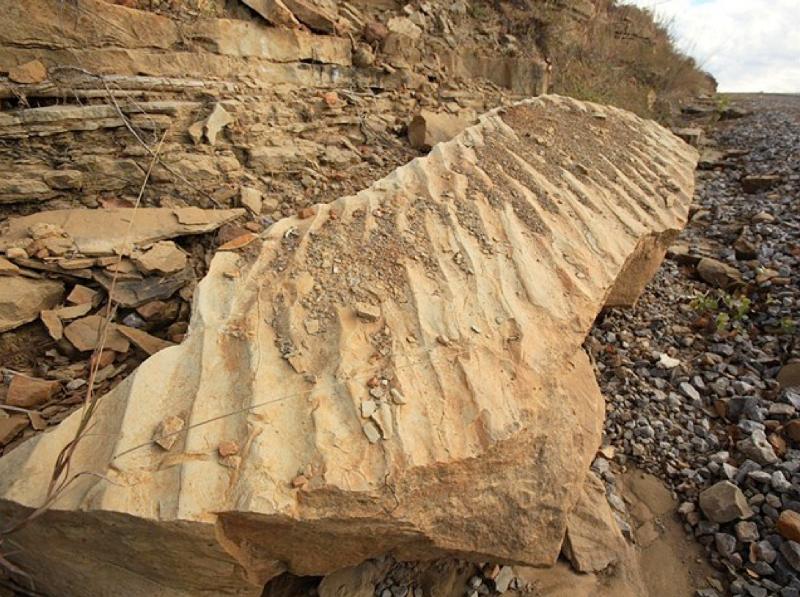
In Kansas, the Elgin Sandstone forms the scenic ledge of Elk Falls in Elk County
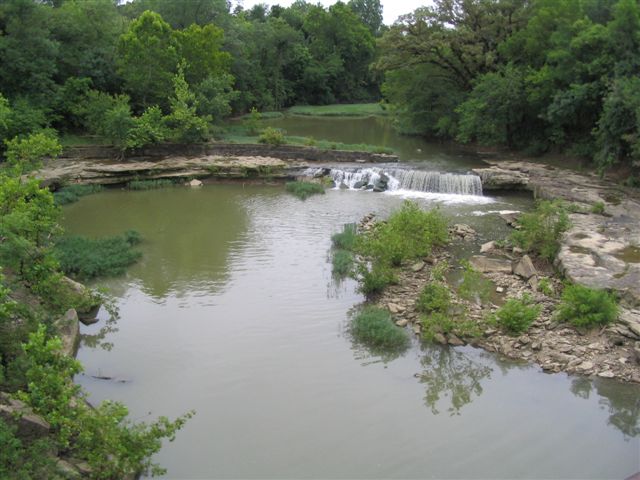
and also outcrops in the Tallgrass Prairie Preserve, located in Osage County, Oklahoma.
Now, let us see what drill-cuttings tell us about the Kanwaka Shale and the Elgin Sandstone.
Drill-cuttings Log of the Elgin Sandstone and Kanwaka Shale
The strip log records the observations of J.D. Davies, the "Dean" of Kansas sample loggers, of the Kanwaka Shale and Elgin Sandstone from a well in Comanche County, Kansas.
From the drill-cuttings graphic lithology and textual description,
- the Elgin Sandstone is reported to be a micaceous, shaly sandstone;
- the Kanwaka shale below the Elgin is sandy and micaceous and contrasted with
- the Kanwaka shale above the Elgin, which is silty
These are clearly two distinct shale facies, whose differences can be largely attributed to an abrupt change in quartz content and interpreted in terms of their depositional history.
The lower shale was interpreted to have formed from deposits of silty and sandy muds which were the initial sediments to prograde across the carbonate shelf from clastic sources to the south (Brown, 1967).
This process was terminated in the formation of the Elgin Sandstone bar-finger sandstone of the main delta front.
The shale above the sandstone is indicated to have a much lower content of quartz silt and probably represents normal marine shales that transgressed across the delta as clastic supply waned.
Nuclear Logs of the Elgin Sandstone and Kanwaka Shale
The lithodensity-neutron log of a Kanwaka Shale section is shown for a well in Clark County.
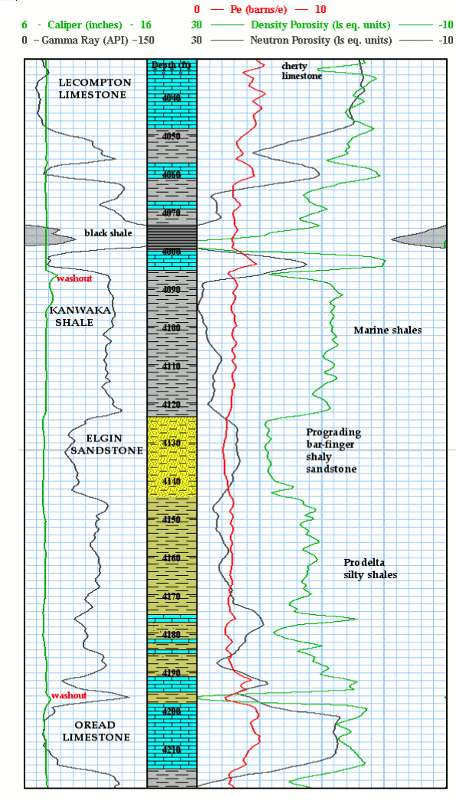
The micaceous and/or shaly character of the Elgin Sandstone is shown by the moderately high gamma radiation. Although the density and neutron porosity curves converge together, the shale content masks the density/neutron silica crossover that would be expected for a shale-free sandstone.
Indeed, it would be difficult to state unequivocally that this was a sandstone (rather than a shaly limestone or dolomite) from the logs, without the definitive excursion of the photoelectric index downwards towards the quartz value.
In contrast, at the base of the Kanwaka Shale, some thin limestones can be recognized in zones which show decreased gamma-ray matched with excursions on the photoelectric factor curve upwards towards the calcite value.
Notice that the Kanwaka Shale above the Elgin Sandstone is distinctly different from that below, with systematically higher gamma ray, photoelectric index and neutron porosity, but lower density porosity values.
These differences reflect prograding quartz-rich shales below the Elgin Sandstone with transgressive marine shales above.
Subsurface mapping is typically rather restrictive, with a focus on structure and thickness. However, here is an example, where the log properties of these Kanwaka Shale units could be mapped areally in an enriched regional model of delta morphology and an aid in the location of potential, undrilled bar finger sandstone bodies.
Coal beds commonly occur in clastic sequences, so let's check out the log properties of coal.
Log Properties of Coal
- Successions containing coals were commonly developed in deltaic environments with clastic deposits of shales, siltstones, and sandstones, as well as occasional ironstones (typically siderite).
- The clay mineralogy of the finer-grained rocks is quite variable and can show elevated contents in kaolinite, particularly in paleosols.
- The logging properties of coals vary according to their rank, but typical figures (cited from Schlumberger publications) are:
Anthracite
- Photoelectric factor 0.16 b/e
- Neutron porosity 38%
- Density porosity 72% (equivalent to a bulk density of 1.47 gm/cc)
Bituminous
- Photoelectric factor 0.17 b/e
- Neutron porosity 60%
- Density porosity 86% (equivalent to a bulk density of 1.24 gm/cc)
Lignite
- Photoelectric factor 0.20 b/e
- Neutron porosity 52%
- Density porosity 89% (equivalent to a bulk density of 1.19 gm/cc)
In using logs to evaluate coals, general guidelines are:
- The density log is generally a good indicator of ash content unless the coals are low rank (lignites and brown coals), when moisture content unduly influences the density.
- The gamma-ray log is often a more effective predictor for ash content, provided uranium is not a significant contributor.
- Most coals have a low to moderate radioactivity, although some may be "hot" because of a relatively high uranium content.
- The neutron response is influenced both by the moisture content (more important in low-rank coals) and the hydrogen content of the organic matter.
Now let us look at log responses of some coals in a Cherokee Group section.
Log Example of a Pennsylvanian Cherokee Group Coal-bearing Succession
Gulf #1 Buddenbohm was drilled in Atchison County, Kansas to evaluate coals in the Cherokee Group section. Bituminous coal has been mined in the Forest City Basin since the 1890's and, in more recent times, evaluated in terms of potential coalbed methane production.
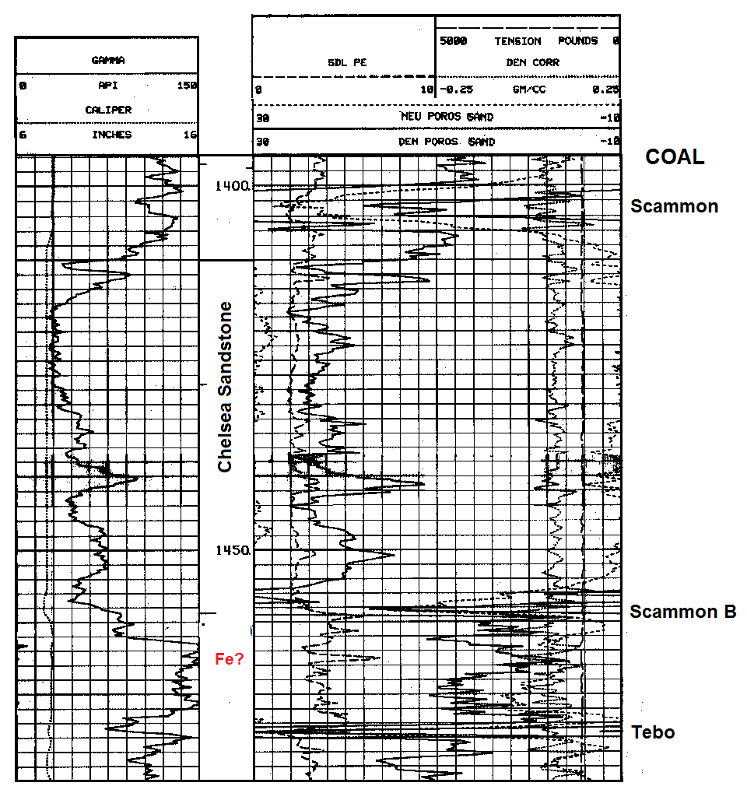
The gamma-ray, photoelectric factor, neutron and density porosity curves are displayed in a conventional log presentation. However, notice that both the neutron and density porosities are calibrated with respect to a sandstone equivalent scale, as noted by the logging engineer at the top of this log. Although a limestone-equivalent scale is the standard default choice, a switch to a sandstone scale is often made when the sequence of interest is dominantly clastic and carbonates are either missing or of no interest.
The photoelectric factor curve shows a good quartz signature in the Chelsea Sandstone. However, in a shale-free sandstone, the neutron and porosity curves would be expected to overlay. The higher neutron porosity shows that the Chelsea Sandstone has a significant clay-mineral content.
The Scammon, Scammon B, and Tebo coals are marked at their depth locations and are discriminated by their dramatically high neutron and density porosities, which move their responses to the backup scale. Whenever this pattern is shown by the logs, the caliper should immediately be checked to see if the effect is caused by a washout, rather than a coal.
The zone marked Fe? in the depth track, draws attention to a photoelectric factor reading of about 6.5 b/e which indicates significant iron content, probably caused by siderite nodules.
Locate the Coals
The Cherokee Group sequence shown below consists of a succession of shales, sandstones, and coals.
Zones A through G are clearly something other than shales, as shown by their decrease in gamma-ray response.
Prev Page--Evaporites || Next Page--Igneous and Metamorphic Rocks
Kansas Geological Survey
Placed on web March 24, 2017.
Comments to webadmin@kgs.ku.edu
The URL for this page is http://www.kgs.ku.edu/Publications/Bulletins/LA/08_clastics.html