![]()
Prev Page--Log Overlay Lithology || Next Page--Evaporites
The Photoelectric Factor (PeF)
The photoelectric factor curve was reviewed in passing in the lesson on porosity logs.
In this lesson, it is considered collectively with the gamma-ray, neutron and density porosity curves as a guide to lithological identification. The photoelectric factor (PeF) was introduced in the early-1980's as a supplementary measurement to the bulk density measurement by Schlumberger, who signaled its appearance by the designation 'Lithodensity' log. Other logging companies typically use a variant of Z-densilog as the name, where 'Z' represents atomic number whose aggregate content in the formation controls the photoelectric factor response.
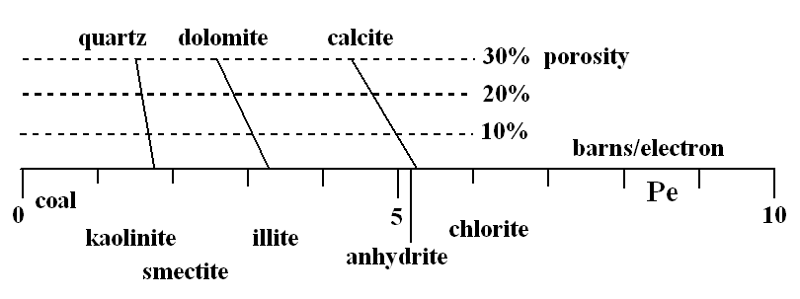
The PeF curve is commonly scaled on a range between 0 and 10 barns/electron, and a generalized interpretation guide is given in the figure above.
Next, we will review examples of gamma-ray, PeF, neutron and density porosity logs for the three major reservoir lithologies of limestones, sandstones, and dolomites.
Limestone, Sandstone, Dolomite and Examples
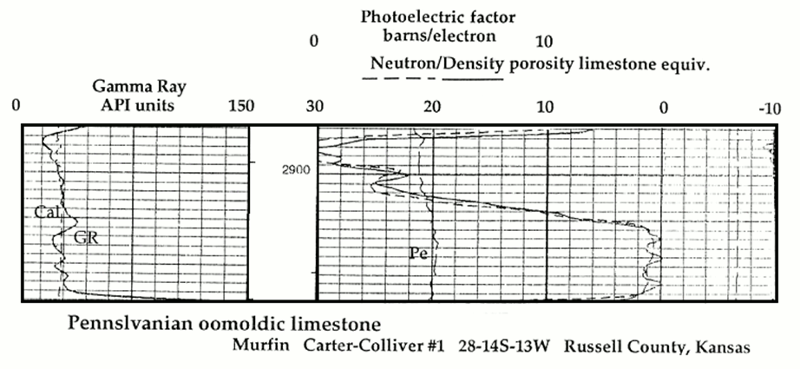
Because the unit is a limestone, the limestone-scaled neutron and density porosity curves track closely from the low-porosity (1%) wackestone below (note the slightly higher gamma-ray) to the high porosity (30%) oomoldic limestone above. The photoelectric factor decreases slightly from a value of 5.1 b/e to about 4.4 b/e, which demonstrates that the photoelectric factor curve is relatively "lazy" as a response to such a drastic increase in porosity.
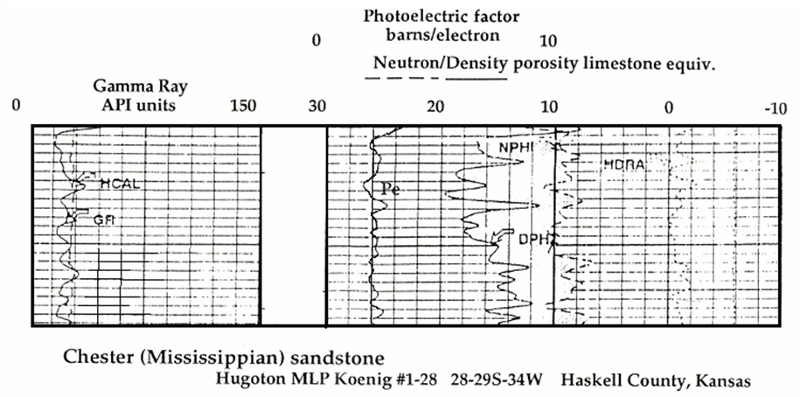
The density porosity reads higher than the neutron porosity curve in this sandstone which reflects the silica content. In general the porosity curves track together, although some "hourglass" patterns pick up small gas effects. The photoelectric factor reads about 2 b/e, which is slightly higher than an anticipated silica value of about 1.8 b/e. However, this difference is caused by calcite cement within the sandstone.
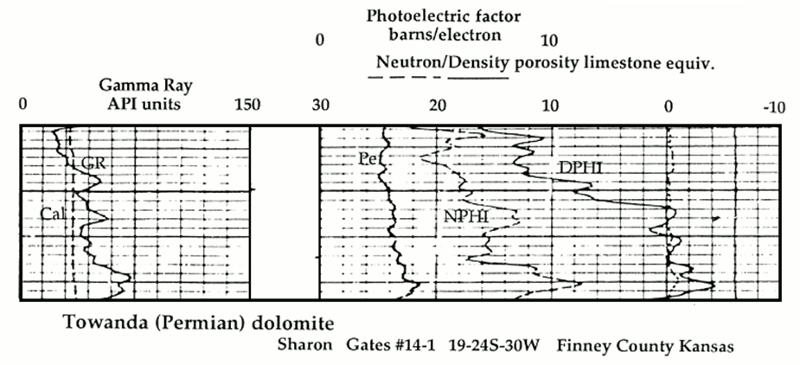
While the upper part of this section matches the expectations for a dolomite response, the lower part shows another component. The drift of the PeF curve towards 5 b/e would reflect limestone in most cases. However, in this instance, the density porosity is NEGATIVE, meaning that the rock has a higher bulk density then 2.71. The curves are responding collectively and diagnostically to anhydrite. Notice that the elevated gamma-ray in the lower section might be taken to indicate shale content. However, the photoelectric factor shows that this is not the case. The Chase Group has many "hot" dolomites, which reflect uranium content.
The interpretation of lithology from logs can be transcribed into standard lithological symbols that are used in graphic logs from visual examination of drill cuttings
Lithology Symbols in the Preparation of a Graphic Log
The symbols shown in the key are widely used in the description of drill-cuttings as records of sedimentary successions penetrated by boreholes.
Geologic Strip Log of a Jurassic Morrison Formation Section in Western Kansas
The Jurassic Morrison Formation is world-famous for its dinosaur skeletons that have been excavated from outcrops in Colorado and other western states. In Kansas, the Morrison is restricted entirely to the subsurface and has no economic value in terms of potential for oil, gas, or water.
In the illustration below, we see drill-cuttings from a Morrison section in a western Kansas well and their lithologic description drafted as a strip log.
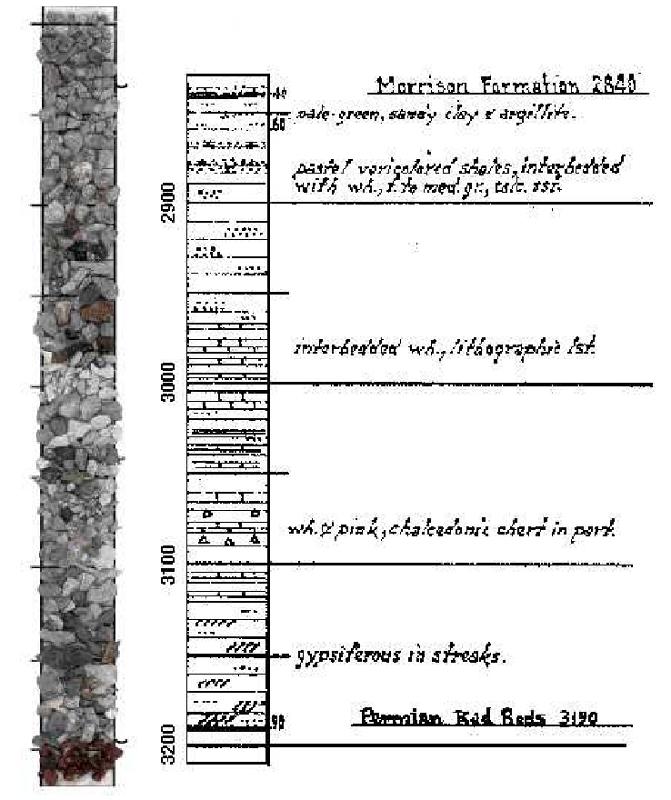
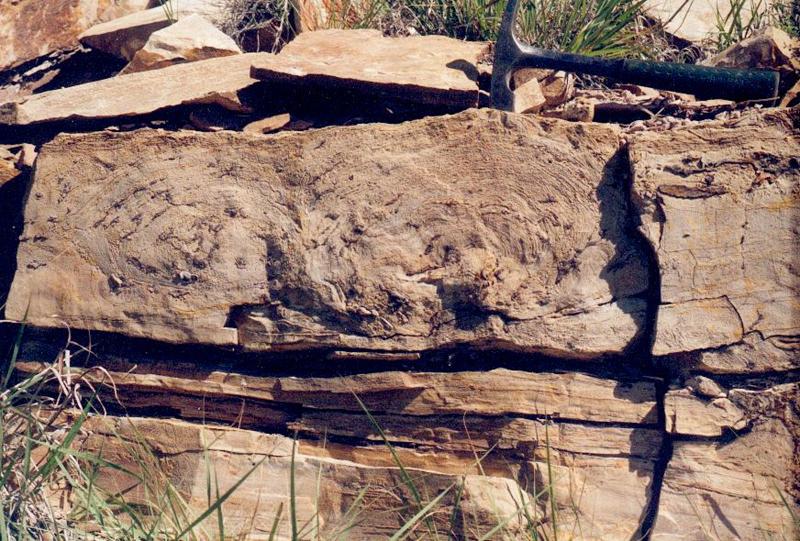
The cuttings at the top and bottom are from the Lower Cretaceous Cheyenne Sandstone and Permian red beds, respectively. This Morrison Formation section contains a lacustrine limestone that can be traced to its outcrop in south-east Colorado. North America's largest dinosaur trackway site is found in this correlative limestone facies In the Picket Wire Canyonlands.
Morrison Formation outcrop in southeast Colorado: lacustrine limestone bed with stromatolites
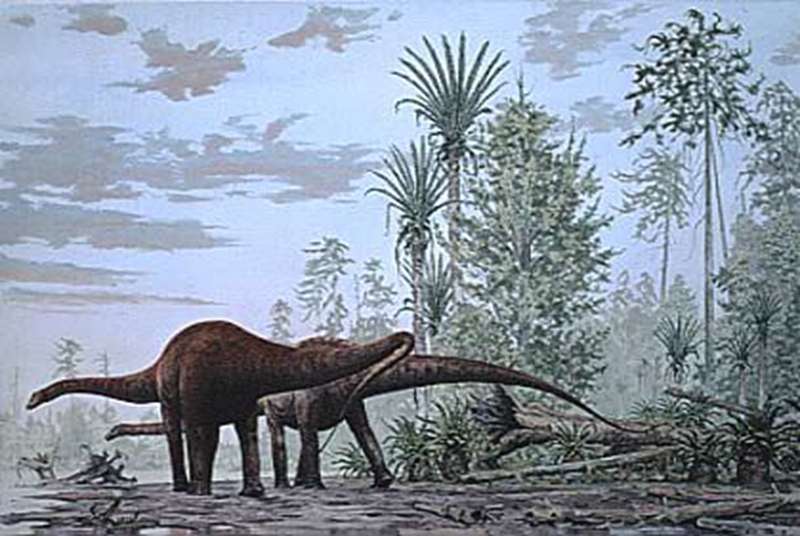
Artists concept of paleoenvironment associated wth North America's largest dinosaur trackway
Mississippian Mixed Carbonates Succession
Application of the log overlay lithology pattern recognition rules generally enables shales, limestones, and sandstones (or cherts) to be distinguished without too much difficulty.
However, mixed lithologies such as dolomitic limestone or cherty dolomite or even cherty (or sandy) dolomitic limestone occur commonly and their variability can be assessed by a thoughtful consideration of all the log curves.
We will review an interpretation of mixed lithologies in a Mississippian section from a well drilled in Wabaunsee County, Kansas.
However, before looking at the logs, let us see what a geologist reported from observation of drill-cuttings in a nearby well.
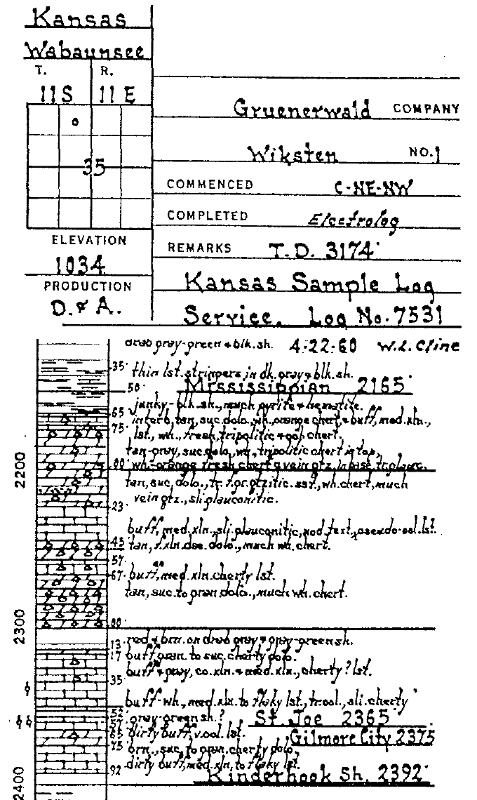
The drill-cuttings could be considered ideally as "ground truth" and contrasted with logs which are "remotely sensed" data in which lithologies are interpreted from physical properties.
The ground truth of drill-cuttings can be muddied by misidentification, contamination of samples by cavings, lag time variability, and other issues. If the samples are bagged at the conventional frequency of a bag every ten feet, then this is coarser then the resolution of the nuclear logs which is between two and three feet.
In picking formation tops, the wellsite geologist will utilize the record of drilling time and refine his/her estimates by reference to the logs when the hole reaches total depth.
The Mississippian strip log was drafted by a geologist from examination of drill-cuttings with a binocular microscope. it shows a succession of interbedded limestones, dolomites, and dolomitic limestones with variable mounts of chert content as indicated by the number of triangle chert symbols. These lthologies are typical of the Osagian and Meramecian Series in north-east Kansas.
Now let us see an interpretation of Mississippian carbonates in a nearby Wabaunsee County well that is based on the gamma-ray, photoelectric factor, neutron and density porosity logs.
Log Overlay Interpretation of a Mississippian Mixed Carbonate Succession
Above the Pennsylvanian unconformity, we can see the Burgess Sandstone, clearly recognized by its photoelectric factor and density reading higher than neutron porosity. As mentioned before, the log responses are diagnostic of silica, so that an alternative interpretation is that this unit is chert. However, the stratigraphy of this area clearly identifies this silica interval as the Burgess Sandstone.
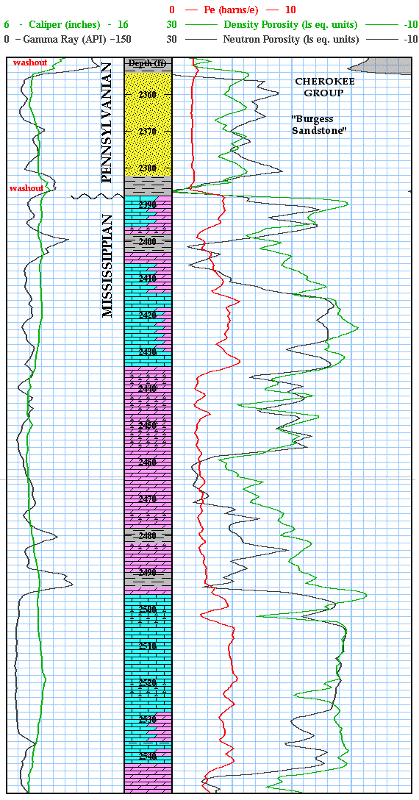
The log fluctuations at the top of the Mississippian reflect varying compositions of dolomitic limestones whose interpretation is drafted graphically by the strip log plotted in the depth track.
Below this unit, the neutron and density porosity curves overlay quite closely, which would suggest a limestone. However, the photoelectric factor shows this emphatically to not be the case. Rather than an anticipated limestone PeF value of about 5 b/e, the curve is confined to a range between 2 and 3 b/e. This unit is a cherty dolomite where the effect of chert (density higher than neutron density) is confounded by the effect of dolomite (neutron higher than density porosity). The resulting destructive interference makes the neutron-density overlay "look" like a limestone.
Below the cherty dolomite unit is a full-blooded dolomite and the basal section is a limestone.
Notice that none of this complexity would have been apparent if attention had been confined to the gamma-ray logs, other than the occasional shale horizons which are marked.
Notice also how these distinctive lithology units are also characterized by significant contrasts in porosity. From a more engineering perspective, the divisions break out as discrete flow units, where higher porosities are matched with increasing dolomite content and the limestones are relatively tight.
By correlating these units with neighboring wells, an interesting geomodel could be developed, with strong flow unit implications for reservoir engineering simulations.
In south-central Kansas, extensive subaerial exposure of the Mississippian has created a residuum of chert at the top of the Mississippian known as "Chat" which is an important oil and gas reservoir unit.
The Mississippi "Chat"
The Mississippian "Chat" (chert) reservoirs of south-central Kansas are prolific oil and gas fields.
During the Mississippian, sponge communities formed low relief biostromes and bioherms that resulted in a thick succession of limestones with varying contents of siliceous sponge spicules. Subsequent uplift and subaerial weathering created a residuum of chert with porosities ranging from 25 to 50%. The "Chat" overlies a dolomitized sequence of cherty dolomites, cherty limestones and limestones with much lower porosities.
The drill-cuttings strip log of a Mississippian section from a well in Cheyenne County, Kansas is a good illustration of the lithofacies architecture.
The residual chert overlies cherty dolomites that grade downwards into cherty dolomitic limestones, cherty limestones, and limestones at the base.
These compositional changes can also be seen reflected on gamma-ray, photoelectric factor, neutron and density porosity curve overlays.
A Mississippi "Chat" Nuclear Log Suite
The logs shown are for a Mississippian section from Pioneer #4 Petrie, a well that was drilled in Sedgwick County, Kansas.
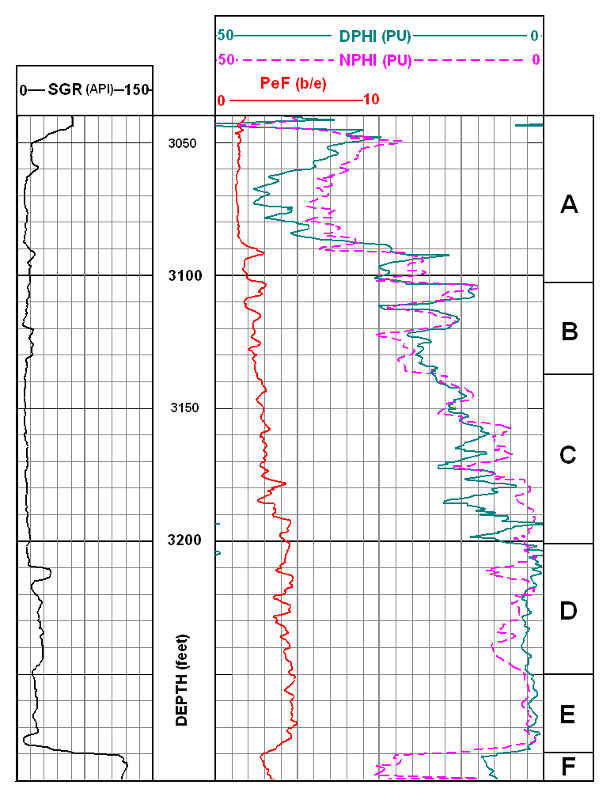
Consider this log section carefully, not only in terms of the log overlay lithology recognition rules but also with respect to the general "ground truth" of the cuttings log shown on the previous page.
Next, we will conclude the lesson with a summary of the strategic approach to lithology interpretation from nuclear log overlays.
Don't Shoot the Pianist--He is Doing the Best He Can
The standard conventions of multiple log display provided to users are designed so that rock types and porosity can be read immediately, in an analogous way that a melody can be read from sheet music.
A melody consists of a sequence of notes which are subdivided into time intervals and bars. This aspect is commonly termed a horizontal pattern and is supplemented by a vertical pattern of chords and counterpoint which carry harmony. Written as sheet music, a tune therefore has two dimensions of horizontal-melodic and vertical-harmonic. A musical score may have limited meaning for non-musicians, but its mastery is a matter of applied practice rather than an intellectual accomplishment.
An experienced log analyst can read and interpret a multiple set of log traces with much the same ease that a musician can play a tune on a piano from a reading of sheet music. The responses of logs to a variety of lithologies are themes that are repeated with variations along the record of a stratigraphic sequence. The major composite variations and fluctuation of the log suite carry the "melody" of the interbedded lithologies and their reservoir properties. Differences between the logs are "harmonic" elements which carry useful information concerning changes in mineralogy and fabric.
Let's read the "libretto" from a logged section of Pennsylvanian Morrow and Mississippian from a well in Clark County, Kansas.
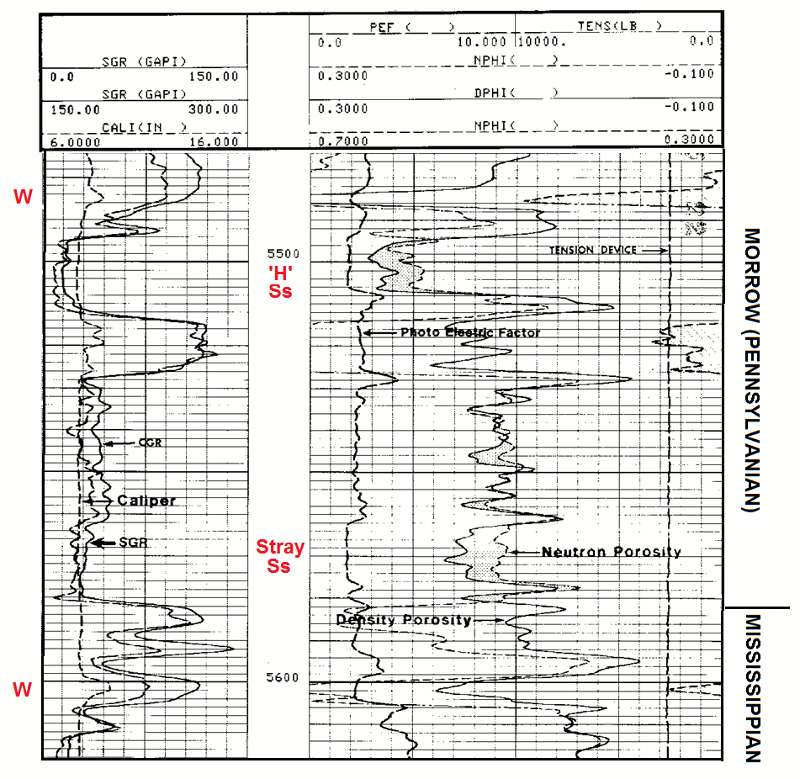
First check the caliper in Track 1 for washout zones.
These are localized indentations in the borehole wall that cause the neutron and density pads to lose contact with the formation. Consequently, both density and neutron curves read excessively high porosities. (See zones marked 'W' on the log.) The effect is most marked on the density curve because it has a shallower depth of investigation.
Generalized borehole enlargement is not the issue, because the mechanical arms of the tool expand to maintain pad contact. Washouts occur in less competent horizons that have been eroded by circulating drilling-mud and are more prevalent in shallow, less compacted formations, particularly in friable shales. The caliper curve is similar to a weathering profile which, when strongly developed, can be useful in itself in bed differentiation and stratigraphy.
Then evaluate the gamma-ray curve in Track 1 to partition the sequence between shales and "non-shales."
If both the CGR and the SGR are available, then use the CGR, because it measures potassium and thorium contents linked with shales, unperturbed by uranium contained in the SGR. If only a standard gamma-ray is available, then be vigilant to not misinterpret uranium effects as shale.
Next check the photoelectric factor (PeF) curve.
Limestones and sandstones (or cherts) are easiest to pick, because their values are at the extremes of the basic PeF dynamic range. Remember that the PeF is sensitive to silica, and does not distinguish between quartz sand and chert. The distinction is your call, based on regional stratigraphy.
Don't be fooled by anhydrites with their similar PeF values to limestone. With a density of 2.98 gm/cc, an anhydrite will read negative porosity on an equivalent-limestone scale.
Photoelectric factor values that exceed 6 barns/electron are almost always a response to iron in minerals such a pyrite, siderite, hematite, and goethite.
A variety of interpretations are possible for mid-range PeF values which could represent shales (check the gamma-ray curve), dolomite or sandy (or cherty) limestones. In this more ambiguous region, coordinate the PeF curve with the neutron-density porosity curve overlay.
Finally, evaluate the neutron-density porosity curve overlay.
The basic pattern recognition of sandstone/chert (density higher porosity than neutron), dolomite (neutron higher than density porosity) and limestone ( density and neutron porosities are similar) is valid for SHALE-FREE zones. Shales will have both a higher gamma-ray value and a neutron porosity greater than a density porosity. A very common error is to falsely interpret dolomitic limestone for zones which are actually shaly limestones. So, when the neutron porosity starts to exceed the density porosity, check the gamma-ray log to see if this effect is mirrored by an increase in gamma-ray value.
Also, when the neutron and density porosities are very similar, do not immediately conclude that it is a limestone, but glance at the PeF curve to check if it shows a value close to 5 b/e. If the PeF reads between 2 and 3 b/e, then you are being fooled by a sandy or cherty dolomite (where the competing effects of quartz and dolomite on the neutron and density porosity curves approximately cancel out).
These are simple "starter" rules for the aspiring geological petrophysicist. With practice, interpretation becomes instinctive for basic stratigraphic successions. Unusual lithologies or complex mixtures often require a little more reflection just as a more difficult piece of sheet music will challenge a pianist.
Now it's your turn...
The Oz Machine is a Java applet coded by Geoff Bohling to accompany this online tutorial and is located at:
http://www.kgs.ku.edu/PRS/ReadRocks/portal.htmlThe Oz Machine generates and displays sets of logs based on synthetic lithological sequences generated as Markov Chain simulations of Midcontinent successions. Although artificial, they provide useful interactive exercises for the beginner to sharpen their skills in geological log interpretation. Feedback on the validity of lithology picks are provided immediately, so that progress in recognition ability can tracked and evaluated.
An online paper that describes the philosophy and design of the Oz Machine was published as:
Bohling, G.C., and Doveton, J.H., 2006, The Oz Machine: A Java applet for interactive instruction in geological log interpretation: Geosphere: v. 2, no. 5, p. 269-274. [available online]
More examples of log overlay interpretation are described in the following sections for Evaporites, Clastics and Coal, Igneous and Metamorphic Rocks.
Prev Page--Log Overlay Lithology || Next Page--Evaporites
Kansas Geological Survey
Updated July 31, 2017.
Comments to webadmin@kgs.ku.edu
The URL for this page is http://www.kgs.ku.edu/Publications/Bulletins/LA/06_photo.html