![]()
Prev Page--Digital Logs || Next Page--Nuclear Porosity Logs
The Gamma Ray Log
Gamma Ray Sources in Rocks
Radioactive isotopes of elements continuously decay to more stable forms and emit radiation of several types. Gamma rays have longer penetrations than either alpha or beta rays, and can be measured by simple counter devices, such as a Geiger counter.
Although many radioactive isotopes are known, only three types occur in any appreciable abundance in nature:
- the uranium series,
- the thorium series,
- and the potassium-40 isotope.
The uranium series consists of uranium isotopes which decay to radioactive daughter and granddaughter isotopes of other elements. The rate of decay is used to date rocks by the uranium-lead method of geochronology. The thorium series also has a spectrum of radioactive decay isotopes. Potassium-40 is a radioactive isotope of potassium and is used for age dating of rocks by the potassium-argon method.
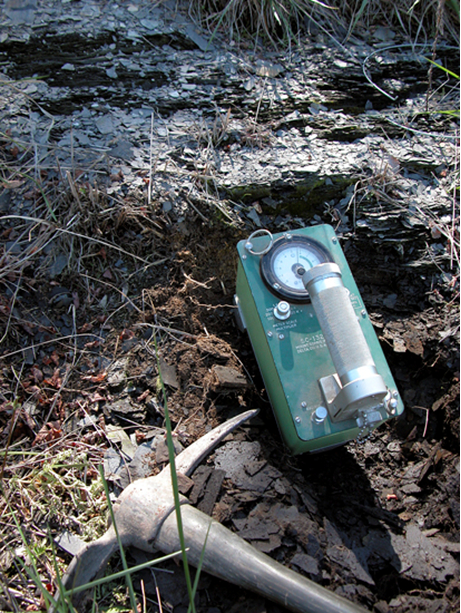
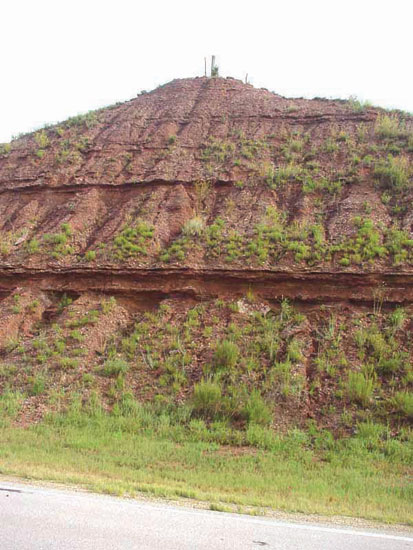
The photograph shows a Geiger counter on an outcrop of the Heebner Shale at the corner of 17th Street and Bob White in Lawrence. The Heebner Shale is a "black shale," whose color is caused by organic matter content. Both the organic content and phosphate nodules in the Heebner Shale are hosts for uranium. The high uranium content causes relatively high readings on the Geiger counter. Because of its elevated uranium, the Heebner is more radioactive than the overlying Kanwaka Shale and the underlying Lawrence Shale which are "gray shales." However, both black and gray shales have radioactive sources of thorium and potassium and contrast with low radioactivity of the limestones between these shale units.
The Gamma-Ray Log Scale
The earliest detectors on logging tools were Geiger counters, but these have been replaced by crystal scintillation detectors in most modern tools.
Because radioactive decay is a stochastic process, some degree of smoothing is made by an averaging (time constant) circuit to cut down the statistical noise. The count rate is also smoothed by the logging speed of the tool as it is raised through the borehole. The time constant and logging speed therefore influence both the bed resolution and the amount of noise recorded on the gamma ray log.
Older tools were recorded in "counts" or as microgram equivalent weights of radium per ton. All modern logs are scaled in terms of the API (American Petroleum Institute) gamma ray unit. The API test pit at the University of Houston uses a concrete calibration standard with a value of 200 API units thought to be about double that of an "average" mid-continent shale.
The Gamma-Ray Curve
The gamma-ray curve is conventionally displayed in Track 1 on logs. It is common practice to see the scale range of zero to 150 API units, with a wrapped scale of 150 to 300 API units, if the curve exceeds 150 API units. However, this scaling is the conventional choice, but is under the control of the logging engineer. In the Niobrara Chalk well, we have already seen that the logging engineer elected to use an expanded scale of zero to 400 API units. He did this because the high uranium associated with the kerogen in the chalk would have created an annoying tangle of wrapped curve on a zero to 150 API units scale.
The gamma-ray log is made on every run as a reference curve to help maintain good depth registration between separate runs.
Gamma-ray scans of core are also taken to reconcile core depths with log depths.
In most stratigraphic and petroleum geological applications, the gamma ray log is used as a "shale log," both to discriminate shales from "clean" formations, and to estimate the relative shale proportions in shaly reservoir units.
The higher levels of radiation in shale are caused by absorption of thorium by clay minerals, the potassium content of clay minerals (principally illite), and uranium fixed by associated organic material.
By contrast, sandstones, limestones and dolomites commonly have low levels of radioactivity, although numerous exceptions occur. Sources of gamma radiation in sandstone can often be attributed to clay minerals, potassium feldspars (in arkosic sandstones), micas (in micaceous sandstones) or heavy minerals (such as zircons).
In carbonates, radioactive zones are usually either shaly horizons or levels of uranium mineralization, typically disseminated through the rock by diagenetic processes or precipitated within fracture systems.
Gamma-Ray Logs of Gray Shales and Black Shales
The gamma-ray log was recorded for an Upper Pennsylvanian section of limestones and shales from an exploration well in Wabaunsee County, Kansas. The section is nearly a thousand feet in length and the gamma-ray scale has been expanded to 400 API units to accommodate the higher radioactive black shales.

- The limestones have low radioactivity, with a value of about 20 API units.
- A representative value for the gray shales is in the neighborhood of 120 API units.
- The black shales are marked by much higher and variable radioactivity which is controlled by their uranium content.
The succession consists of cyclothems that record repeated marine transgressions and regressions in response to sea-level rise and fall, associated with pulses of glaciation in an "icehouse" world.
The Kansas Pennsylvanian Cyclothem
The basic cyclothem is initiated by Lowstand terrestrial deposits of gray shales and sandstones with local developments of coals, succeeded by a Transgressive systems tract limestone. Black shales occur in the Highstand condensed section and interpreted to reflect deposition in the deepest water under reducing conditions which preserve organic matter and concentrate uranium. The black shale shows an upward transition to a gray shale as the depth shallowed and waters became more oxygenated. The succeeding Highstand regressive systems tract limestones record progressive shallowing and the cyclothem is terminated by terrestrial sandstones and gray shales.
[From Heckel and others (1979)]
Mapping Gamma-Ray Log Response
Each gamma-ray log records changes in the vertical, time dimension at a single location. However, the mapping of the gamma-ray response of a specific stratigraphic unit can show areal changes that reflect paleogeography and regional patterns of depositional environment. As an example, maximum gamma-ray readings of the Heebner Shale from wells in eastern Kansas were contoured as a map, to augment observations from outcrop from Lawrence down to the Oklahoma border. The higher values in the north may reflect areas of deeper water, while the progressively lower values in southeast Kansas shows prograding clastics from the Appalachians as documented from many outcrop studies. Outcrop studies are the key to the interpretation of aspects of sequence stratigraphy and depositional environment, but are geographically restricted to a linear belt of surface exposure. The mapping of subsurface log data substantially expands the geographic framework for geological interpretations.
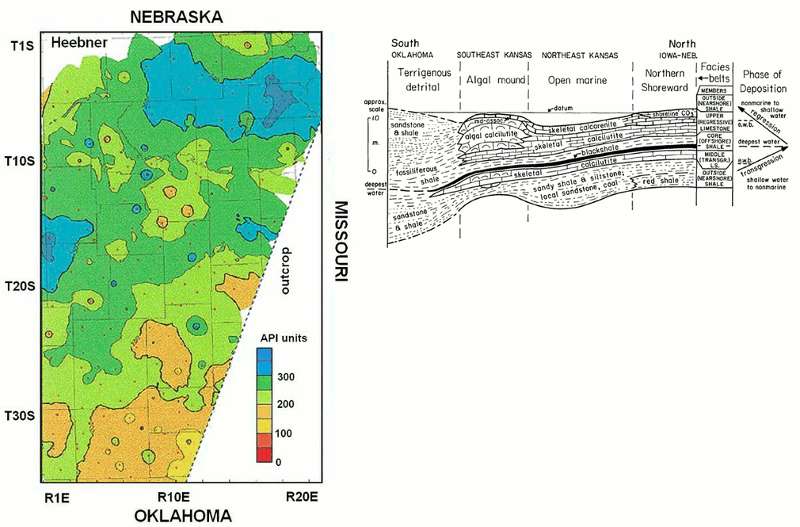
[Map from Doveton and others (1979)
[Cross section from Heckel and others (1979)]
The Gamma-Ray Spectrum
The counts recorded on a standard gamma ray log are the sum of all gamma rays, most of which are emitted by potassium-40 and isotopes in the uranium and thorium series.
The energy levels of the gamma rays are characteristic of their source isotope and form distinctive spikes on a gamma-ray emission spectrum, although in practice these spikes are smeared into a diffuse train of peaks by scattering events.
By subdividing the total energy range into restricted windows, estimates can be made of the separate contributions of potassium-40, uranium and thorium through computer processing.
The first commercial spectral gamma-ray logs were introduced by Dresser-Atlas. An initial successful application was the detection of radioactive fractures in Austin Chalk wells (Fertl et al., 1980). These zones had originally been interpreted as shale zones and not perforated. By running a spectral gamma-ray log, shales (moderate potassium and thorium contents, but low uranium) could be differentiated from uranium-bearing fracture zones (low potassium and thorium, but high uranium). Recompletion of the well using this information increased production seven-fold in some cases.
Essentially, the uranium had been emplaced in the Austin Chalk through the precipitation of uranium salts by fluids moving through fracture systems.
Not all fractures have increased uranium and there are a variety of mechanisms by which uranium can be concentrated in a rock as we shall discuss shortly.
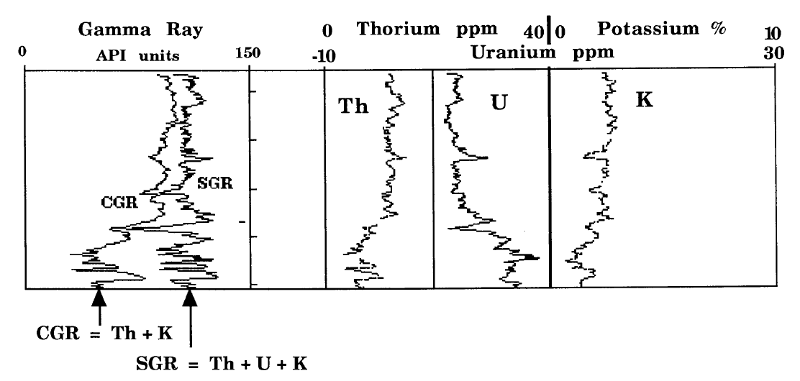
The Spectral Gamma-Ray Log
The spectral gamma ray log is displayed as three curves of thorium (ppm), uranium (ppm), and potassium (%), while the gamma ray track records two gamma ray curves, the standard (SGR) and computed gamma ray (CGR). The SGR records the total gamma ray count from all sources, while the CGR results from the subtraction of the uranium contribution from the SGR. Because the CGR is the summation of thorium and potassium sources, this curve is an improved log to estimate clay content, free of perturbations by uranium.
Gamma-Ray Responses of Standard Shales
The relationship between compositions and equivalent API contributions to a Schlumberger spectral log is given approximately by the multipliers of
- 4 for Th (ppm),
- 8 for U (ppm),
- and 16 for the K (%) estimates.
This relationship provides a useful method to predict subsurface gamma-ray logging values of shale samples from outcrop and core, based on laboratory geochemical measurements.
Gray Shale Standard
Analyses of the North American Shale Composite (NASC) reference standard for gray shales (Gromet et al., 1984) reported values of
- Th 12.3 ppm,
- U 2.66 ppm.,
- K 3.2%,
which converts to an equivalent SGR log reading of 121.7 API units, when applying the 4-8-16 multipliers.
The hypothetical log value of the NASC standard is a good match with the gray shales of most Midcontinent Pennsylvanian successions.
Black Shale Standard
Equivalent expectations of the gamma-ray log response of black shales can be predicted from core or outcrop samples that have analyses of thorium, uranium, and potassium contents. So, for example, the Marine Sciences Group Black Shale Composite (BSC) described by Quinby-Hunt et al. (1989) is characterized by values of
- Th 11.6 ppm,
- U 15.2 ppm,
- K 2.99%,
which is equivalent to an SGR log reading of 215.84 API units.
As might be expected, the K and Th contents of this black shale composite is similar to the gray shale NASC standard, because those sources are controlled by clay mineral and silt content.
However, the high variability of U contents among black shales results in a broader range about the BSC standard, so that a maximum equivalent of about 3700 API units would be expected for the black shale with the most elevated U content reported by Quinby-Hunt et al. (1989).
Shales are the most common radioactive lithology that is seen on a gamma-ray log. However, other lithogies can generate high gamma-ray readings and their expected API values can be computed by applying the 4-8-16 multipliers to analyses of thorium (ppm), uranium (ppm), and potassium (%), where these are available.
A Black Shale-Gray Shale Log Example
In recent years, black shales have become viable targets for hydrocarbons as resource plays when the kerogen of the organic matter is converted to oil and gas through maturation. These black shale aspects will be considered, together with other organic mudrocks in a later lesson.
The gray Kinderhook Shale overlies the black Chattanooga Shale in the spectral gamma-ray log below, from a well in southern Kansas.
- Notice that the SGR (and potassium and thorium contents) are very similar in the two shale units, and that the difference is in the uranium linked with the kerogen content.
- The Oklahoma equivalent to the Kansas Chattanooga Shale is the Woodford Shale, which as been a major play for shale gas.
Uranium in Limestones
Exceedingly high concentrations of uranium in limestones are unusual, so that the only limestone that qualifies as a commercial source of uranium is the Jurassic Todilito Limestone of New Mexico. Although various theories have been proposed for its origin, dating suggests emplacement shortly following deposition in a layer interpreted to be a sabkha deposit. Rawson (1980) proposed that uranium-bearing groundwater was drawn upwards by evaporitic pumping and precipitated by a decaying algal mat.
However, zones with anomalous concentrations of uranium in limestones are often seen on gamma-ray logs and their origin can be attributed to a variety of mechanisms such as:
- precipitation of uranium by fluids migrating through fractures
- concentration by paleowatertables
- geothermal fluid emplacement
Uranium in Pennsylvanian Regressive Limestones
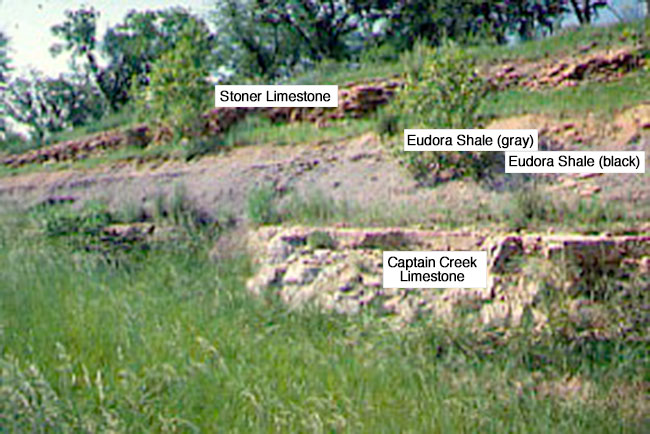
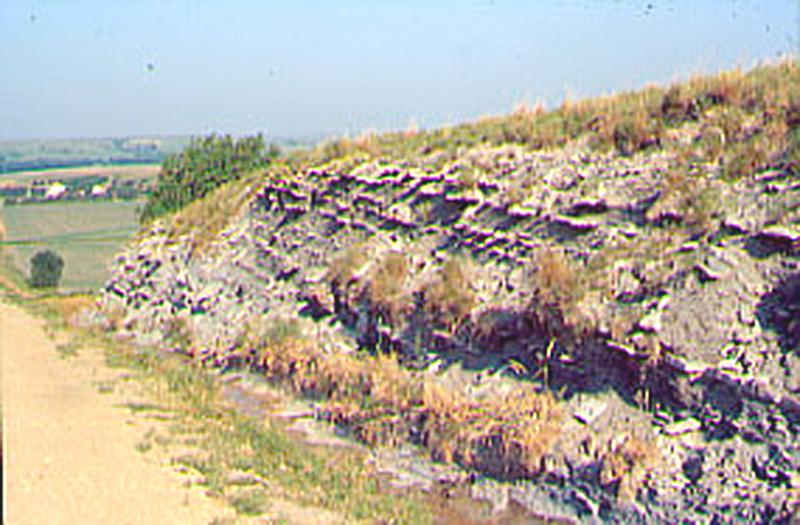
The Highstand regressive limestones of Kansas Pennsylvanian cyclothems record a progressive shallowing of water depth and the uppermost part is commonly rubbly with shale-filled dessication cracks.
Outcrop of the Stanton cyclothem near Kansas City showing the regressive Stoner Limestone, the Eudora Shale (gray), the Eudora Shale (black), and the transgressive Captain Creek Limestone.
On the next page, we will see the logs for the Plattsburg and Stoner cyclothems in a well in Wabaunsee County.
Gamma-Ray Logs of the Plattsburg and Stanton Cyclothems
In the Stanton cyclothem above, notice:
- the upper (gray) and lower (black) shale zones of the Eudora Shale, as shown by the differences between the CGR and SGR logs in Track 1
- that the Stoner Limestone is fairly shale-free as evidenced by the CGR curve, but shows a distinctive uranium anomaly in a zone displaced slightly below the top of the limestone
In the Plattsburg cyclothem, notice:
that the regressive Springhill Limestone shows a similar uranium anomaly to the regressive Stoner Limestone.
An equivalent outcrop in Nebraska and its geological interpretation is shown below.
[From Heckel and others (1979).]
Finally, an important lesson from this log is that any uranium anomalies will make a limestone appear to be shaly if logging is restricted to a conventional gamma-ray log. This is a reason why companies will pay extra money to run a spectral gamma-ray log, when carbonates in a section of interest are known to be "hot," such as occurs in the Permian Chase Group of the Hugoton Gas Field.
How was the uranium emplaced in these regressive limestones? Maybe the answer is on the next page.
Uranium Emplacement in Paleo Water Tables
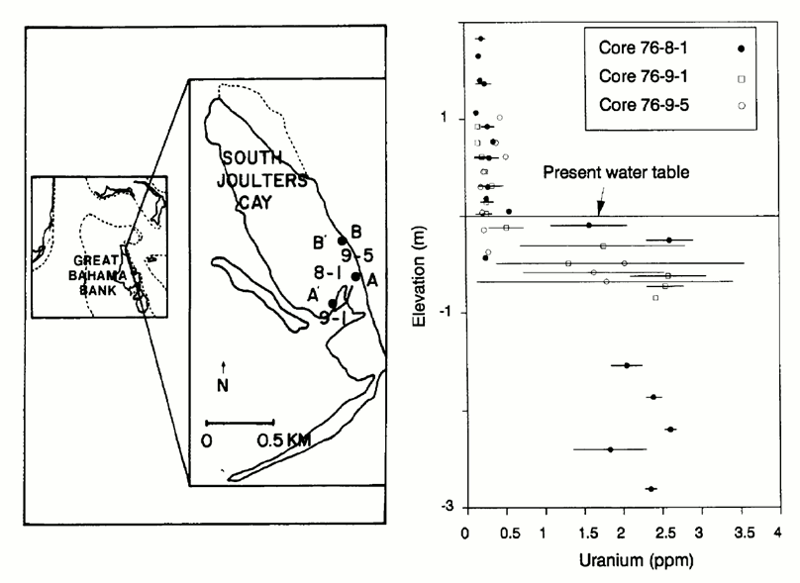
One possible mechanism to account for these uranium enrichments in the upper regressive limestones is that the uranium was concentrated immediately below the interface of the phreatic and vadose zones at the time when the limestone was partially exposed in a coastal complex setting.
This is the mode of occurrence of uranium anomalies that have been measured in modern cays in the Bahamas (Chung and Swart, 1990).
If the modern analog can be demonstrated as applicable to these Pennsylvanian limestones, then gamma-ray logs may provide a tool to map ancient water tables and interpret paleogeography.The Vilas and Rock Lake shales commonly show paleosols and clastic zones indicative of deltaic deposits in outcrops that occur at a short distance from this well location.
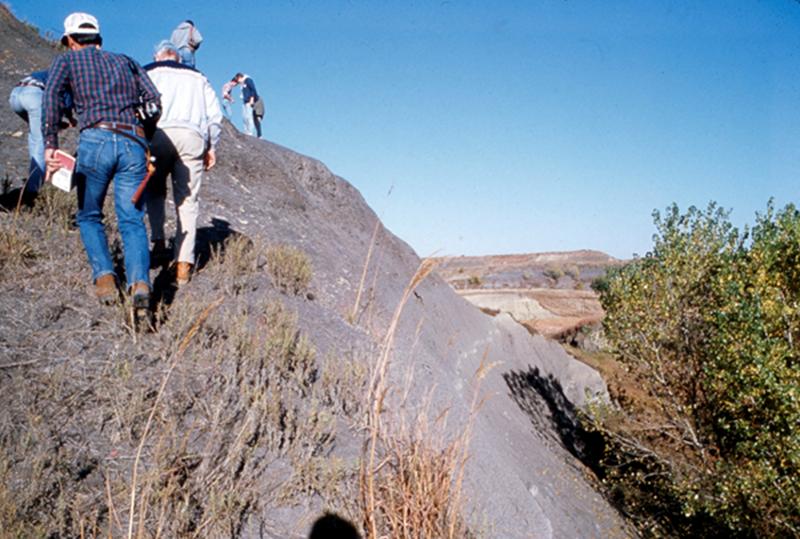
A major advantage of the gamma-ray log over other logs is that it is possible to make equivalent measurements on an outcrop or cored section, using a geiger counter or scintillation detector. This commonality allows direct comparison between subsurface logs and surface rock to link radioactivity patterns with visual properties and so clarify geological interpretation.
Professors Goldstein and Franseen zap the outcrop.
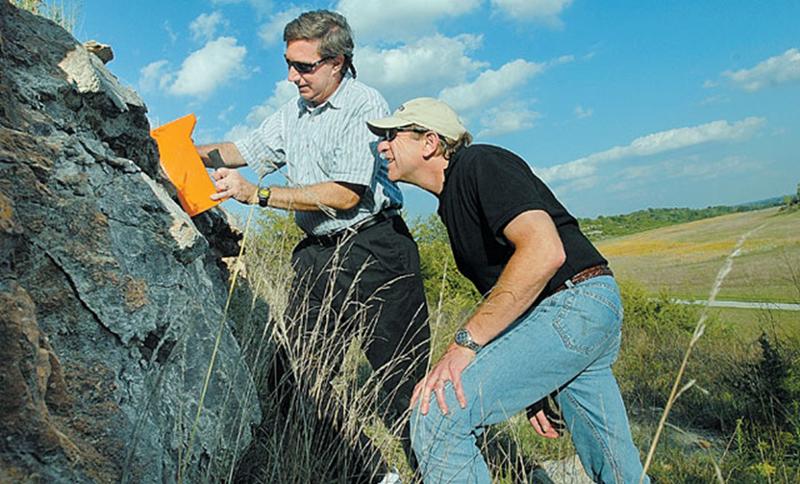
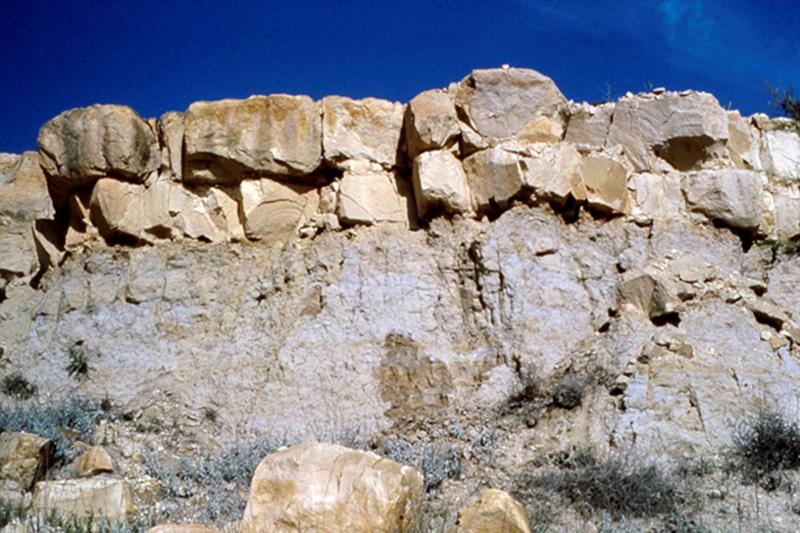
Wilke (2000) found a systematic uranium anomaly within the Pennsylvanian Bethany Falls Limestone in a quarry in central Kansas. The anomaly was observed to be horizontal and cut across the cross-bedded oolitic limestones of the Bethany Falls. The Bethany Falls is a regressive limestone which has mangal rootlets at the top which appear to terminate at an ancient contact between vadose and phreatic zones. The uranium content shows a significant increase immediately below this contact, suggesting emplacement by a paleogroundwater regime.
Late Diagenesis Hydrothermal Uranium Emplacement
The Permian Chase Group of the giant Hugoton gas field is routinely logged with spectral gamma-ray tools because significant contents of uranium occur locally in dolomitized formations and can be misidentified as shales or shaly carbonates when using standard gamma-ray logs.
The problem is shown by the example of gamma-ray logging of the Towanda and Fort Riley limestones in a Hugoton gas well. If a conventional gamma-ray tool was run, then the result would match the SGR curve and the section would appear to have many shale beds. With the removal of the uranium component, the CGR curve shows that the shale content is much more subdued within the two limestones.
Luczaj and Goldstein (2000) concluded from fluid-inclusion studies and U-Pb chronology that the uranium was emplaced as one of several diagenetic events of dolomitization in the Late Permian in third-order cements. This contrasts with syndepositional mechanisms such as evaporitic pumping or groundwater phenomena.
The potassium and thorium content of the CGR curve reflects clay content, which fluctuates within both the Towanda and Fort Riley limestones. This section was cored and the texture of the carbonates described in terms of the Dunham classification, ranging from packstone to mudstone. The textures described from core are superimposed on the CGR curve and there is an excellent correspondence between the two profiles. Because the Dunham texture scale is based on relative mud-to-grain proportion (see below), the correspondence with the clay content mapped by the CGR curve is not surprising.
Spectral Gamma-Ray Ratio Analysis
The SGR and CGR curves in Track 1 provide a quick-look evaluation of clay content (CGR) and uranium (difference between the CGR and SGR), as described in the previous pages.
The thorium, uranium, and potassium curves in Tracks 2 and 3 record the quantities of these elements, which can be used in a more systematic analysis.
Spectral gamma-ray log analysis is commonly made on the basis of- the thorium-to-potassium (Th/K) ratio
- and the thorium-to-uranium (Th/U) ratio
The application of the Th/K and Th/U ratios to geological interpretation is described with respect to a hydrologic observation well KGS #1 Braun located near Hays, Kansas that drilled through a Cretaceous and Permian succession.
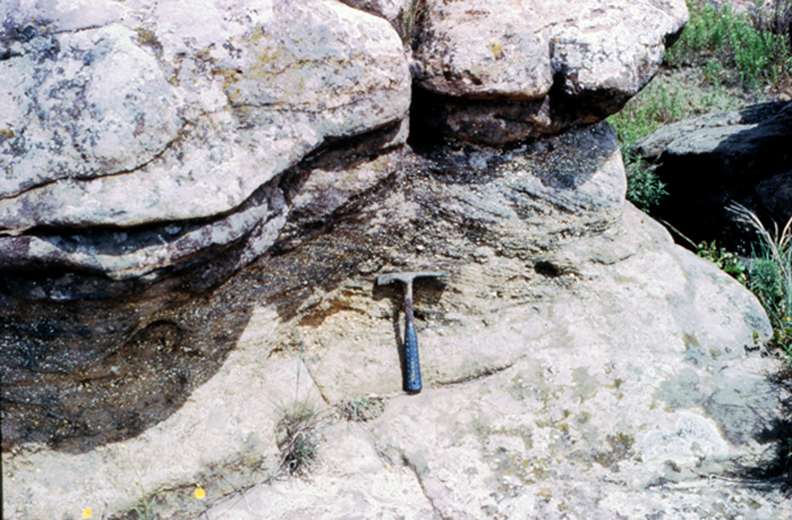
In most wells in the area it is easy to tell when the drill-bit penetrates the Permian Cedar Hill Sandstone, because the sandstone is stained with hematite, which causes the mud pit to turn red. In this instance, there was no change in mud color, but the well had clearly penetrated the Cedar Hills because of the drill-cutting returns of frosted grains which were diagnostic of their eolian origin, and differentiated them from the deltaic sandstones of the overlying Lower Cretaceous section. Another distinctive property of the Cedar Hills Sandstone is that it contains moderate quantities of potassium felspar. The potassium curve of the spectral gamma-ray log should therefore be useful in picking the Cretaceous-Permian unconformity. A casual inspection of the potassium curve might suggest that the unconformity is located at about 790 feet depth. Wrong! It is actually found at 900 feet depth.
Cedar Hills Sandstone outcrop
The correct pick is made when considering the potassium in conjunction with the thorium as expressed by the Th/K ratio discussed on the next page.
The Thorium-to-Potassium (Th/K) Ratio
The potassium-thorium crossplot is useful for the recognition of clay minerals and distinction of micas and K-feldspars.
The lines that radiate from the origin of the plot have gradients matched with values of the Th/K ratio. The ratio values are calculated using Thorium in ppm and potassium in percent (NOT decimal).
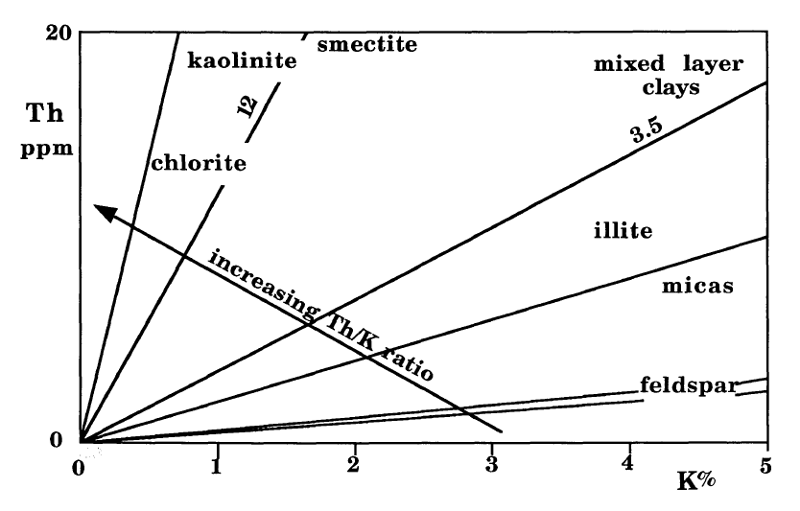
The ratio is a relative measure of potassium richness as related to thorium.
Illite has higher potassium than mixed-layer clays or smectite, while kaolinite has little or none.
Generalized fields of expectations of mineral responses on a thorium-potassium crossplot are shown in the crossplot. The crossplot should be used cautiously and intelligently, because clay minerals show wide variability in composition and most shales contain mixtures of different clay mineral species.
This thorium-potassium crossplot shows the relationships between potassium and thorium for the entire logged section in the Braun well.
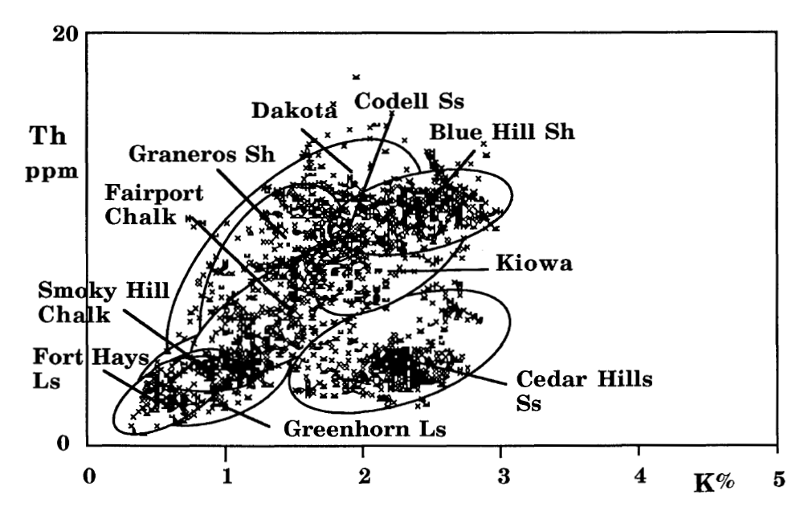
The cluster of points from the Cedar Hills Sandstone is clearly separated from Cretaceous zones and is readily interpreted as a quartz-feldspar-illite system. This aspect conforms very well with the petrography of this unit. as ranging from quartz arenite to lithic subarkose.
The Lower Cretaceous zones plot as a broader and more diffuse cloud, as would be expected for a mixed sequence of sandstones, siltstones and shales. However, the cloud is coincides with the kaolinite-smectite-illite range of Th/K ratios which, once again, shows good agreement with known petrography. The shales of the Lower Cretaceous are mostly a mixture of illite and kaolinite with subsidiary amounts of chlorite, smectite, and mixed-layer clays. Smectite becomes a major component in the overlying Graneros Shale.
Crossplot data from the Graneros Shale overlaps the Lower Cretaceous points. However, there is a distinctive bias towards higher Th/K ratios, which probably reflects the increased importance of smectite as a significant component. The source of much of the smectite can probably be attributed to bentonite (altered volcanic ash) horizons observed in this borehole. Other Upper Cretaceous units show a common trend of a slightly more potassium-rich ratio suggestive of a normal composition, dominated by illite.
The Thorium-to-Uranium (Th/U) Ratio
The thorium-uranium ratio (Th/U) has also proved to be useful in the recognition of "geochemical facies." The Th/U ratio is an indicator of redox-potential. Uranium has an insoluble tetravalent state that is fixed under reducing conditions, but is transformed to the soluble hexavalent state which may be mobilized into solution. In contrast, thorium has a single insoluble tetravalent state which is geochemically associated with uranium and is therefore a useful standard for comparison purposes.
In a pioneer paper, Adams and Weaver (1958), concluded that the Th/U ratio was often strongly linked with depositional environment, based on their laboratory analysis of many samples of differing lithologies. They suggested that when the ratio was computed to be less than two (i.e. uranium-rich), the depositional environment had promoted uranium fixation under probable reducing conditions, and was most commonly marine. By contrast, ratio values of greater than seven (uranium-poor), implied uranium mobilization through weathering and/or leaching, and therefore indicated an oxidizing, possibly terrestrial environment.
Th/K and Th/U Logs
The Th/K and Th/U ratios were also plotted as logs together with the gamma ray trace and a graphic lithology log from the description of drill cuttings. The simultaneous consideration of these data throughout the sequence reveals striking and readily interpretable patterns.
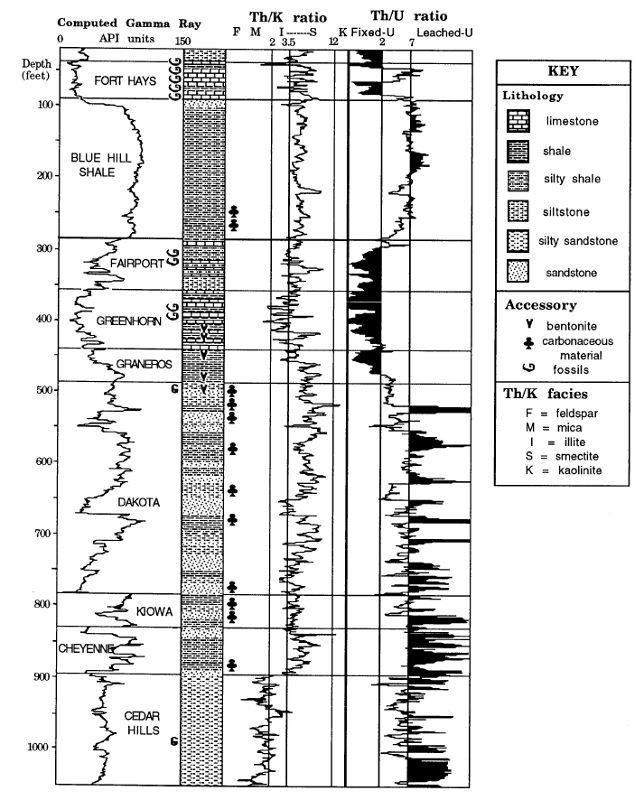
An abrupt shift occurs at the Cretaceous-Permian contact and highlights clearly the major basal Cretaceous unconformity. The illite-feldspar signature of the Cedar Hills Sandstone changes to a Lower Cretaceous trace which oscillates between illitic and kaolinitic clay minerals facies, possibly linked with marine and deltaic fresh-water environments, respectively.
Conglomerate at base of Cheyenne Sandstone
Kaolinitic clays are commonly found in the Dakota Formation and are of sufficient quality to be used in ceramics (Plummer and Romary, 1947). Observations in Dakota Formation outcrop and core show that kaolinite-rich horizons are often associated with seatearth developments.
Stacked Dakota paleosols overlain by Rocktown Channel Sandstone
The high amplitude variations in the Graneros Shale and Greenhorn Limestone may reflect the occurrence of bentonites (observed in the drill cuttings) interbedded with normal illitic marine shales. These bentonites represent altered ash deposits generated from explosive events from volcanoes in the Idaho-Montana and New Mexico-Arizona regions.
Greenhorn Limestone outcrop
The Th/U ratio log was indexed with the diagnostic values of 2 and 7 suggested by Adams and Weaver (1958) to aid depositional environment interpretation through its use as an oxidation potential indicator.
The ratio indicates an oxidizing environment for much of the Cedar Hills Sandstone, which would be expected from its postulated origin as eolian sands. Stacked repetitions of high and medium Th/U ratios characterize the Dakota Formation. These probably reflect high lateral variability in clastic facies and interplay between mostly brackish and fresh-water regimes of distributary channels, bays and marginal marine deposits, which would be expected to typify a delta complex.
Cedar Hills Sandstone outcrop
The relatively smooth, long-term cyclic pattern of the Th/U ratio in the marine sequence of the Upper Cretaceous is an excellent indicator of a large-scale transgression/regression couplet on an open marine shelf. The broad sine-wave feature conforms precisely with the outcrop interpretation of the Greenhorn Cycle as a classic example of a symmetric, third-order tectonoeustatic cycle (Glenister and Kauffman, 1985).
The transgressive phase of the cycle started in the uppermost part of the Dakota formation, continued through the Graneros Shale, and reached maximum development in the Greenhorn Limestone. The regressive hemicyclothem was initiated at the top of the Greenhorn and continued through the Fairport Chalk and Blue Hills Shale, to terminate in the Codell Sandstone. There is an abrupt break in the Th/U ratio log at the boundary between the Codell Sandstone and the overlying Fort Hays Limestone. This contact is thought to represent a long period of non-deposition followed by a major transgression (Hattin and Siemers, 1978). The ratio log shows this transgression clearly, but also indicates a distinctive regressive event at the top of the Fort Hays. This anomaly coincides closely with a similar peak on a Th/U log from a Colorado well observed by Zelt (1985), who attributed it to a regional warm water pulse or low salinity event suggested from oxygen isotope studies in the carbonate phase.
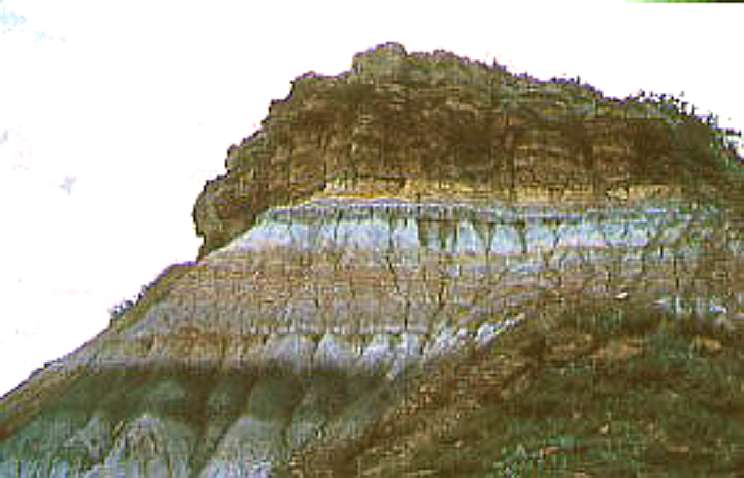
Blue Hills Shale outcrop
Codell Sandstone overlain by Fort Hays Limestone
The Smoky Hills Chalk at the top of the borehole succession is marked by a log ratio feature that indicates renewed transgression.
KUT: The Big Picture
A cartoon representation of the K, U, and Th flux in different weathering systems of an idealized basin-wide scale (Ruffel et al., 2003).
Fluxes of K, U, and Th may differ in both finer and grosser scale (e.g. the movement of Th in soil profiles or the global cycling of K through sea-water and authigenesis).
Prev Page--Digital Logs || Next Page--Nuclear Porosity Logs
Kansas Geological Survey
Updated July 31, 2017.
Comments to webadmin@kgs.ku.edu
The URL for this page is http://www.kgs.ku.edu/Publications/Bulletins/LA/03_gamma.html