Kansas Geological Survey, Open-file Report 94-28a
Part of the Mineral Intrusion Project: Investigation of Salt Contamination of Ground Water in the Eastern Great Bend Prairie Aquifer
A cooperative investigation by The Kansas Geological Survey and Big Bend Groundwater Management District No. 5
KGS Open File Report 94-28a
Released December, 1994
To read this report, you will need the Acrobat PDF Reader, available free from Adobe.
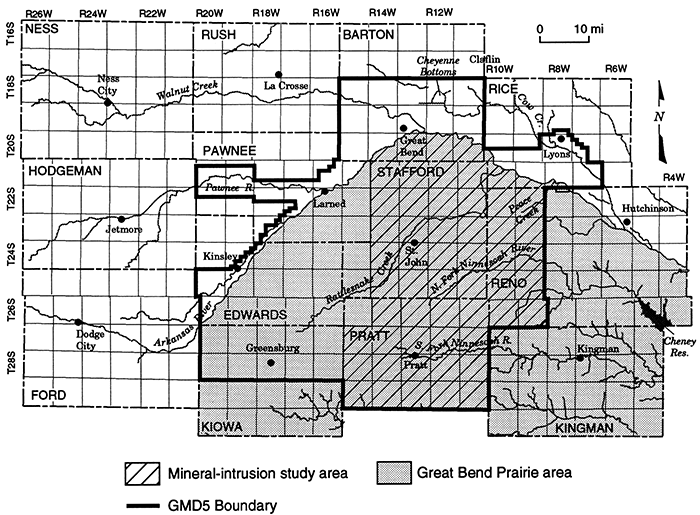
In the eastern part of Groundwater Management District No. 5 (GMD5), the groundwater found in the Great Bend Prairie aquifer is subject to natural salt contamination by brine that moves upward into the aquifer from deeper Permian bedrock formations. In some areas the water is unusably salty, and in some other locations the quality of the water shows signs of deteriorating as fresh water is pumped from the aquifer. In still other areas there is water of good quality, but it is not known how much can safely be used or how best to protect and manage it. Figure A1 shows the study area, which is the eastern portion of GMD5 where the Permian bedrock is in direct hydraulic connection with the Great Bend Prairie aquifer.
Figure A1--Major features in the region of Big Bend Groundwater Management District (GMD5) and location of the Mineral Intrusion study area.
In the past we have not been able to estimate the safe fresh water yield of the salt-affected aquifer, we have not had an accurate picture of the extent of the salt problem, and we have not had the understanding to predict how either groundwater pumping or natural changes might change the situation in the future. Because of this, public agencies and groundwater managers have not been able to develop plans or procedures that would both protect and permit beneficial use of the fresh groundwater in the area.
With funding from the Kansas Water Office and advice and review from the public and from agencies concerned with groundwater in the area, the Kansas Geological Survey and GMD5 have been working to describe the extent of existing saltwater contamination, determine how it changes over time, and identify the forces and conditions that control its behavior. The ultimate objective is practical, scientifically-based information on which to base plans, procedures, and a decision-support system for groundwater management in the area.
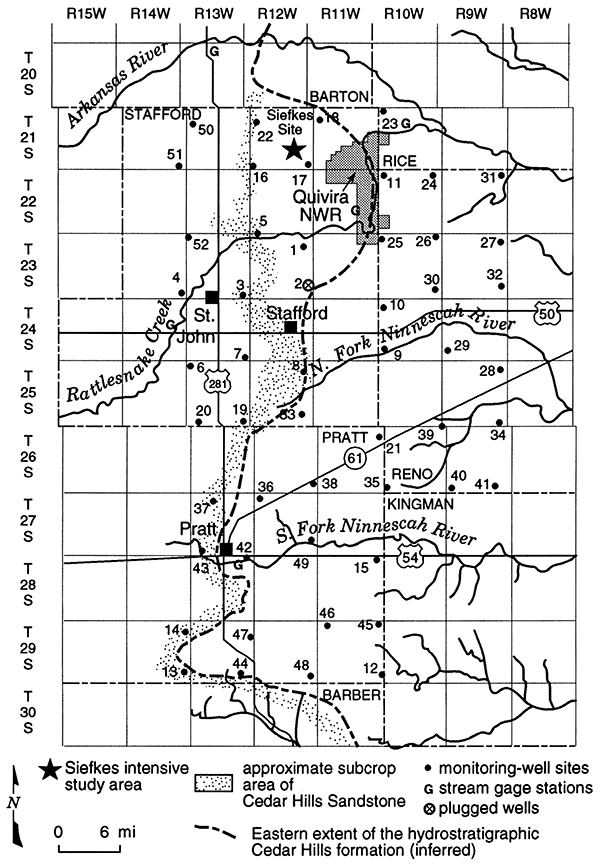
The study is using four approaches to developing the information needed: (1) compilation of existing data; (2) geophysical logging of the existing (50-site) monitoring well network to determine the elevation and characteristics of the salt-water interface and how it varies over time and space; (3) detailed studies--using logging, water level measurements, and chemical analysis--of the effects of pumping on water quality and the saltwater interface at the Siefkes intensive study site; and (4) a limited program of aquifer testing to better understand the hydrology of the salt-containing bedrock. Figure A2 shows the monitoring well network that is the primary source of data on salt distributions and bedrock characteristics.
Figure A2--Observation wells and other physical features in the area of the KGS/GMD5 monitoring-well network.
The information obtained from field studies is being used in descriptions, calculations, and computer modeling studies that will test and improve our ability to explain why conditions occur and how they are likely to change.
This report summarizes the findings of the study during Fiscal Year 1994 and provides an overview of project status and directions. The subjects addressed are discussed in more detail in the topical chapters, Open-File Reports 94-28b-g. A list of all of the previous reports and publication resulting wholly or in part from the Mineral Intrusion Project is found at the end of this report.
These reports are of the results of work in progress. The material presented in the OFR 94-28 series of reports is as complete and as accurate as possible within the constraints imposed by contractual reporting requirements. However, the reader should be aware that the interpretations and details of calculated results are subject to change over the further course of the project as new information becomes available.
Because the Mineral Intrusion project relies heavily on geophysical logging techniques, a major thrust of our research effort has been directed toward developing methods to interpret log signals in terms of interest to the study--the salinity of the groundwater and the salt inventory. Previous reports have addressed the issues of log correction and calibration in terms of chloride concentration.
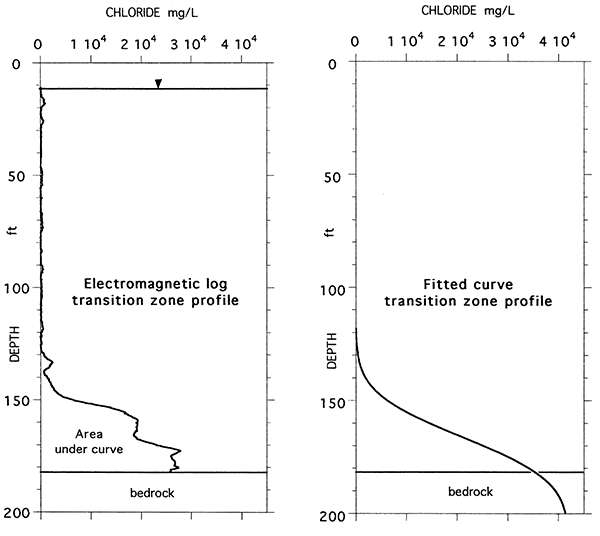
This report (OFR 94-28b) describes and applies two further key developments. One is the use of standard curves that are fitted to the chloride profiles derived from the logs. This has two purposes: one is to permit extrapolation of the transition zone profile to the salinity levels that are of concern to water users, and to compare changes over time at that level, and the other is to provide a mathematically objective set of parameters that can be used to compare different profiles and to test whether the observations fit a theoretical model. Figure A3 provides an example of a standard curve derived from an experimental profile,
Figure A3--Example of vertical chloride concentration profile derived from processing of electromagnetic induction log (left) compared to idealized, cumulative distribution function model fitted to log data (right). Area under log profile between water table and bedrock is used to determine the mass of chloride at each monitoring well site.
The second major development is the integration of the salt content represented by the chloride profiles to provide a total salt inventory and an average concentration for the water column. The former is used in budgetary calculation, and the latter is used to make density corrections to the groundwater heads, providing a much more accurate picture of the direction and possible rate of vertical flow.
Measurements of water levels, of salt inventories, and of the key reference parameters associated with the transition zone (for example the elevation of the 500 mg/L chloride level) provide a picture of the stability of the saline water system and its sensitivity to hydrologic changes. The results presented in OFR 94-28c indicate that although groundwater elevations changed significantly during 1993, the amount of salt in the Great Bend Prairie aquifer and the characteristics of most transition zones remained rather stable. This suggests that the saltwater can be treated as being in steady state, which greatly simplifies initial analysis.
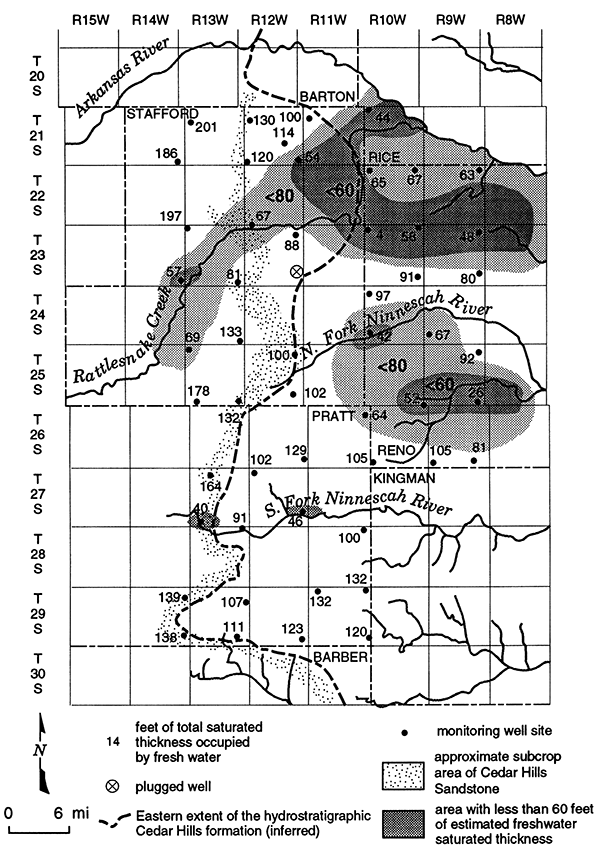
The combination of a reasonably stable saline water system and the transition zone characterization techniques described above now makes it possible to provide estimates of the distribution of freshwater resources in the salt-affected zones. Although the total saturated thicknesses in the northeastern part of the study area are generally 100-200', freshwater resources are much less, as is shown by Figure A4.
Figure A4--Saturated thickness occupied by fresh water (Cl < 500 mg/L) in the Great Bend Prairie aquifer (1994).
In spite of the relatively small amount of irrigation pumpage in 1993, the intensive study site revealed modest but systematic changes in the deep transition zone in response to irrigation pumping. These changes also corresponded to observed degradation in the quality of the pumped water, with the chloride concentration attributable to Permian brine increasing as the season progressed. These results indicate that local stresses can affect the distribution of salt, even though the larger-scale distribution patterns may be changing only slowly.
OFR 94-28d presents a compilation of new and historic determinations of Permian bedrock permeabilities, and of density-corrected vertical head gradients in the upper portion of the bedrock. Permeabilities range from about one to 0.001 feet per day, and core analyses show that vertical permeability is less than horizontal.
Density corrected heads indicate that most of the monitoring well sites have a head gradient that will favor upward flow from the Permian into the Great Bend Prairie aquifer. Upper-limit estimates of the rate of saltwater flux produce discharge values greater than or equal to estimated freshwater recharge values. The data base is too limited to make general conclusions at this time, but future work will need to focus on refining the flux measurements and determining whether they can be regionalized.
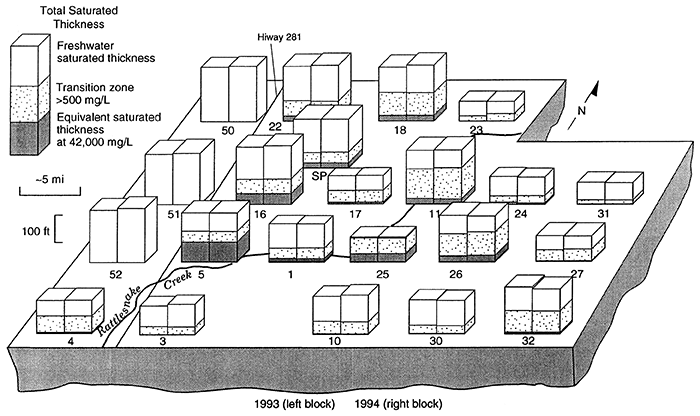
The integrated salt inventories discussed above have been recalculated as an equivalent saturated thickness of Permian brine, and the resulting distribution of total water, equivalent brine, and saline water for the northern part of the study area is shown in Figure A5. This set of results is particularly interesting, especially in its implication of a west-to-east decrease in total inventory. Part of that may be due to a preferential salt discharge source associated with the Cedar Hills Formation subcrop in the western part of the region, but budgetary analysis requires that the "lost" salt be leaving the study area through some means other than regional groundwater flow (such as surface discharge or bedrock channel flow)--or that the steady-state assumption is invalid and bedrock discharge has recently increased.
Figure A5--A representation of the total saturated thickness (height of column) and the saturated thickness that would be occupied by the volume of Permian brine equivalent to the salt content of the total water column (height of dark column). At each site, 1993 values are on the left, 1994 on the right. The height of 500 mg/L limit of the mixed zone is shown by light stippling; this has no budgetary significance, but shows the extent of vertical mixing and the amount of usable fresh water at each site.
OFR 94-28e discusses these issues, and also compares the budgetary approach with the saltwater flux estimates derived in OFR 94-28d. For both approaches--steady-state budgetary analysis and flux comparisons--detailed consideration of uncertainties and the implications of the results is presented.
Initial modeling efforts by Sophocleous and Chung (1993) were directed toward characterizing saltwater upconing under pumping stress, and led to the determination that three-dimensional simulation would be necessary for modeling the mineral intrusion system. The tool selected for simulation of the mineral intrusion processes is the SWIFT II three-dimensional finite-difference model. This has been developed for applications to simulation of both the local effects of irrigation well pumping, and regional effects at the scale of northern Stafford County.
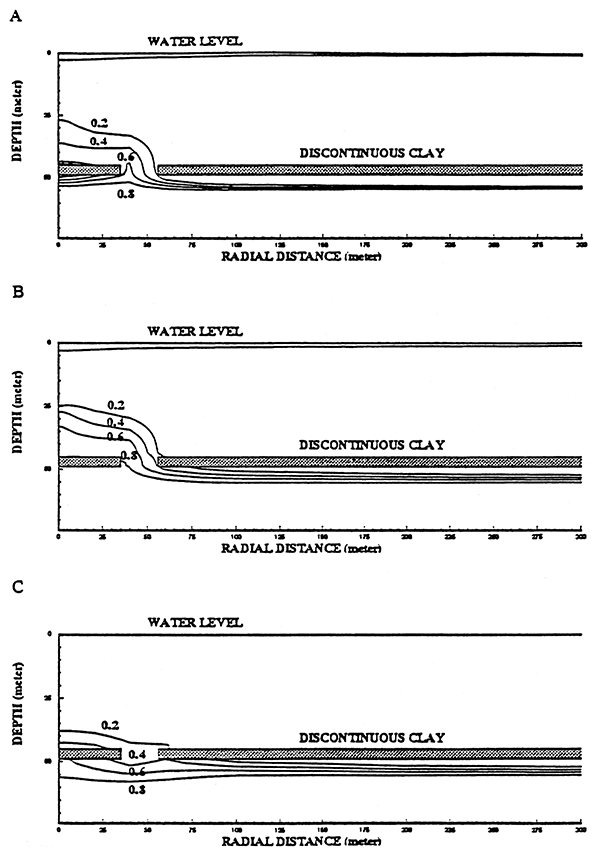
A model grid has been established that approximates conditions at the Siefkes intensive study site. By two-dimensional simulation of the changes under pumping stress of an initial sharp saltwater interface, the sensitivity of the model to various parameters has been evaluated and some initial results have been obtained. Figure A6 illustrates the results obtained by simulating the effects of pumping above a discontinuous clay layer, with an initial sharp salt interface (salt concentration = 1) below the clay. The concentration curves, expressed as a fraction of the initial salt concentration) are shown after 30 days of pumping, after 180 days of pumping, and after a year in which there was pumping only in the first 180 days.
Figure A6--A, Simulation result for case 3 at the 30th day's simulation. B, Simulation result for case 3 at the 180th day's simulation. C, Simulation result for case 3 at the 365th day's simulation.
At the regional scale, a model grid has been developed to simulate saltwater distribution and movement over the high salinity area of the lower Rattlesnake Creek basin. A great deal of effort has gone into data assembly. In the case of bedrock and water table elevation data, the model requires greater data density than is available from point measurements. Consequently, geostatistical techniques (kriging and cokriging) have been explored and applied to the problem of generating the needed surfaces from available data in a realistic fashion.
The methods and results of the SWIFT model application and the data development are described in detail in OFR 94-28f.
In addition, a series of analytical model calculational approaches have been developed and applied to aspects of the problem by Prof. Hillel Rubin while on sabbatical leave at the KGS. These approaches (represented by 6 reports or draft papers listed in the references) show particular promise for helping to understand and describe the processes controlling the formation of the saltwater transition zone over time, and for testing various conceptual hypotheses about the interaction of the two hydrologic systems. This work will continue during the remainder of Prof. Rubin's leave.
The results of the study to date have clear implications for monitoring of the salt water inventory and intrusion processes. The apparent stability of the saline transition zone means that changes are likely to be small or gradual, and that highly accurate and reproducible measurement will be required to detect them. The local responses to pumping, on the other hand, require frequent measurements during the pumping season if an accurate picture of the changes are to be obtained. The questions raised by the preliminary distribution, flux, and budget findings discussed underline the importance of a carefully-designed long-term monitoring program.
Groundwater Management District No. 5 has traditionally taken a conservative approach to water management in the salt-affected areas, as evidenced by the current moratorium on new appropriations in the northeastern portion of the district (a large portion of the area shown in Figure A5). We expect that the growing body of information will assist the GMD in developing appropriate management policies and procedures for the area, and cooperation in developing and applying relevant information will be a continued goal.
The Mineral Intrusion project continues to operate on schedule at the halfway point in its projected duration. The results reported in this series of reports mark the transition from a primarily measurement-oriented effort to an interpretive phase. Continued data collection will be required, but it will be focused much more sharply on the needs and issues raised by data analysis and model simulations.
As both conceptual and numerical models are developed, refined, and tested, increasing emphasis will be placed on the experimental design of continued monitoring and the information needed for water resource management.
A high priority for the coming year will be refinement of the salt budgets and inventories, and testing the conceptual models of the regional hydrogeochemistry based on these results. Concurrently, effort will be focused on measuring and modeling the responses of the saltwater interface to local irrigation pumping.
Buddemeier, R. W., M. A. Sophocleous and D. O. Whittemore, 1992. Mineral Intrusion: Investigation of Salt Contamination of Groundwater in the Eastern Great Bend Prairie Aquifer: Kansas Geological Survey, Open-File Report 92-25, 45 pp. [available online]
Buddemeier, R. W., G. Garneau, J. M. Healey, T.-S. Ma, M. A. Sophocleous, D. O. Whittemore, D. Young and D. Zehr, 1993. The Mineral Intrusion Project: report of progress during fiscal year 1993: Kansas Geological Survey, Open-File Report 93-23, 53 pp plus appendices.
Butler, J. J., W. Liu, and D. Young, 1993. Analysis of October 1993 slug tests in Stafford, Pratt, and Reno counties: Kansas Geological Survey, Open-File Report 93-52.
Garneau, G. W., and Buddemeier, R. W., 1992. Detection of the Saltwater Interface in the Great Bend Prairie Aquifer, South-Central Kansas, Using Focused Induction Conductivity Logging: Kansas Geological Survey, Open-File Report 92-43, 13 pp. [available online]
Rubin, H. and Buddemeier, R. W., 1966, Transverse Dispersion of Contaminants in Fractured Permeable Formations: Journal of Hydrology, vol. 176, issues 1-4, p. 133-151 [available online]
Rubin, H., and Buddemeier, R. W., 1996, A Top Specified Boundary Layer Approximation Approach for the Simulation of Groundwater Contamination Processes: Journal of Contaminant Hydrology, vol. 22, issues 1–2, p. 123–144 [available online]
Rubin, H., and Buddemeier, R. W., 1998, Application of the top specified boundary layer (TSBL) approximation to initial characterization of an inland aquifer mineralization: 1. Direct contact between fresh and saltwater: Journal of Contaminant Hydrology, vol. 32, issues 3-4, p. 353–376 [available online]
Rubin, H., and Buddemeier, R. W., 1998, Application of the top specified boundary layer (TSBL) approximation to initial characterization of an inland aquifer mineralization: 2. Seepage of saltwater through semi-confining layers: Journal of Contaminant Hydrology, vol. 32, issues 3-4, p. 377–402 [available online]
Rubin, H., 1994 Approximate Methods for the Simulation of Groundwater Contamination Processes: Kansas Geological Survey, Open-File Report 94-7. [available online]
Rubin, H., 1994 Numerical Schemes Applicable in Contaminant Hydrology Calculations: Kansas Geological Survey, Open-File Report 94-8. [available online]
Sophocleous, M. A., and Chung, C., 1993. Conceptual Simulations of Saltwater Upconing with the USGS SUTRA Model: Kansas Geological Survey, Open-File Report 93-39.
Whittemore, D.O., 1993. Ground-water geochemistry in the mineral intrusion area of Groundwater Management District No. 5, south-central Kansas, Kansas Geological Survey, Open-File Report 93-2. [available online]
Young, D. P., 1992. Mineral Intrusion: Geohydrology of Permian Bedrock Underlying the Great Bend Prairie Aquifer in South-Central Kansas: Kansas Geological Survey, Open-file Report 92-44, 47 pp. [available online]
Young, D. P., G. W. Garneau, R. W. Buddemeier, D. Zehr, and J. Lanterman, 1993. Elevation and variability of the freshwater-saltwater interface in the Great Bend Prairie aquifer, south-central Kansas: Kansas Geological Survey, Open-File Report 93-55.
Kansas Geological Survey, Geohydrology
Placed online Feb. 19, 2016; originally released Dec., 1994
Comments to webadmin@kgs.ku.edu
The URL for this page is http://www.kgs.ku.edu/Hydro/Publications/1994/OFR94_28a/index.html