Kansas Geological Survey, Open-file Report 93-2
Next page: Plates
With Special Acknowledgments to
Patrick M. Cobb, Long Beach, California;
Thomas McClain, Lawrence Hathaway, Karmie Galle, Truman Waugh, and Jian Fan,
Kansas Geological Survey;
Sharon Falk and Dan Zehr, Big Bend Groundwater Management District No. 5;
Ralph K. Davis, University of South Dakota; and
Edward T. Marks, Stafford, Kansas
KGS Open File Report 93-2
Released February, 1993
To read this report, you will need the Acrobat PDF Reader, available free from Adobe.
Areal Distribution of Salinity
Permian Bedrock
Aquifer Base
Upper Aquifer
Vertical Distribution of Salinity
Controls on Salinity Distribution
Identification of Salinity Sources
Oil-Field Brine Contribution to Chloride
Agricultural Contribution to Chloride
Temporal Variation in Salinity
Distribution and Variation of Nutrient Constituents
Appendix A. Chemical Properties of Observation Well Waters from the Permian Bedrock
Appendix D. Chemical Properties of Observation Well Waters from Near the Aquifer Base
Appendix G. Chemical Properties of Observation Well Waters from the Upper Aquifer
Saltwater from the underlying Permian bedrock naturally intrudes ground waters in the eastern portion of the unconsolidated aquifer in the Great Bend Prairie. The saline waters also discharge locally to streams in the area. In addition to the natural saltwater, there is concern that oil-field brines and agricultural activities have affected the water quality of the aquifer. A knowledge of the present distribution, concentration, and source of the saline waters and contaminated areas is necessary for preparing water-quality models of the region and for management of the ground-water resources to minimize salinity effects. This report addresses the issues of salinity sources, distribution, and variation, as well as the geochemistry of nutrient species such as nitrate in the mineral intrusion area. The report mainly concerns a geochemical analysis of water-quality data gathered for the observation well network installed as a cooperative effort between the Kansas Geological Survey and Big Bend Groundwater Management District.
The primary source of mineralized water in the Great Bend Prairie aquifer is dissolution of Permian evaporites, primarily halite (rock salt). Water quality in the Permian bedrock underlying the unconsolidated aquifer ranges from saltwater in the northwest and central portions of the observation well network to fresh in the southernmost area. The salinity of water in the bedrock appears to be related to bedrock channels and highs and to recharge and discharge zones in the overlying aquifer. The saline water in the lower part of the unconsolidated aquifer is derived from intrusion of saltwater from the Permian rocks. The distribution pattern of the saline water near the aquifer base indicates that saltwater intrusion occurs where Permian bedrock, especially the Cedar Hills Sandstone, underlies the aquifer. Cretaceous rocks in the western portion of the study area and zones of higher heads in the overlying aquifer restrict saltwater intrusion. The resulting area of saline water near the aquifer base is appreciably smaller than that for the Permian. Water in the upper part of the unconsolidated aquifer is generally fresh except in the northeastern portion of the observation well network. Saline water intrusion to the shallow aquifer is mainly controlled by discharge along streams, especially Rattlesnake Creek and parts of the South Fork of the Ninnescah River and the Arkansas River, and in the Big and Little Salt marshes.
The salinity of ground waters in the unconsolidated aquifer increases with depth, but at greatly different rates. Comparison of the chloride distribution patterns for the upper aquifer and aquifer base reveals areas with great contrasts in salinity. High contrast locations include north-central Stafford County, a band along the Stafford-Reno county line south from Peace Creek, and northeast and north-central Pratt County. Saltwater intrusion at the aquifer base in these areas has not appreciably dispersed into the middle to upper aquifer as a result of hydrogeologic conditions. These areas are expected to be especially vulnerable to upconing of saline waters pumped by irrigation wells screened in the lower aquifer.
The salinity of aquifer waters has been increased by local contamination from oil-field brines and agricultural activities. Identifiable contribution to ground-water salinity by oil brine was found in 8 wells at 6 of the 52 sites in the observation well network. The oil brine has affected the salinity of the mid to upper aquifer at 3 of these sites and the lower aquifer at the other 3 sites. However, the oil brine contamination has made aquifer water unusable at only one of the observation wells, and the existing natural chloride is too high for irrigation and drinking use in waters from 4 of the other wells. The results suggest that about 12 percent of the region within the network might be expected to have oil-brine contamination at some depth in the aquifer, because oil fields cover a substantial percentage of the network area in addition to the sites with contamination. The percentage could range widely, depending on whether an area is within or distant from an oil field.
Agricultural activities appear to have substantially increased the chloride concentration of ground water in the upper aquifer at 3 sites in the observation well network. The sites do not occur within oil fields. The increases in chloride are associated with nitrate contents that are higher than expected for background in the aquifer. Leaching of salts concentrated in soils by evapotranspiration of irrigation waters and from fertilizers appear to be a major source of the salinity and nitrate increases.
Background values for dissolved nitrate-N in the aquifer are typically less than 2 mg/L but can sometimes approach 4 mg/L. Nitrate concentrations in the ground water generally decrease with depth in the aquifer and from the aquifer to the bedrock. Upper aquifer waters at 5 network sites contained nitrate-N greater than 10 mg/L. Only one of the sites with nitrate-N above 10 mg/L had an identifiable increase in chloride from agricultural activities. Dissolved ammonium ion levels generally increase with depth in the aquifer and into the bedrock, reflecting more reducing conditions (lower dissolved oxygen) with depth. Although ammonium-N concentrations were below 1 mg/L in most of the bedrock wells, concentrations up to 4.8 mg/L indicate that the upper limit of natural dissolved nitrogen could be higher in the bedrock than in the lower aquifer. Oxidation of ammonium ion in the bedrock could be the source of much of the nitrate in bedrock and aquifer-base waters.
There is no clear direction in the chloride concentration variations for the region as a whole during the 1980's. Chloride concentrations were nearly constant at many network well sites, while many others had increases and/or decreases. Nitrate concentrations were either nearly constant or generally increased in the upper aquifer during the data period. The well sites with high nitrate tended to show increases. Chloride concentrations both increased and decreased in upper aquifer waters with nitrate concentrations above the background. The water-quality changes appear to be related more to the local site conditions than to the environment of the network region.
Patrick Cobb, formerly of the Kansas Geological Survey (KGS), initiated the original saltwater intrusion study in cooperation with the Big Bend Groundwater Management District (GMD5) and was involved in the installation of nearly all of the observation well network. Melvin Kleinschmidt was the KGS staff member who directed the drilling and installation of the wells. Thomas McClain of the KGS was also involved in the earlier phases of the study and assisted in some of the observation well sampling. Ralph Davis was the Manager of GMD5 during much of the sampling period for this study and participated in the cooperative research. Edward Marks was a staff member of the GMD5 at that time and also assisted in the research. Sharon Falk became the Manager of GMD5 after Ralph Davis left and continued the GMD5 participation in the study. Dan Zehr later joined the GMD5 staff and also assisted in the investigation. All of their work is greatly appreciated.
Lawrence Hathaway, Section Chief, Karmie Galle, and Truman Waugh of the Analytical Services Section of the KGS analyzed the observation well network samples. Jian Fan, a graduate research assistant, assisted in producing the plates by digitizing the chloride contours and preparing the plot files using the geographic information system ARC/INFO.
Robert Buddemeier, Section Chief, Marios Sophocleous, David Young, and Margaret Townsend in the Geohydrology Section of the Kansas Geological Survey reviewed all or parts of the report. The reviews of Gerald Hargadine of the Kansas Water Office and William Bryson of the Kansas Corporation Commission are also appreciated. I gratefully acknowledge the assistance of Anna Kraxner, Secretary for the KGS Geohydrology Section, in formatting the tables and assembling the final report pages, and Mark Schoneweis, also in the Geohydrology Section, for drafting selected figures.
This report describes the chemical character and origin of dissolved constituents in ground waters of the eastern part of Big Bend Groundwater Management District No. 5 (GMD5), where mineral intrusion affects water quality (Figure 1). Saltwater from the underlying Permian bedrock naturally intrudes ground waters in the eastern portion of the unconsolidated aquifer in the Great Bend Prairie. The saline waters also discharge locally to streams in the area. There is a concern that changes in the water balance in the system, such as freshwater withdrawals and climatic variations, could increase the intrusion of saltwater into the system.
Figure 1--Major features in the region of Big Bend Groundwater Management District (GMD5) and location of the study area.
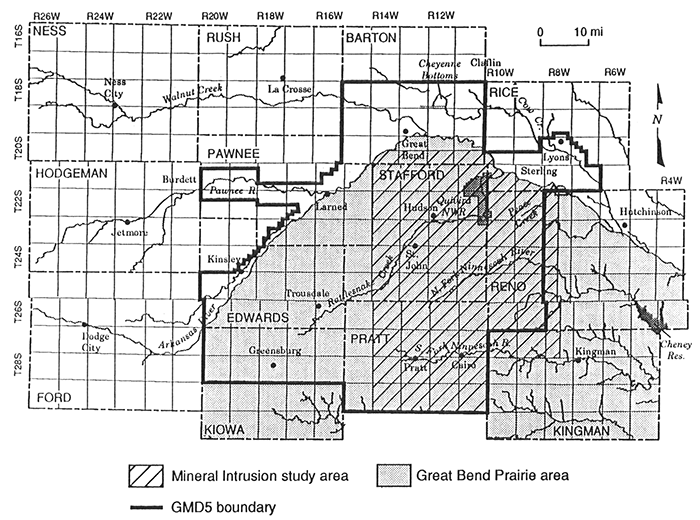
For example, the pumping rates of water wells in the area could be great enough to cause long-term water-table declines in the aquifer. This could increase the upward flow and dispersion of saltwater into fresh ground waters. In addition to the natural saltwater, oil-field brines have caused pollution in some locations. In other cases, evaporative concentration of irrigation waters may have increased the salinity of soil moisture that is leached to the water table under recharge conditions.
A knowledge of the present distribution, concentration, and source of the saline waters and contaminated areas is necessary for preparing water-quality models of the area and for management of the ground-water resources to minimize salinity effects. In addition to salinity problems, there is concern for the concentration and distribution of other chemical constituents in the ground waters, both those that affect water uses and that are contaminants from agricultural and industrial activities.
The objectives of this study were (1) determine the areal and vertical distribution of saltwater in the unconsolidated aquifer and the uppermost portion of the underlying bedrock in the eastern half of GMD5; (2) determine the geochemical characteristics of the ground waters including areal and vertical changes and natural versus anthropogenic sources of contamination; and (3) explain the origin of the saltwater distribution by correlating the chemical characteristics of the natural waters with the hydrogeology of the system.
Multi-level observation wells were constructed at 52 sites in Stafford County, northern Pratt County, western Reno County, and the southwestern corner of Rice County in GMD5. The wells were constructed by the Kansas Geological Survey (KGS) and GMD5 from 1979 to 1987. The District employed a commercial water-well driller to drill the several wells not installed by the KGS. The well network was designed to have sites as near as practicable to township corners to comprise a grid with approximately six mile separations between sites in the north-south and east-west directions (Figure 2). The sites were numbered in order of installation date. The boundaries delineated by Figure 2 comprise the study area for this report and coincide with the area shown in Plates 1-3 that display the distribution of chloride in the Permian bedrock and upper and lower unconsolidated aquifer.
Figure 2--Locations and site numbers for the KGS/GMD5 monitoring-well network.
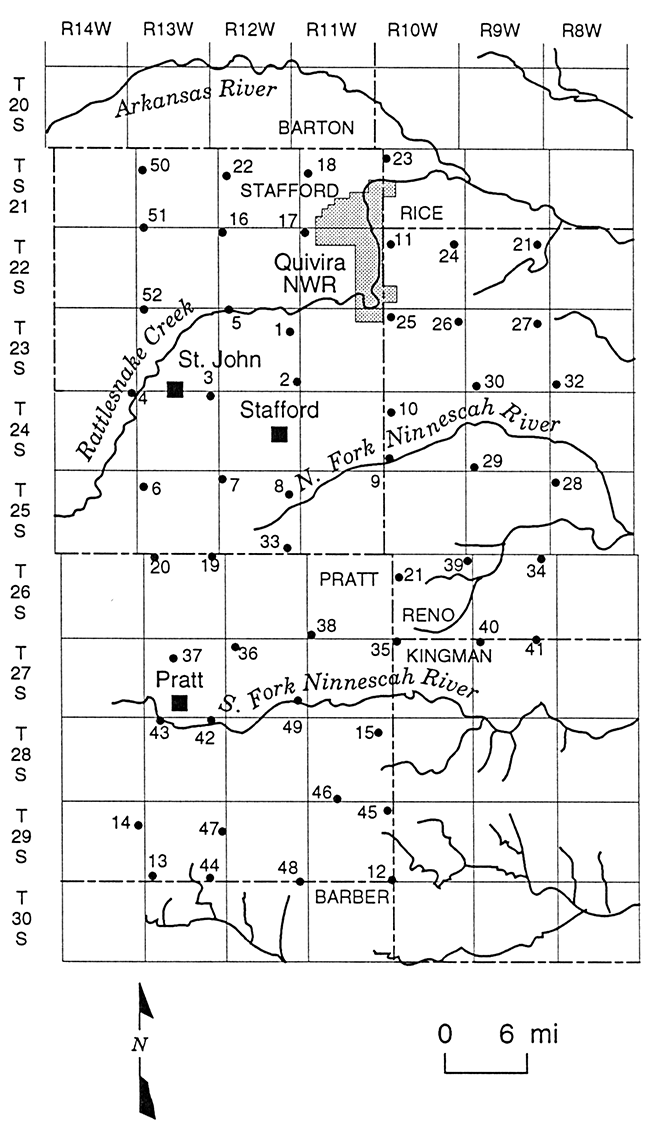
Three wells were drilled at most of the sites. One of the 3 wells is screened in the Permian bedrock, the second in the lower aquifer commonly at or near the base of the aquifer, and the third in the middle to upper part of the aquifer (Table 1). These are referred to as the bedrock, aquifer-base, and upper-aquifer observation wells in the text of this paper, respectively. There are 47 sites with bedrock wells, 47 sites with aquifer-base wells, and 51 sites with wells in the upper aquifer. At 7 sites, only two wells were installed, while at a few other sites, one of the wells could not serve as a sampling point due to insufficient yield. Four multi-level wells were constructed at 7 sites to allow more detailed determination of the salinity change with depth. The additional well at these sites is screened approximately in the middle of the aquifer and is referred to as the intermediate well while the uppermost well is referred to as the shallow well. One of the 3 most recently constructed sites, number 50, also includes an intermediate level well. None of the most recent sites, numbers 50-52, contains a bedrock well.
The depth to bedrock ranges from 34 to 258 ft at the sites in the network (Table 1). The top of the screened interval of the bedrock wells ranges from the bedrock-aquifer interface to 80 ft below the interface. All the bedrock wells were drilled to and screened in Permian strata. The wells drilled to the greater depths below the bedrock-aquifer interface are in the west-central part of the network and penetrate Cretaceous rocks to reach the Permian. The screened intervals are generally 5 ft in length and range from 3 to 20 ft depending on the character of the bedrock and the construction of the well. Several of the bedrock wells have two-inch diameter casing and screen within the bedrock. The PVC casing and screen for the rest of these wells and all other wells are 5 inch diameter. Screened intervals for most of the Quaternary aquifer wells is 5 ft, with a range of 3-10 ft. Wells were sealed using cement grout.
Table 1--Site elevations, well depths, and approximate water-level elevation for the observation well network The depth to bedrock has been corrected from the original field value using geophysical gamma logs (Rosner, 1988)
| Site | Location | Ground- surface elevation |
Depth to bedrock |
Depths of screened interval | Elevation of bedrock surface |
Elevation of water table from map |
|||
|---|---|---|---|---|---|---|---|---|---|
| Well 1 | Well 2 | Well 3 | Well 4 | ||||||
| 1 | 235 12W 12BAAA | 1827 | 146 | 146-149 | 106-110 | 36-40 | 1681 | 1821 | |
| 2 | 235 12W 36ABAB | 1837 | 96 | 99-104 | 35-38 | 1741 | 1829 | ||
| 3 | 235 13W 36DCCC | 1898 | 130 | 120-140 | 65-75 | 1768 | 1881 | ||
| 4 | 235 14W 36DDCD | 1912 | 129 | 217-227 | 106-112 | 53-58 | 1783 | 1906 | |
| 5 | 235 12W 06BBBA | 1855 | 181 | 193-198 | 92-102 | 40-50 | 1674 | 1850 | |
| 6 | 255 13W 06BCBC | 1950 | 148 | 216-226 | 135-145 | 60-70 | 1802 | 1940 | |
| 7 | 245 13W 36DDDD | 1906 | 150 | 230-250 | 150-154 | 56-64 | 1756 | 1897 | |
| 8 | 255 12W 11AAAD | 1848 | 117 | 237-257 | 116-122 | 87-92 | 46-50 | 1731 | 1839 |
| 9 | 245 10W 31CBCB | 1755 | 87 | 86-91 | 62-65 | 38-43 | 1668 | 1737 | |
| 10 | 245 10W 06DCCC | 1790 | 156 | 160-165 | 143-148 | 100-105 | 74-79 | 1634 | 1776 |
| 11 | 225 10W 06CBBB | 1763 | 208 | 237-241 | 61-66 | 1555 | 1750 | ||
| 12 | 295 11W 36ACCC | 1770 | 142 | 166-171 | 130-136 | 60-70 | 1628 | 1760 | |
| 13 | 295 14W 36AAAD | 1905 | 172 | 182-188 | 120-124 | 53-58 | 1733 | 1868 | |
| 14 | 295 14W 12ABBB | 1989 | 238 | 280-285 | 223-228 | 115-120 | 1751 | 1887 | |
| 15 | 285 11W 01AAAD | 1725 | 128 | 135-140 | 116-120 | 57-62 | 1597 | 1690 | |
| 16 | 215 12W 31CCCB | 1873 | 220 | 243-248 | 198-203 | 80-85 | 1653 | 1865 | |
| 17 | 215 12W 36DDCC | 1795 | 114 | 129-134 | 102-107 | 41-46 | 1681 | 1775 | |
| 18 | 215 11W 07BBBA | 1810 | 214 | 231-236 | 197-202 | 45-50 | 1596 | 1795 | |
| 19 | 255 13W 36DCCC | 1902 | 163 | 180-185 | 145-150 | 42-48 | 1739 | 1891 | |
| 20 | 255 13W 31DDAA | 1960 | 198 | 221-226 | 189-194 | 46-51 | 1762 | 1948 | |
| 21 | 265 11W 01DDDA | 1801 | 137 | 145-150 | 113-118 | 43-48 | 1664 | 1776 | |
| 22 | 215 12W 06CCBC | 1855 | 215 | 231-236 | 206-211 | 35-45 | 1640 | 1850 | |
| 23 | 215 10W 06AADD | 1743 | 94 | 122-127 | 79-84 | 44-49 | 1649 | 1722 | |
| 24 | 225 10W 01ADBC | 1736 | 123 | 131-136 | 86-91 | 1613 | 1719 | ||
| 25 | 235 10W 06BBAB | 1780 | 110 | 120-124 | 95-100 | 44-49 | 1670 | 1777 | |
| 26 | 235 10W 01AAAA | 1738 | 177 | 190-195 | 118-123 | 60-65 | 1561 | 1731 | |
| 27 | 235 09W 01ADAA | 1685 | 104 | 115-120 | 60-65 | 30-35 | 1581 | 1678 | |
| 28 | 255 09W 01ADDA | 1668 | 114 | 125-130 | 85-90 | 35-40 | 1554 | 1632 | |
| 29 | 245 10W 36AAAA | 1731 | 150 | 176-181 | 120-125 | 62-65 | 1581 | 1689 | |
| 30 | 235 10W 36DAAA | 1750 | 134 | 155-160 | 123-128 | 60-65 | 1616 | 1730 | |
| 31 | 225 09W 01ADAA | 1665 | 93 | 108-113 | 85-90 | 55-60 | 1572 | 1650 | |
| 32 | 235 09W 25DDDD | 1689 | 172 | 189-194 | 161-166 | 113-118 | 78-83 | 1517 | 1680 |
| 33 | 255 12W 36CBBA | 1872 | 141 | 157-162 | 137-142 | 78-83 | 1731 | 1840 | |
| 34 | 255 09W 36DDCC | 1653 | 34 | 48-53 | 29-34 | 1619 | 1602 | ||
| 35 | 265 10W 31CCCB | 1760 | 153 | 168-173 | 150-155 | 66-71 | 1607 | 1751 | |
| 36 | 275 12W 06BAAB | 1892 | 195 | 210-215 | 191-196 | 146-151 | 85-90 | 1697 | 1869 |
| 37 | 275 13W 05CABB | 1971 | 238 | 255-260 | 235-240 | 151-156 | 82-87 | 1733 | 1919 |
| 38 | 265 12W 36ADDA | 1844 | 189 | 204-209 | 187-192 | 80-85 | 1655 | 1814 | |
| 39 | 265 10W 01AAAA | 1679 | 55 | 73-78 | 53-58 | 15-20 | 1624 | 1667 | |
| 40 | 265 09W 31CDDD | 1735 | 158 | 176-181 | 156-161 | 97-102 | 1577 | 1680 | |
| 41 | 265 09W 35ADAD | 1654 | 83 | 98-103 | 78-83 | 29-34 | 1571 | 1650 | |
| 42 | 285 13W 01CBAA | 1829 | 160 | 178-183 | 157-162 | 103-108 | 1669 | 1814 | |
| 43 | 275 13W 31DDDD | 1872 | 65 | 88-93 | 40-45 | 1807 | 1870 | ||
| 44 | 29S 13W 35ABBA | 1891 | 186 | 203-208 | 173-178 | 121-126 | 78-83 | 1705 | 1830 |
| 45 | 295 11W 01DADA | 1795 | 178 | 192-197 | 150-155 | 85-90 | 1617 | 1754 | |
| 46 | 295 11W 06AAAB | 1830 | 177 | 195-200 | 164-169 | 78-83 | 1653 | 1800 | |
| 47 | 295 13W 12ABBA | 1900 | 177 | 188-193 | 158-163 | 82-87 | 1723 | 1828 | |
| 48 | 295 12W 36DCCD | 1842 | 178 | 187-192 | 162-167 | 114-119 | 1664 | 1788 | |
| 49 | 275 12W 35AAAA | 1737 | 106 | 116-121 | 89-94 | 51-56 | 27-32 | 1631 | 1730 |
| 50 | 215 13W 06BCCC | 1912 | 223 | 190-195 | 120-125 | 45-50 | 1689 | 1895 | |
| 51 | 215 14W 36DDDA | 1915 | 200 | 170-175 | 95-100 | 1715 | 1913 | ||
| 52 | 235 13W 06BBBC | 1920 | 221 | 195-200 | 97-102 | 1699 | 1905 | ||
Water samples were collected from the multiple-level wells in the observation well network by the KGS and GMD5. A few casing volumes were pumped from each well to remove any remaining drilling fluid and sediment in the well to provide representative samples. Specific conductance and temperature were monitored during pumping at many sites to help determine when waters representative of the screened interval could be collected. In several cases, flow rates of wells screened in bedrock of relatively low permeability were so slow that only one casing volume could be removed at one time. Some of these wells yielded samples for which high laboratory pH (values above 9 units) indicated that the water pumped was affected by the cement grouting. These wells were resampled until the pH fell to or below 8.5 units. Results with very high pH values were discarded, although values for selected constituents such as chloride and sulfate were retained for samples with pH's less than 10.
Most of the chemical data in this report were determined in the laboratories of the KGS in Lawrence. Samples for determination of chemical properties and inorganic constituents were collected in polyethylene bottles and refrigerated in an ice chest in the field and transferred to a refrigerator after transportation to the laboratory. Samples in which phosphate and nitrogen species were determined were preserved in the field with 2 mL of 6M redistilled HCl. Samples were kept refrigerated until analysis. Charge-balance errors were less than 3 percent for most samples and less than 5 percent for nearly all samples. The larger balance errors were for samples containing relatively small concentrations of total-dissolved solids.
Other chemical data included were determined in the office laboratory of GMD5. The GMD5 analyses include chloride, nitrate, and sulfate concentrations determined using a Hach spectrophotometer and analysis kits. Samples for these analyses were usually refrigerated in the field and office before analysis. Chloride, sulfate, and nitrate were determined by the KGS on 14, 10, and 7 of the same samples, respectively, analyzed by the Groundwater Management District. The average difference between the chloride, sulfate, and nitrate determinations of the Survey and the District are 17, 19, and 20 percent, respectively. Most of the Groundwater Management District values were higher than those of the KGS. The maximum estimated error in the chloride, sulfate, and nitrate determinations of the KGS are 3, 5, and 5 percent, respectively, for concentrations more than an order of magnitude greater than the detection limit. The maximum average error in the GMD5 values are about 20 percent for the 3 constituent determinations.
There is also the possibility that some of the differences between the GMD5 and KGS values are not analytical, but due to sampling. As indicated in the section on variations in salinity below, changes in constituent concentrations could have occurred during pumping due to mixing of waters of differing quality, Assuming that the duplicate samples analyzed by both the KGS and the GMD were collected one after another rather than split from the same sample, some of the differences may be real. The analytical error in the determinations of the District are on the same order as those of many commercial laboratories (Whittemore, 1983). The analyses of the District are good enough to serve their intended purpose, i.e., to determine general water quality and detect substantial changes in constituent concentrations.
The plates illustrating the chloride distribution were produced by first plotting the well network and other available chloride data on a study area map. The isochlors on the plates were hand drawn and considered the chloride point data and the hydrogeology of the study region. The contours were digitized and the digital data processed using the geographic information system software ARC/INFO on a Data General computer. The maps were printed with a Calcomp electrostatic plotter.
The unconsolidated aquifer of the Great Bend Prairie consists of alluvial sands and gravels with interbedded silts and clays deposited by the ancestral Arkansas River. The age of most of the sediment is Quaternary, although some Tertiary deposits probably also occur in the subsurface (Fader and Stullken, 1978). The regional flow in the aquifer is to the east, the same direction as the general topographic slope. Locally, the aquifer waters discharge to streams, including Rattlesnake Creek and the North Fork and South Fork of the Ninnescah River.
The thickness of the unconsolidated sediments underlying the study area range considerably. Thicknesses are generally greatest in valleys cut into the underlying bedrock. In general, the more permeable sand and gravel layers occur in the middle to lower portions of the aquifer, as is typical for most alluvial deposits in Kansas. Discontinuous lenses of low-permeability clays retard both the downward and upward vertical movement of water in the system. Reports describing aspects of the aquifer hydrogeology of the area include Fader and Stullken (1978), Cobb (1980), and Sophocleous and McAllister (1990).
Bedrock underling the unconsolidated aquifer consists of sandstone, siltstone, and shale and is of Cretaceous age in the western part of the study area and Permian in the east (Figure 3). Portions of the Permian red beds contain salt beds or are salt-cemented. Dissolution of the salt has resulted in saltwaters in the bedrock, the source of the natural mineral intrusion to the overlying alluvial aquifer and streams. A descriptive review of the Permian bedrock and its hydrologic relation to the overlying Great Bend Prairie aquifer was written as part of the Mineral Intrusion Study (Young, 1992).
Summaries of the major chemical characteristics for the bedrock, aquifer base, and upper aquifer observation wells are in Tables 2, 3, and 4, respectively; complete sample results for the KGS analyses are in Appendices A-C, D-F, and G-I, respectively. Additional sample results from GMD5 are in Appendix J. A general summary of the ranges for all the constituents determined at the 3 different well depths is given in Table 5.
Figure 3--A. Bedrock geology underlying beneath the Great Bend Prairie aquifer and areas in which the Permian formation has the potential to contribute salt water to the overlying aquifer (adapted from Fader and Stullken, 1978). B. Vertical section from west to east across the region, showing the relation of the alluvial Great Bend Prairie aquifer to the underlying Cretaceous and Permian formations (adapted from Latta, 1950).
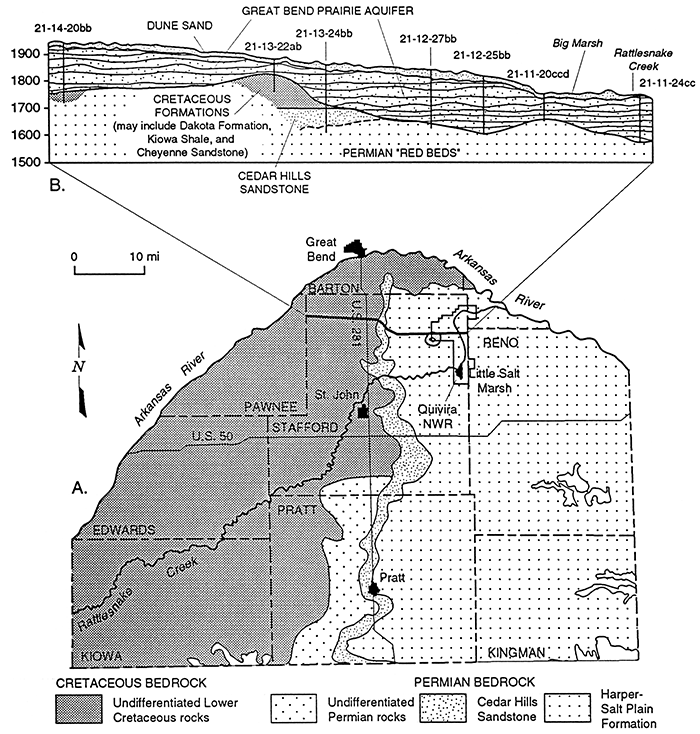
Table 2--Major chemical characteristics of waters from the bedrock observation wells.
| Site-well | Location | Sp.C. µS/cm |
Chloride mg/L |
Water Type |
|---|---|---|---|---|
| 1-1 | 23S 12W 12BAAA | 36900 | 13200 | Na-Cl |
| 2-1 | 23S 12W 36ABAB | 2630 | 725 | Na-Cl |
| 4-1 | 23S 14W 36DDCD | 77600 | 31000 | Na-Cl |
| 5-1 | 23S 12W 06BBBA | 85500 | 41200 | Na-Cl |
| 6-1 | 25S 13W 06BCBC | 102000 | 42640 | Na-Cl |
| 7-1 | 24S 13W 36DDDD | 75900 | 34200 | Na-Cl |
| 8-1 | 25S 12W 11AAAD | 106000 | 43800 | Na-Cl |
| 9-1 | 24S 10W 31CBCB | 10700 | 3280 | Na-Cl |
| 10-1 | 24S 10W 06DCCC | 6230 | 1710 | Na-Cl |
| 11-1 | 22S 10W 06CBBB | 66900 | 25000 | Na-Cl |
| 12-1 | 29S 11W 36ACCC | 680 | 79 | Na,Ca-HCO3,Cl |
| 13-1 | 29S 14W 36AAAD | 443 | 23 | Ca-HCO3 |
| 14-1 | 29S 14W 12ABBB | 640 | 34 | Ca-HCO3 |
| 15-1 | 28S 11W 01AAAD | 2130 | 466 | Na-Cl |
| 16-1 | 21S 12W 31CCCB | 88500 | 34800 | Na-Cl |
| 17-1 | 21S 12W 36DDCC | 28900 | 9880 | Na-Cl |
| 18-1 | 21S 11W 07BBBA | 35200 | 12200 | Na-Cl |
| 19-1 | 25S 13W 36DCCC | 995 | 192 | Na,Ca-Cl,HCO3 |
| 20-1 | 25S 13W 31DDAA | 17400 | 5200 | Na-Cl |
| 21-1 | 26S 11W 01DDDA | 35100 | 11700 | Na-Cl |
| 22-1 | 21S 12W 06CCBC | 82600 | 32500 | Na-Cl |
| 23-1 | 21S 10W 06AADD | 21300 | 6480 | Na-Cl |
| 24-1 | 22S 10W 01ADBC | 6310 | 1820 | Na-Cl |
| 25-1 | 23S 10W 06BBAB | 41000 | 17400 | Na-Cl |
| 26-1 | 23S 10W 01AAAA | 37100 | 13470 | Na-Cl |
| 27-1 | 23S 09W 01ADAA | 6510 | 1841 | Na-Cl |
| 28-1 | 25S 09W 01ADDA | 3560 | 890 | Na-Cl |
| 29-1 | 24S 10W 36AAAA | 60000 | 22000 | Na-Cl |
| 30-1 | 23S 10W 36DAAA | 8000 | 2410 | Na-Cl |
| 31-1 | 22S 09W 01ADAA | 6520 | 1771 | Na-Cl |
| 32-1 | 23S 09W 25DDDD | 7150 | 1864 | Na-Cl |
| 33-1 | 25S 12W 36CBBA | 4250 | 1160 | Na-Cl |
| 34-1 | 25S 09W 36DDCC | 635 | 74 | Ca-HCO3 |
| 35-1 | 26S 10W 31CCCB | 21400 | 6750 | Na-Cl |
| 36-1 | 27S 12W 06BAAB | 56800 | 21800 | Na-Cl |
| 37-1 | 27S 13W 05CABB | 7700 | 2310 | Na-Cl |
| 38-1 | 26S 12W 36ADDA | 6910 | 1908 | Na-Cl |
| 39-1 | 26S 10W 01AAAA | 36300 | 12300 | Na-Cl |
| 40-1 | 26S 09W 31CDDD | 2720 | 663 | Na-Cl |
| 41-1 | 26S 09W 35ADAD | 5460 | 1460 | Na-Cl |
| 42-1 | 28S 13W 01CBAA | 15500 | 4900 | Na-Cl |
| 43-1 | 27S 13W 31DDDD | 7500 | 2198 | Na-Cl |
| 44-1 | 29S 13W 35ABBA | 238 | 23 | Na,Ca-Cl,SO4 |
| 45-1 | 29S 11W 01DADA | 810 | 113 | Na-HCO3 |
| 46-1 | 29S 11W 06AAAB | 1460 | 313 | Na-Cl |
| 47-1 | 29S 13W 12ABBA | 510 | 31 | * |
| 48-1 | 29S 12W 36DCCD | 453 | 33 | Na-HCO3 |
| 49-1 | 27S 12W 35AAAA | 84800 | 32700 | Na-Cl |
| * No complete analysis for sample | ||||
Table 3--Major chemical characteristics of waters from the aquifer-base observation wells.
| Site-well | Location | Sp.C. µS/cm |
Chloride mg/L |
Water Type |
|---|---|---|---|---|
| 1-2 | 23S 12W 12BAAA | 7000 | 1980 | Na-Cl |
| 3-1 | 23S 13W 36DCCC | 1590 | 361 | Na-Cl |
| 4-2 | 23S 14W 36DDCD | 3320 | 869 | Na-Cl |
| 5-2 | 23S 12W 06BBBA | 55700 | 20700 | Na-Cl |
| 6-2 | 25S 13W 06BCBC | 1730 | 396 | Na-Cl |
| 7-2 | 24S 13W 36DDDD | 991 | 159 | Na-Cl,HCO3 |
| 8-2 | 25S 12W 11AAAD | 1420 | 287 | Na-Cl |
| 9-2 | 24S 10W 31CBCB | 5040 | 1480 | Na-Cl |
| 10-2 | 24S 10W 06DCCC | 4900 | 1340 | Na-Cl |
| 12-2 | 29S 11W 36ACCC | 320 | 8 | Ca-HCO3 |
| 13-2 | 29S 14W 36AAAD | 395 | 13 | Ca-HCO3 |
| 14-2 | 29S 14W 12ABBB | 375 | 21 | Ca,Na-HCO3 |
| 15-2 | 28S 11W 01AAAD | 1400 | 318 | Ca,Na-Cl |
| 16-2 | 21S 12W 31CCCB | 79100 | 30800 | Na-Cl |
| 17-2 | 21S 12W 36DDCC | 26000 | 8750 | Na-Cl |
| 18-2 | 21S 11W 07BBBA | 30900 | 10700 | Na-Cl |
| 19-2 | 25S 13W 36DCCC | 1390 | 300 | Na-Cl |
| 20-2 | 25S 13W 31DDAA | 1220 | 230 | Na-Cl |
| 21-2 | 26S 11W 01DDDA | 8020 | 2320 | Na-Cl |
| 22-2 | 21S 12W 06CCBC | 68900 | 26200 | Na-Cl |
| 23-2 | 21W 10W 06AADD | 5150 | 1020 | Na-Cl |
| 25-2 | 23S 10W 06BBAB | 65100 | 24900 | Na-Cl |
| 26-2 | 23S 10W 01AAAA | 34500 | 12360 | Na-Cl |
| 27-2 | 23S 09W 01ADAA | 2800 | 719 | Na-Cl |
| 28-2 | 25S 09W 01ADDA | 758 | 135 | Na-Cl,HCO3 |
| 29-2 | 24S 10W 36AAAA | 1620 | 445 | Na-Cl |
| 30-2 | 23S 10W 36DAAA | 1710 | 362 | Na-Cl |
| 31-2 | 22S 09W 01ADAA | 2350 | 518 | Na-Cl |
| 32-2 | 23S 09W 25DDDD | 5300 | 1476 | Na-Cl |
| 33-2 | 25S 12W 36CBBA | 1980 | 467 | Na-Cl |
| 34-2 | 25S 09W 36DDCC | 402 | 4 | Ca-HCO3 |
| 35-2 | 26S 10W 31CCCB | 2670 | 689 | Na-Cl |
| 36-2 | 27S 12W 06BAAB | 46600 | 16850 | Na-Cl |
| 38-2 | 26S 12W 36ADDA | 6620 | 1834 | Na-Cl |
| 39-2 | 26S 10W 01AAAA | 930 | 158 | Na,Ca-Cl,HCO3 |
| 40-2 | 26S 09W 31CDDD | 1610 | 319 | Na-Cl |
| 41-2 | 26S 09W 35ADAD | 879 | 148 | Na-Cl,HCO3 |
| 42-2 | 28S 13W 01CBAA | 14200 | 4470 | Na-Cl |
| 44-2 | 29S 13W 35ABBA | 400 | 16 | Ca-HCO3 |
| 45-2 | 29S 11W 01DADA | 477 | 14 | Ca-HCO3 |
| 46-2 | 29S 11W 06AAAB | 610 | 61 | Na-HCO3 |
| 47-2 | 29S 13W 12ABBA | 470 | 35 | Ca,Na-HCO3 |
| 48-2 | 29S 12W 36DCCD | 309 | 9 | Ca,Na-HCO3 |
| 49-2 | 27S 12W 35AAAA | 3830 | 1064 | Na-Cl |
| 50-1 | 21S 13W 06BCCC | 1040 | 158 | * |
| 51-1 | 21S 14W 36DDDA | 4980 | 1350 | Na-Cl |
| 52-1 | 23S 13W 06BBBC | 940 | 155 | Na,Ca-Cl,HCO3 |
| * No complete analysis for sample | ||||
Table 4--Major chemical characteristics of waters from the upper-aquifer observation wells.
| Site-well | Location | Sp.C. µS/cm |
Chloride mg/L |
Water Type |
|---|---|---|---|---|
| 1-3 | 23S 12W 12BAAA | 410 | 14 | Ca-HCO3 |
| 2-2 | 23S 12W 36ABAB | 1020 | 127 | Ca,Na-HCO3,Cl |
| 3-2 | 23S 13W 36DCCC | 578 | 46 | Ca,Na-HCO3 |
| 4-3 | 23S 14W 36DDCD | 1000 | 165 | Na,Ca-HCO3,C1 |
| 5-3 | 23S 12W 06BBBA | 810 | 99 | Ca-HCO3,Cl |
| 6-3 | 25S 13W 06BCBC | 1440 | 338 | Na,Ca-Cl |
| 7-3 | 24S 13W 36DDDD | 690 | 56 | Ca,Na-HCO3 |
| 8-3 | 25S 12W 11AAAD | 1280 | 242 | Na-Cl,HCO3 |
| 8-4 | 25S 12W 11AAAD | 1190 | 201 | Na-Cl,HCO3 |
| 9-3 | 24S 10W 31CBCB | 3210 | 787 | Na-Cl |
| 10-3 | 24S 10W 06DCCC | 2420 | 598 | Na-Cl |
| 10-4 | 24S 10W 06DCCC | 1000 | 179 | Ca,Na-Cl,HCO3 |
| 11-2 | 22S 10W 06CBBB | 4000 | 1070 | Na-Cl |
| 12-3 | 29S 11W 36ACCC | 478 | 7 | Ca-HCO3 |
| 13-3 | 29S 14W 36AAAD | 424 | 11 | Ca-HCO3 |
| 14-3 | 29S 14W 12ABBB | 200 | 18 | Na,Ca-HCO3,Cl |
| 15-3 | 28S 11W 01AAAD | 552 | 25 | Ca-HCO3 |
| 16-3 | 21S 12W 31CCCB | 503 | 22 | Ca-HCO3 |
| 17-3 | 21S 12W 36DDCC | 672 | 28 | Ca-HCO3 |
| 18-3 | 21S 11W 07BBBA | 371 | 31 | Ca-HCO3,Cl |
| 19-3 | 25S 13W 36DCCC | 495 | 25 | Ca-HCO3 |
| 20-3 | 25S 13W 31DDAA | 500 | 27 | Ca-HCO3 |
| 21-3 | 26S 11W 01DDDA | 821 | 92 | Ca,Na-HCO3,Cl |
| 22-3 | 21S 12W 06CCBC | 460 | 9 | Ca-HCO3 |
| 23-3 | 21S 10W 06AADD | 890 | 159 | Na-Cl,HCO3 |
| 24-2 | 22S 10W 01ADBC | 1280 | 278 | Na-Cl |
| 25-3 | 23S 10W 06BBAB | 61300 | 23100 | Na-Cl |
| 26-3 | 23S 10W 01AAAA | 3160 | 762 | Na-Cl |
| 27-3 | 23S 09W 01ADAA | 2700 | 290 | Ca,Na-Cl+NO3 |
| 28-3 | 25S 09W 01ADDA | 280 | 9 | Ca,Na-HCO3 |
| 29-3 | 24S 10W 36AAAA | 362 | 17 | Ca-HCO3 |
| 30-3 | 23S 10W 36DAAA | 400 | 20 | Na,Ca-HCO3 |
| 31-3 | 22S 09W 01ADAA | 1600 | 295 | Na-Cl,HCO3 |
| 32-3 | 23S 09W 25DDDD | 5700 | 1600 | Na-Cl |
| 32-4 | 23S 09W 25DDDD | 1950 | 412 | Na-Cl |
| 33-3 | 25S 12W 36CBBA | 488 | 27 | Ca-HCO3 |
| 35-3 | 26S 10W 31CCCB | 451 | 10 | Ca-HCO3 |
| 36-3 | 27S 12W 06BAAB | 921 | 172 | Na,Ca-Cl,HCO3 |
| 36-4 | 27S 12W 06BAAB | 495 | 30 | Ca,Na-HCO3 |
| 37-3 | 27S 13W 05CABB | 385 | 19 | Ca,Na-HCO3 |
| 37-4 | 27S 13W 05CABB | 443 | 16 | Ca-HCO3 |
| 38-3 | 26S 12W 36ADDA | 218 | 19 | Na,Ca-HCO3,Cl+NO3 |
| 39-3 | 26S 10W 01AAAA | 1100 | 55 | Ca-HCO3,Cl+NO3 |
| 40-3 | 26S 09W 31CDDD | 462 | 5 | Ca-HCO3 |
| 41-3 | 26S 09W 35ADAD | 346 | 19 | Ca,Na-HCO3 |
| 42-3 | 28S 13W 01CBAA | 660 | 84 | Ca,Na-HCO3,Cl |
| 43-2 | 27S 13W 31DDDD | 460 | 37 | Ca,Na-HCO3 |
| 44-3 | 29S 13W 35ABBA | 370 | 14 | Ca,Na-HCO3 |
| 45-3 | 29S 11W 01DADA | 462 | 6 | Ca-HCO3 |
| 46-3 | 29S 11W 06AAAB | 470 | 9 | Ca-HCO3 |
| 47-3 | 29S 13W 12ABBA | 425 | 12 | Ca-HCO3 |
| 48-3 | 29S 12W 36DCCD | 370 | 3 | Ca-HCO3 |
| 49-3 | 27S 12W 35AAAA | 2270 | 560 | Na-Cl |
| 49-4 | 27S 12W 35AAAA | 458 | 48 | Na,Ca-HCO3,Cl |
| 50-2 | 21S 13W 06BCCC | 600 | 37 | * |
| 50-3 | 21S 13W 06BCCC | 600 | 42 | Ca-HCO3,Cl |
| 51-2 | 21S 14W 36DDDA | 500 | 20 | Ca-HCO3 |
| 52-2 | 23S 13W 06BBBC | 440 | 17 | Ca-HCO3 |
| * No complete analysis for sample | ||||
The quality of ground waters from the observation wells ranges from very fresh, i.e., substantially less than 1,000 mg/L total-dissolved-solids (TDS) concentration and approximately less than 1,800 µS/cm (the same as µmho/cm) specific conductance, to brine. The greatest concentrations of dissolved constituents that exist in the study are generally in the bedrock, up to 89,300 mg/L TDS, although the aquifer base wells contain up to 58,100 mg/L TDS. The upper aquifer waters usually range from very fresh to moderately saline, up to 3,190 mg/L TDS, except for site 25 which yields saltwater with 41,200 mg/L TDS.
Except for bicarbonate ion, the major cation and anion concentrations vary directly with the specific conductance and TDS concentration. Chloride values range the most widely, 4- 43,800, 2.4-32,000, and 2.4-23,100 mg/L in the bedrock, aquifer base, and upper aquifer, respectively. The lower values in the range of dissolved bicarbonate concentrations tend to be associated with very fresh waters and the most concentrated saltwaters, but otherwise, there is little correlation with dissolved solids. Dissolved silica ranges the least, 8.2-99 mg/L, with most concentrations between 20 and 40 mg/L. The upper limit of the silica range increases from the upper aquifer to the bedrock.
Potassium, strontium, boron, and bromide contents generally increase with increasing salinity of the sample. Higher ammonia levels tend to be found in the bedrock and aquifer base waters. Nitrate concentrations are generally higher in the fresh and lower salinity ground waters of the upper aquifer. The range in phosphate was relatively similar for the 3 different well depths, although the upper limits increased from the upper aquifer to the bedrock. Nitrite was detected (>0.01 mg/L) in only 3 of 21, 3 of 31, and 5 of 48 samples analyzed for this dissolved constituent from the bedrock, aquifer base, and upper aquifer.
Of the 47 observation wells in Permian bedrock, all but eight yield waters of Na-Cl type (Table 2). All eight of the ground waters of chemical type other than Na-Cl are fresh. There are five different types of waters in this group ranging from Na,Ca-Cl,HCO3 to Ca-HCO3. Ground waters in the bedrock are, except for two sites, all of Na-Cl type in the northern and central parts of the observation-well network. In the southern part of the network the waters change from NaCl progressively to Na,Ca-Cl,HCO3 to Na,Ca-HCO3,Cl to Na-HCO3 to Na,Ca-Cl,SO4 to CaHCO3. The direction of the change towards Ca-HCO3 ground waters is not only toward the south, but also towards the southwest where the freshest waters in the bedrock are located.
Table 5--Range in specific conductance and dissolved constituent concentrations in waters from the observation well network. Specific conductance is in µS/cm and the other constituent values are in mg/L.
| Constituent | Bedrock | Aquifer base | Upper aquifer |
|---|---|---|---|
| Spec. conductance | 238 - 100600 | 309 - 80600 | 218 - 62000 |
| Total diss. solids | 155 - 89300 | 205 - 57300 | 150 - 41200 |
| Silica | 8 - 99 | 18 - 65 | 16 - 56 |
| Calcium | 16 - 2000 | 30 - 948 | 14 - 726 |
| Magnesium | 1 - 890 | 4 - 514 | 2 - 313 |
| Sodium | 12 - 30800 | 14 - 21000 | 10 - 14900 |
| Potassium | 1.4 - 104 | 1. 5 - 90 | 1.1 - 39 |
| Strontium | 0.2 - 38 | 0.16 - 16 | 0.1 - 12 |
| Bicarbonate | 25 - 423 | 74 - 396 | 73 - 383 |
| Sulfate | 9 - 6290 | 10 - 3830 | 5 - 2770 |
| Chloride | 4 - 43800 | 3 - 32000 | 3 - 23600 |
| Fluoride | 0.1 - 0.9 | 0.2 - 0.9 | 0.1 - 0.6 |
| Bromide | <0.03 - 7.2 | 0.03 - 4.0 | 0.03 - 3.6 |
| Nitrate-N | <0.02 - 12 | <0.02 - 5.6 | <0.02 - 73 |
| Nitrite-N | <0.01 - 0.3 | <0.01 - 0.02 | <0.01 - 0.04 |
| Ammonium-N | <0.02 - 4.8 | <0.02 - 1. 8 | <0.02 - 0.06 |
| Phosphate-P | 0.03 - 0.4 | 0.02 - 0.7 | <0.03 - 0.8 |
| Boron | 0.04 - 8.8 | 0.04 - 5.5 | 0.02 - 11 |
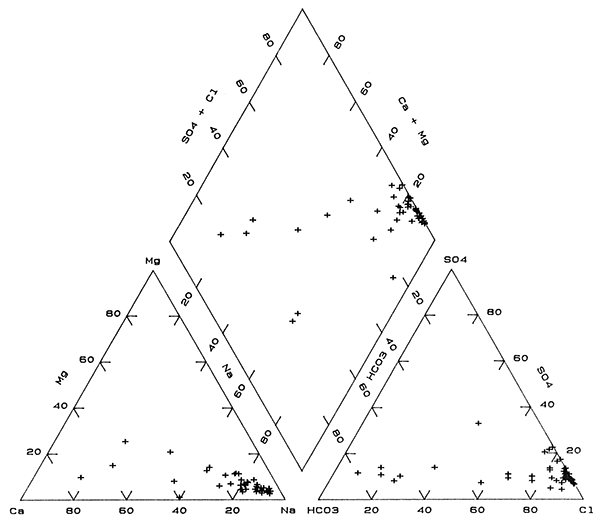
The change from Na-Cl to Ca-HCO3 type waters is also shown on a trilinear diagram in Figure 4 as points largely grouped along straight-line trends in each part of the diagram. These trends are primarily interpreted as mixing of fresh, Ca-HCO3 type waters with various amounts of Na-Cl type waters. One water, site 44, in the anion triangle of Figure 4 falls outside the trend due to a larger percentage of sulfate than for other the ground waters in the bedrock. This water also had the lowest percentage of magnesium in the cation triangle. Although the points representing waters for sites 45 and 48 fall within mixing trends for the individual cation and anion parts of Figure 4, the points fall well outside the mixing trend in the composite chemical part (the diamond). Waters in the bedrock at these two sites are Na-HCO3 and probably derived their increased sodium and bicarbonate contents by concomitant ion exchange and calcite dissolution. The higher sodium content for water at site 15 than for the mixing trend may also have been derived from ion exchange. Adjustment in carbonate mineral equilibria would not have had as great an affect on the percentage of bicarbonate because the sulfate and chloride concentrations are appreciably higher than at sites 45 and 48.
Figure 4--Trilinear diagram of major chemical constituents in Permian bedrock waters sampled from the observation well network.
Ground waters of Na-Cl type occur over a smaller proportion of the observation-well network in the deep part of the aquifer than in the underlying bedrock (Table 3). Of the 47 observation wells at or near the aquifer base, 30 yield waters of Na-Cl type. All 17 of the ground waters of chemical type other than Na-Cl are fresh. The trend of water types with generally decreasing concentration of dissolved solids is Na-Cl to Ca,Na-Cl to Na-Cl,HCO3 to Na,Ca-Cl,HCO3 to NaHCO3 to Ca,Na-HCO3 to Ca-HCO3. The change is similar to, but not identical to that in the bedrock across the network area. The Na-Cl waters are distributed primarily in the northern part of the network area and extend into the south through part of the central region of the area. Changes to higher percentages of calcium and bicarbonate contents in the waters are not only towards the south, but also towards the east and west in the southern half of the network.
Mixing trends from sodium to calcium rich and from chloride to bicarbonate-rich ground waters in the deep aquifer are both relatively well defined in the triangular parts of Figure 5, i.e., the scatter of points is occurs within a narrow zone. The chemical composite part of Figure 5 (the diamond), however, displays a much wider band of points than that for the bedrock and which are distributed on both sides of the main mixing trend in Figure 4. These differences are probably related primarily to a combination of the effects of ion exchange and calcite solution/precipitation coupled with mixing of different water types from both the aquifer and the underlying bedrock.
Figure 5--Trilinear diagram of major chemical constituents in waters near the unconsolidated aquifer base sampled from the observation well network.
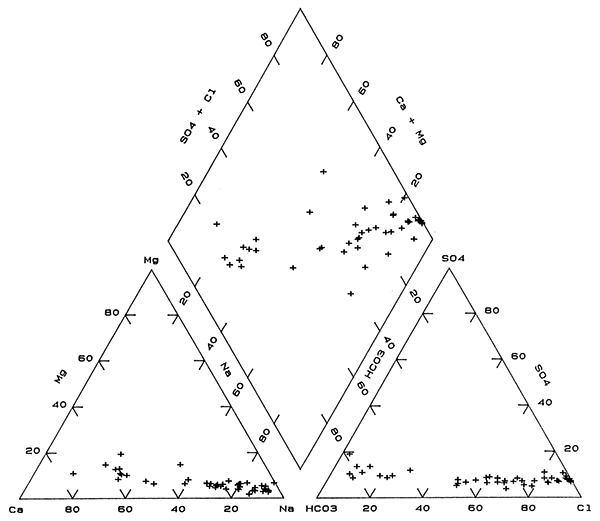
The distribution of chemical types of ground waters in the upper aquifer in the observation-well network (Table 4) is much more complex than that in both the deep aquifer and the bedrock. The water types in order of generally increasing concentrations of dissolved solids range from Na-Cl to Na,Ca-Cl to Ca,Na-Cl+NO3, to Na-Cl,HCO3 to Na,Ca-HCO3,Cl and Na,CaHCO3,Cl+NO3, to Ca,Na-HCO3,Cl to Ca-HCO3,Cl and Ca-HCO3,Cl+NO3, to Na,Ca-HCO3 to Ca,Na-HCO3 to Ca-HCO3. Seven sites have Na-Cl type water. Twenty-four of the 52 sites yield shallow ground waters of Ca-HCO3 type and 6 of Ca,Na-HCO3 type. The area of Na-Cl waters is relatively small in comparison to that of the deep aquifer and bedrock; Na-Cl water occurs primarily in the north-eastern part and at one site in the central part of the network. A band of mixed cation and anion waters with a core in which sodium and chloride are the predominate cation and anion, respectively, extends from around the Na-Cl water in the north-central part towards the southwestern portion of the network area. The largest areas of Ca-HCO3 type waters are in the southeast and northwest, while other sites with Ca-HCO3 waters are scattered in the west-central, east-central, and southwestern parts of the network.
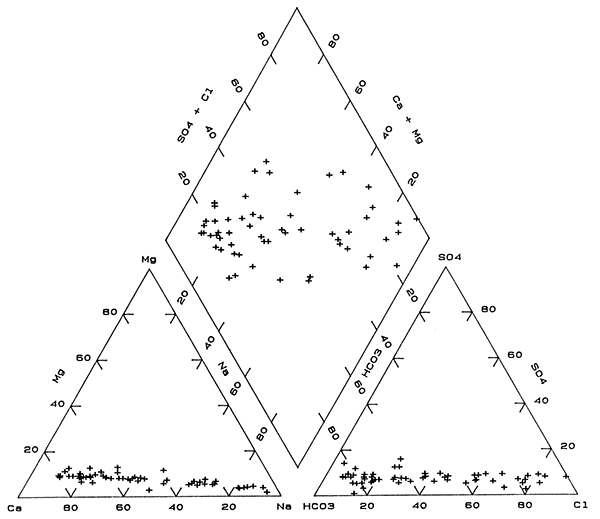
The mixing trends for both cations and anions in upper aquifer waters are similar to those in the base of the aquifer and are displayed as narrow bands of points on the triangular parts of Figure 6. Points for upper aquifer waters on the composite part of the trilinear diagram (the diamond) are distributed in a wide band. Much of this range in water type is probably due to a combination of mixing of different water types and the effect of ion exchange and calcite equilibria. However, additional effects are contamination by oil-field brines and infiltration of saline soil waters with high concentrations of nitrate from agricultural activities as discussed later. Nitrate concentrations at a few of the sites are high enough, relative to other constituents, that the mixed-anion type of water includes nitrate as indicated by Cl+NO3 in the types progression above. The smaller range in dissolved-solids contents of most of the ground waters in the upper aquifer also contributes to the wider scatter of points on the composite part of Figure 6 as compared to Figures 4 and 5, because small changes in constituent concentrations can affect ion ratios more. The progressively smaller scatter of points along the mixing trends in the triangular parts of Figures 5 and 6 for the aquifer in comparison with Figure 4 for the bedrock indicates that the ranges in magnesium and sulfate concentrations relative to those of the other major constituents is greater in the bedrock waters.
Figure 6--Trilinear diagram of major chemical constituents in waters in the upper unconsolidated aquifer sampled from the observation well network.
Plates 1-3 display the areal distribution of chloride concentrations in the Permian bedrock, near the aquifer base, and in the upper aquifer, respectively. The contours reflect the chloride values for the 1980's period. The isochlors were based mainly on the data for the observation well network, but also included information for water-supply wells and test holes of other studies. Investigations containing additional data used for the chloride maps were Fent (1950), Latta (1950), Bayne (1956), Lane (1960), Layton and Berry (1973), Stullken and Fader (1976), Hathaway et al. (1978), and Gillespie et al. (1991). The isochlors were located on the basis of both the chloride point data and considerations of the hydrogeology of the study region.
In general, the highest chloride values observed in the bedrock well samples were used for Plate 1 because lower concentrations are thought to represent induced flow of more dilute water from the overlying aquifer as a result of sample pumping. The oil-brine contribution to the chloride values for a few network well waters from the unconsolidated aquifer was subtracted because the contamination is believed to be mainly local. The determination of oil-brine contamination in the presence of natural salinity is discussed later in this report. The colored contour portion of Plates 1-3 represents the extrapolation of the observation well network data to an additional half-township outside the limits of the sites. Some of this area included data from other sources. The Arkansas River was used as the northeastern boundary of the contoured region.
A contour map of chloride values for waters in the Permian bedrock (Plate 1) shows that the highest salinities occur in the northwest and parts of the central portion of the observation well network. Freshwaters are in the bedrock along the southern part of the network area, at one site in the west-central portion of the area (site 19), and at one location in the center of the eastern boundary of the network (site 34). The water at site 19 appears anomalous and may indicate that a representative sample has not yet been obtained. Only one sample was collected from the bedrock well at this site, suggesting the possibility that more saline waters might be obtained after additional pumping. The south side of valley of the South Fork of the Ninnescah River is the approximate boundary for the transition from saline water to freshwater.
A finger of more saline water in the Permian extends eastward across the northern part of the network across Rattlesnake Creek and along Peace Creek, including the area of the Little Salt Marsh. The area of less saline water just to the southwest of Big Salt Marsh is in the area where Cretaceous rocks outcrop. Another zone of less saline water starts in the center of the network near Stafford and extends along the area between Peace Creek and the North Fork of the Ninnescah River. South of this zone, a protrusion of more saline water in the bedrock occurs between the North Fork of the Ninnescah River and Goose Creek. A more isolated, but highly concentrated band of saltwater exists along and to the north of the valley of the South Fork of the Ninnescah River.
Plate 2 displays the chloride distribution near the aquifer base. Although many of the deep network wells in the aquifer were installed at or near the bottom of the unconsolidated sediments, many of the wells are screened substantially above the bedrock surface. Thus, some of the spatial variation in the Plate 2 contours could result from the uneven depth distribution of the well screens relative to the bedrock top.
The highest salinities within the lower aquifer occur mainly in the northern part of the observation well network, and in a band extending southward to an area of saltwaters to the northeast of Pratt and north of the South Fork of the Ninnescah River. The area of saline water is appreciably smaller than that for the bedrock (Plate 1). In general, the more saline areas at the aquifer base are shifted somewhat to the east of the saltiest parts of the Permian bedrock, indicating the effect of the easterly regional flow of ground water on the salt intrusion. Comparison of the pattern for the aquifer base saltwaters (Plate 2) in the northwest part of the network with Figure 3 indicates that the zone of salinity increase coincides with the thinning of the Cretaceous cover over the Permian. The saltiest waters occur where the aquifer directly overlies the Cedar Hills Sandstone in the northwestern part of the study area. This saltwater zone ends just to the south of Rattlesnake Creek even though the Cedar Hills Sandstone directly underlies the aquifer to the south and contains saltwater.
The freshwater zone that protrudes from the west into the center of the study area coincides with the headwaters of Peace Creek and the North Fork of the Ninnescah River. This is an area of higher potentiometric surface in the aquifer which includes a downward movement of water that restricts upward movement of saltwater. The eastward extending finger of saline water present in the bedrock in the northern part of the network is reflected in the aquifer base. The small area of outcropping Cretaceous rock southwest of the Big Salt Marsh is at the northwest part of a local area of freshwater that spreads out in a down gradient flow direction from the outcrop. The transition from saline to freshwater just south of the South Fork of the Ninnescah River occurs over a shorter distance.
Freshwaters occur in the shallow aquifer across most of the observation well network (Plate 3) in sharp contrast to the much greater extent of saline water at the aquifer base. Where there are two wells in the middle to upper part of the aquifer, the map relies mainly on data for the shallower well. Approximate averages were used for sites 8, 49, and 50 because the average depths of the intermediate and shallow wells at these sites are more similar to the shallow well depth at the other six sites with both intermediate and shallow wells (Table 1). The chloride concentration for site 44 is from well 3 because there is no data available for well 4 at this location. The value used for site 34 is the same as that for well 2 at this site because this well is so shallow, even though it is screened just above the bedrock.
The shallow aquifer waters with the highest salinities occur mainly in the northeastern region of the well network. Saline water from the lower aquifer intrudes into the shallower aquifer along most of Rattlesnake Creek downstream of St. John, and along portions of the Arkansas River, Peace Creek, and the North and South Forks of the Ninnescah River. Saltwater also enters the shallow aquifer around Big Salt Marsh and Little Salt Marsh. However, the saline intrusion pattern does not always coincide with the streams and salt marshes. A band of saline water extends north from the clockwise, 90 degree major bend in the Rattlesnake River toward the Arkansas River. A protrusion of slightly saline water spreads from the Little Salt Marsh eastward to the headwaters of Salt Creek. A band of higher chloride water connects the intrusion zones of Peace Creek and the North Fork of the Ninnescah River.
Ground-water chloride concentrations increase with depth within the unconsolidated aquifer and from the aquifer to the bedrock at all sites in the observation well network except sites 19 and 25. At these latter two sites, the dissolved chloride increases with depth in the aquifer, but is somewhat lower in the bedrock than at the base of the aquifer. As indicated above in the section on salinity in the bedrock, the single sample from the bedrock well at site 19 may not be representative. The wells at site 25 have been sampled at least a few times each and the results are consistent with the lower chloride in the bedrock water than at the aquifer base.
The percentage change in chloride concentration within the aquifer and from the aquifer to the bedrock ranges widely from site to site, i.e, at some sites the greater percent change in chloride is from the upper to lower aquifer waters, at other sites the change is greater from the aquifer base to the bedrock well depth. The ground-water flow conditions and differing chloride content in bedrock waters at each site vary widely such that no uniform chloride gradient occurs across the area.
Comparison of the chloride distribution at the aquifer base (Plate 2) with that for the upper aquifer (Plate 3) indicates areas where there is a great change in the salinity with depth. For example, areas of freshwater with chloride concentrations less than 100 mg/L in the upper aquifer overlie saltwater with chloride greater than 10,000 mg/L at the aquifer base in the northwestern region of the network in north-central and northeastern Stafford County and in the central part of the network to the northeast of Pratt. The first of these two areas has the greatest contrast in salinities with depth in the aquifer because the aquifer base includes waters with chloride concentrations above 20,000 mg/L. Pumping by irrigation wells in the lower aquifer in regions where the salinity change is great could be expected to result in increases in chloride during the pumping season if there are no substantial clay units to retard upconing of saltwater.
The areal distributions of chloride concentration in Plates 1-3 show general patterns of high and low chloride that can be attributed to the salinity of water in the bedrock. Two additional factors probably control most of the complexity in the distribution patterns within the regions of higher salinities. The first of these factors is the unevenness of the bedrock surface. The bedrock surface maps of Fader and Stullken (1978) and Sophocleous et al. (1993) show bedrock ridges and channels of an old erosion surface. The sites of the observation well network are situated in different positions on this surface as can be seen by the wide variation in bedrock depths from site to site. The saltiest waters along the bedrock-deep aquifer interface within a saline region in the network could be expected to be present where the depths to bedrock are the greatest Saltwaters at the base of the aquifer could preferentially flow within bedrock channels around and along the base of bedrock ridges. The slow flow of freshwater into bedrock ridges and hills below recharge zones would dilute saltwater in the bedrock to lower salinities than at greater depth. The Cretaceous bedrock outcrop to the southwest of the Big Salt Marsh shows this effect on lower salinity waters in the Permian bedrock and an area of fresh waters surrounded by saline waters at the overlying aquifer base.
The other major factor controlling the chloride distribution is the location of recharge and discharge zones. Ground-water discharge along streams and rivers and around Big Salt Marsh and Little Salt Marsh are important for saltwater intrusion patterns. Ground-water flow lines curve upward in the vicinity of the discharge zones, bringing up lower waters to the streams and allowing underlying saltwaters to rise. The four wells at observation site No. 49, which is within 200 ft of the South Fork Ninnescah River, illustrate the upconing. The deeper the well at this site, the higher the water level. The two deeper wells have hydraulic heads above land surface. Heads in the deeper wells at site 4 also are higher than shallower wells; site 4 is within 500 ft of Rattlesnake Creek.
Cross sections in Young (1992) taken from Cobb (1980) show the effect of ground-water discharge on the vertical distribution of chloride concentration in the aquifer (see Figures 6 and 7 in Young). The upconing of saline water in these figures corresponds to the upward bending of ground-water flow lines. Ground-water flow rates increase in the discharge area where flow lines converge underneath the streams. The mixing of freshwater, saline water, and saltwater increases in the subsurface below the discharge zone because hydrodynamic dispersion increases with increasing ground-water velocity.
Recharge in upland areas increases the hydraulic head overlying the Permian bedrock and decreases the rate of upward saltwater intrusion. Where the downward movement is great enough, freshwater can penetrate to the base of the aquifer and even into the bedrock to flush out saline water. Ground-water recharge is clearly responsible for the freshwater overlying saline water in the aquifer, and for the flushing of saltwater from the Permian bedrock south of the South Fork of the Ninnescah River.
The higher chloride concentration at the base of the aquifer than in the bedrock at site 25, and the anomalously high chloride in the upper aquifer at this site, might reflect discharge of saltwater below the Little Salt Marsh that has been further concentrated by evapotranspiration. The area of the salt marsh and to the east is generally a marshy area that could be subject to concentration of shallow ground waters by evapotranspiration during recent geologic time. High salinity is also found in the ground waters immediately underlying the Cheyenne Bottoms (Whittemore and Huggins, 1987). The salinity decreases in the sediments underlying the Bottoms and has a chemistry that indicates evapotranspiration as the most probable mechanism to concentrate fresh to slightly saline waters entering the Bottoms in the past.
Although natural Permian saltwater is known to be the main source contributing to the salinity of ground waters in the Great Bend Prairie aquifer, local contamination by brines brought to the surface by oil and gas operations has also been documented. Oil production began in the Great Bend Prairie area about 1930. Petroleum fields with past and present production cover a large percentage of the aquifer area (Figure 7). Every township of the study area except one (T. 26 S., R. 10 W.) includes at least one or part of an oil and/or gas field. The colored contour portion of Plates 1-3 comprises a total area of approximately 1,890 square miles. The size of contiguous petroleum fields within this area comprise from a quarter square mile up to about 27 square miles for the Zenith-Peace Creek Field. Several townships in the contoured region contain several petroleum fields that cover over a quarter of the 36 square miles (Figure 7). Township T. 21 S., R. 13 W. in north-central Stafford County includes oil fields that comprise about half of the area.
Figure 7--Oil and gas fields in the study area (Kansas Geological Survey, 1989a, 1989b). The map area is the same as for Figure 2 and Plates 1-3.
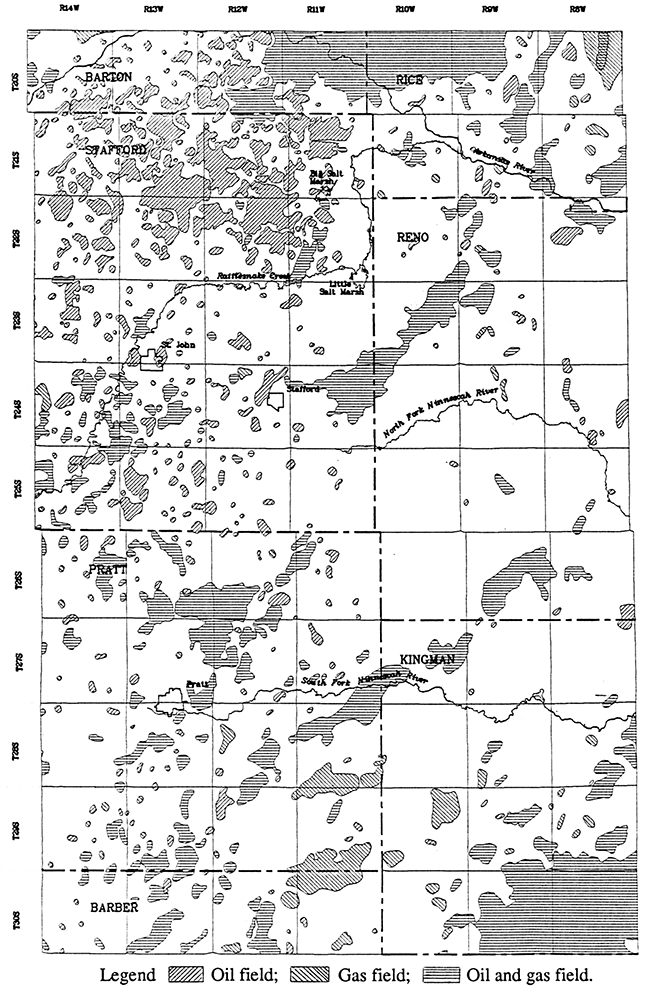
Practices of oil-brine disposal in the early days of the petroleum industry in Kansas mainly involved containing the brines in surface pits or letting the brines run into surface drainages. Consequently, ground water and surface water became locally contaminated. For example, a sizable area of the Equus Beds aquifer overlying the Burrton Oil Field was affected by the surface disposal of oil brines (Burrton Task Force, 1981; Whittemore et al., 1985). Subsurface disposal in bedrock containing natural saltwater at shallow to moderate depths or in deep strata began to be important in the 1930's. The beginning of the development of oil fields in the 1930's during which subsurface disposal became important probably helped prevent widespread pollution by oil brine in the Great Bend Prairie. However, until this report, no study has been previously conducted that quantitatively assesses the contribution of oil brine to the salinity of the Great Bend Prairie aquifer.
Another contributor to salinity is the concentration of dissolved solids by evapotranspiration of surface and soil waters. Agricultural practices leading to raised water tables have resulted in saline seeps and soils in low lying areas in some locations in the Great Plains. Concentration of irrigation waters by evapotranspiration can lead to increased soil salinity. The wastes from a high density of stock can also increase the chloride content of soil moisture. The salts from both of these agricultural sources can then be leached to the ground water during recharge events. Any increases in salinity from these sources would be expected to occur in shallower wells in the upper aquifer.
The salinity sources for ground waters in the Great Bend Prairie aquifer were identified using the method of Whittemore (1984, 1988). The identification is based primarily on mixing curves on graphs of bromide/chloride and sulfate/chloride versus chloride concentration, but also include examination of other chemical data such as nitrate. The contributions of oil brine and evapotranspiration concentration to chloride contents in mixtures with natural Permian chloride can be estimated from intersections of mixing curves.
Nearly all of the waters collected from the GMD5 observation-well network fall in a relatively narrow band on the plot of bromide/chloride ratio versus chloride concentration (Figure 8). The plotted symbols represent all the observation network wells from which representative samples were collected and bromide measured, and include more than one sample for several wells. The contiguous band of points is enclosed by mixing curves. Each curve is based on calculations assuming conservative mixing between the low-chloride and high-chloride end points. Bromide and chloride are conservative constituents (essentially unaffected by precipitation, oxidation-reduction, and adsorption processes) in ground waters. The band of points enclosed by the mixing curves represents the mixing of fresh ground waters with Permian saltwater derived from the dissolution of halite (rock salt). Bromide/chloride ratios are very low for halite, which is composed of sodium chloride, because little bromide is incorporated into halite during its precipitation in ancient seas. Furthermore, recrystallization of some Permian salt in the geologic past has probably removed some of the bromide present in the halite.
Figure 8--Bromide/chloride weight ratio versus chloride concentration for waters from the observation well network. Legend: P Permian bedrock wells; B Aquifer-base wells; A Upper-aquifer wells.
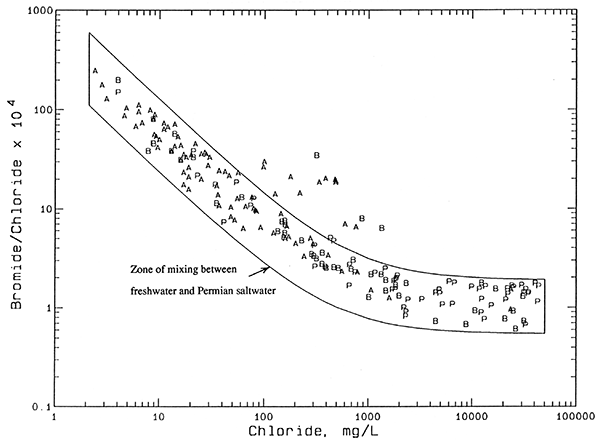
Points for water samples departing appreciably from the mixing zone in Figure 8 indicate a source or factor additional to simple mixing with natural Permian saltwater that affects the chloride and bromide concentrations. Figure 9 shows the same points for observation well waters as in Figure 8. Instead of the mixing zone, a mixing curve (solid line) has been drawn that passes through the top part of the contiguous band of data points. This curve represents the mixing of waters that have the highest bromide/chloride ratio, given a particular chloride concentration, that would be expected to occur naturally in the unconsolidated aquifer and bedrock. Points above this curve could indicate either additions of both chloride and bromide from an oil brine source, or increases in chloride at a constant bromide/chloride ratio from evapotranspiration concentration.
Figure 9--Bromide/chloride weight ratio versus chloride concentration for waters from the observation well network with mixing curves for oil-field brine. Legend: P Permian bedrock wells; B Aquifer-base wells; A Upper-aquifer wells; O Oil-field brine.
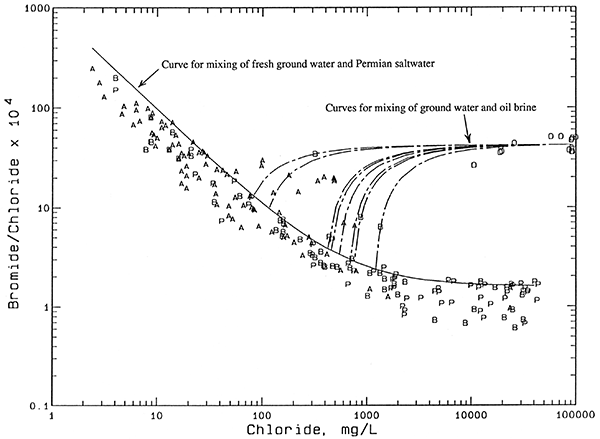
All of the observation well waters (9 points for 8 different wells at 7 network sites) in Figure 9 for which oil brine is an expected source of additional chloride have characteristics that help distinguish them from ground waters with increased chloride from agricultural activities. Most importantly, they all contained nitrate-N concentrations lower than 2 mg/L, values less than the approximate upper limit of 4 mg/L for natural dissolved nitrate-N in ground waters underlying the Great Bend Prairie. All of the waters for which agricultural activities are a suspected source of added chloride (7 points for 3 different wells) had nitrate-N contents about 6 mg/L or greater. The calcium/chloride ratios for well waters substantially affected by both the oil-brine and agricultural chloride sources are higher than waters with similar chloride concentrations, but from a natural salinity source. The 3 wells having an identifiable agricultural contribution to chloride are shallow, with a total depth of 50 ft or less. In contrast, the 8 wells identified as having an oil-brine contribution to salinity range in depth from 70 to 140 ft. Past oil-brine contamination at the surface could penetrate to deeper depths than agricultural salinity increases because the density of oil brines is great enough to produce vertical brine flow through fresher water. Also, oil brine contamination could occur in the subsurface portion of the aquifer from corroded disposal wells.
The circles on Figure 9 indicate the composition of many oil brines collected from within the observation well network or at most two townships from the edge of the network area, and analyzed at the KGS (Table 6). The oil-brine data are either from unpublished data of Whittemore or from KGS Open-File reports on salinity identification studies for local contamination problems. The data are for 14 brines from at least 6 different oil-producing strata; the lowest bromide/chloride ratio is for Arbuckle Group oil brine from an oil well outside the observation well network area. Oil brines contain much higher bromide/chloride ratios than salt-dissolution waters because the brines in Kansas are trapped seawaters that were previously concentrated in evaporite basins, were altered by mixing with halite-dissolution saltwater, and/or to which bromide has been added from the decomposition of organic matter which formed oil and gas deposits. Seawater has a bromide/chloride weight ratio of 0.0035 at a chloride content of approximately 19,000 mg/L, placing it within the distribution of oil brines on Figure 9.
Each of the dashed lines in Figure 9 represents the calculated mixing of oil brine with natural fresh or saline water to produce the chemistry of the water samples that plot above the solid mixing line. The oil-brine end point for each dashed line is the same and was chosen to have a bromide/chloride weight ratio (0.0042) that is the approximate average for the oil-brine data. Each dashed line extends from the oil-brine end point through the point for an observation well water and is extrapolated to intersect with the solid curve. The chloride value at the intersection with the solid curve indicates the natural contribution to the total chloride content of the actual water sample. The chloride added to the ground water from oil brine can be computed as the difference between the natural chloride and the total chloride as given in Table 7.
Table 6--Oil-field brines in or surrounding the observation well network area. Samples were analyzed by the Kansas Geological Survey and are arranged in order of increasing age of the formations from which they were produced.
| Formation | County | Location | Cl, mg/L |
SO4, mg/L |
Br, mg/L |
SO4/Cl | Br/Cl x 104 |
|---|---|---|---|---|---|---|---|
| Lansing-Kansas City | Pawnee | 23S 15W 30 C | 93000 | 189 | 322 | 0.00203 | 35.7 |
| Lansing-Kansas City | Pawnee | 23S 15W 30 C | 91000 | 572 | 327 | 0.00628 | 35.9 |
| Lansing-Kansas City | Pawnee | 23S 15W 30 C | 86400 | 390 | 322 | 0.00452 | 37.3 |
| Lansing | Pawnee | 23S 15W 30 B | 91800 | 255 | 358 | 0.00278 | 39.0 |
| Arbuckle | Stafford | 22S 12W 3 A | 19490 | 1490 | 71 | 0.0764 | 36.4 |
| Lansing | Rice | 19S 10W 29 DB | 72200 | 126 | 366 | 0.00175 | 50.7 |
| Lansing | Pratt | 27S 11W 25 ADC | 92300 | 143 | 451 | 0.00155 | 48.9 |
| Lansing-Kansas City | Stafford | 21S 12W 3 DCD | 100500 | 26 | 497 | 0.00026 | 49.5 |
| Lansing-Kansas City | Stafford | 25S 13W 6 ACC | 19100 | 76 | 39.8 | ||
| Kinderhookian | Rice | 20S 9W 19 S/2 S/2 D | 57600 | 256 | 292 | 0.00444 | 50.7 |
| Viola | Stafford | 23S 11W 36 S/2 B | 90600 | 272 | 426 | 0.00300 | 47.0 |
| Simpson | Stafford | 21S 11W 28 ACAB | 18830 | 169 | 66.6 | 0.00898 | 35.4 |
| Simpson Sand | Stafford | 22S 11W 33 BAD | 25700 | 1300 | 112 | 0.0506 | 43.6 |
| Arbuckle | Rice | 19S 9W 20 C | 10580 | 1580 | 27.9 | 0.1493 | 26.4 |
Table 7--Estimates of the natural and oil-brine contributions to the chloride concentration of the observation well waters in which oil-brine contamination is suspected. Natural chloride indicates sources from natural freshwater and Permian saltwater. The range in the estimated chloride concentration for the oil-brine contribution is based on the high and low bromide/chloride ratios for the non-Arbuckle brines. The range in the natural chloride (not shown) corresponds to the range in the oil brine. The oil-brine percentage is the oil-brine chloride divided by the total chloride concentration multiplied by 100. The range in the oil-brine percentage reflects the oil-brine range in chloride concentration pfus the estimated maximum analytical error. Sample date is year-month-day.
| Network site-well |
Sample date |
Chloride, mg/L | Oil brine, % |
Oil brine, % range |
|||
|---|---|---|---|---|---|---|---|
| Total | Natural | Oil brine |
Oil brine, range |
||||
| Wells in Permian bedrock | |||||||
| 15-1 | 84-01-03 | 434 | 420 | 14 | 11-16 | 3 | 2-4 |
| 15-1 | 86-07-11 | 466 | 454 | 13 | 10-15 | 2 | 2-4 |
| Wells at or near aquifer base | |||||||
| 4-2 | 82-11-29 | 869 | 756 | 114 | 93-132 | 13 | 9-17 |
| 15-2 | 82-12-14 | 318 | 82 | 236 | 194-282 | 74 | 57-93 |
| 51-1 | 87-08-19 | 1,350 | 1,215 | 136 | 110-153 | 10 | 7-12 |
| Wells in upper aquifer | |||||||
| 6-3 | 84-11-01 | 338 | 219 | 119 | 98-141 | 35 | 25-45 |
| 10-3 | 83-12-06 | 598 | 542 | 57 | 46- 66 | 9 | 7-12 |
| 10-4 | 84-11-05 | 179 | 116 | 63 | 52- 75 | 35 | 25-46 |
| 26-3 | 84-11-03 | 762 | 692 | 70 | 57-81 | 9 | 6-12 |
If the oil-brine end point for the dashed mixing curves were selected to have a lower bromide/chloride ratio, the estimated oil-brine contribution to the total chloride would be greater. Likewise, a higher bromide/chloride ratio for the oil-brine end point would give a somewhat lower estimate. The mixing curve intersections were calculated using the highest and lowest bromide/chloride weight ratios, 0.00507 and 0.00354, for the non-Arbuckle oil brine. This range in oil-brine ratios also represents brines that were collected from within the map area of Plates 1-3. The resultant range in the oil-brine contribution to the total chloride for each water sample is also indicated in Table 7. The percentage range in the oil-brine contribution in the last column in the table includes the effect of analytical error, which amounts from about one to 6 additional percent. The larger the oil brine percentage, the greater the effect of the bromide/chloride ratio and the analytical error on the resultant percent error range.
Even larger contributions from oil brine would result from calculations based on the composition of the Arbuckle saltwater. However, in the case of well 15-2, use of an Arbuckle brine end point would give an oil-brine percentage much greater than 100 percent, an impossibility. The Arbuckle saltwater has a bromide/chloride ratio too low for it to be the possible source for added chloride in this well. Thus, for this well the other oil-brine data are definitely more appropriate for calculating the chloride contamination. The low sulfate/chloride ratios for waters from wells 15-2 and 6-3, which have more than 300 mg/L chloride and an oil brine percentage of 35 or more, in comparison with the sulfate/chloride ratios for other well waters with similar chloride contents also indicate that a non-Arbuckle brine is probably the contamination source. The sulfate/chloride ratio for the Arbuckle water in Table 6 is in the range of what would be expected for the natural ratio in the aquifer ground waters at chloride concentrations of 318-338 mg/L. The sulfate/chloride ratios for the other oil brines are appreciably lower and better fit the decrease in the ratio for waters from wells 15-2 and 6-3.
Use of a curve for the mixing of freshwater and natural Permian saltwater that was at lower bromide/chloride ratios than in Figure 9 would also produce larger apparent contribution of oil brine for the wells in Table 7. The dashed curves from the oil brine end point passing through the points for the contaminated waters would intersect a shifted solid curve (for example, the long-dashed curve in Figure 10) at lower chloride concentrations that represent the natural source. However, use of such a shifted curve could result in assigning some chloride increase from possible agricultural sources to an oil-brine source. Overall, the values in Table 7 are conservative estimates of the oil-brine contribution.
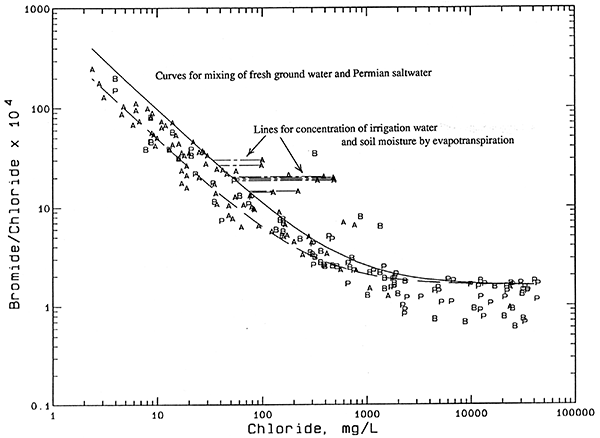
Figure 10--Bromide/chloride weight ratio versus chloride concentration for waters from the observation well network with mixing lines for evapotranspiration concentration. Legend: P Permian bedrock wells; B Aquifer-base wells; A Upper-aquifer wells.
Five of the 6 sites indicated in Table 7 as having oil-brine contamination are either located within or on the edge of oil fields as delineated by maps of the Kansas Geological Survey (1988a, 1988b) and shown in Figure 7. The two sites that are on the boundary edge are in a downgradient direction of ground-water flow from the oil fields. Although site 4 is not within an oil field, a small oil field lies approximately one-fourth mile in an up gradient direction of ground-water flow.
The amounts of chloride contributed by oil brine to the total chloride of the sampled ground waters (Table 7) range from just detectable (13 mg/L) to 236 mg/L. Oil brine comprises the major amount of chloride in the ground water at only one well. Although the pollution additions to the chloride concentration exceed 50 mg/L for the 7 aquifer wells listed in Table 7, the natural chloride at 4 of these locations is too high for the water to be usable for irrigation or drinking supplies. The ground water at only one location, near the aquifer base at site 15, was changed from a usable to an unusable supply for these purposes.
Nearly all of the contamination for the different wells was detected within the unconsolidated aquifer and occurs both within the upper and the lower parts of the aquifer. However, the bedrock well water at site 15 appears to contain a very small amount of diluted oil brine. The aquifer-base water at site 15 contains the greatest amount of oil-brine contamination of any network well. The trace of oil-brine contamination in the bedrock at this site could possibly be some water that entered during the drilling and was not completely removed during pumping of the well before sampling.
Oil-field brine has been chemically identified as contributing to salinity in the aquifer in at least 3 other locations within the observation well network (Table 8). The predominant salinity source in the Andrews and Mawhirter domestic well waters in southwest Stafford County was identified for an oil company in 1981 (Whittemore, unpublished). The estimates for the chloride sources in the two well waters are based on an oil-brine (Table 6) collected from a separator tank in the same section as the Mawhirter domestic well. The estimated concentration for the natural chloride source for both wells is about 200 mg/L. The natural chloride concentration expected for upper aquifer water in this area is estimated to be near 100 mg/L based on data used for Plate 3, while water at the aquifer base should contain approximately 400 mg/L dissolved chloride (plate 2). The 200 mg/L value computed for natural chloride from the mixing curves fits within this range.
Table 8--Estimates of the natural and oil-brine contributions to the chloride concentration of domestic, monitoring, brine recovery, and irrigation well waters in which oil-brine contamination is suspected or known. Natural chloride indicates sources from natural freshwater and Permian saltwater. The estimated chloride concentration for the oil-brine contribution is based a bromide/chloride weight ratio of 0.0042. The oil-brine percentage is the oil-brine chloride divided by the total chloride concentration multiplied by 100. The estimated error in the values would be similar to the ranges in Table 8 for similar chloride and percentage ranges. Sample date is year-month-day.
| Location | Sample date |
Br, mg/L |
Chloride, mg/L | Oil brine, % |
||
|---|---|---|---|---|---|---|
| Total | Natural | Oil brine |
||||
| Andrews and Mawhirter domestic wells, Stafford County | ||||||
| 24S-13W-31DDC | 81-07-09 | 2.03 | 677 | 202 | 480 | 71 |
| 25S-13W-06AAB | 81-07-09 | 2.33 | 744 | 193 | 556 | 75 |
| Maxedon Lease, monitoring well 3 and recovery system, Pratt County | ||||||
| 27S-11W-25ADCB | 89-11-?? | 0.82 | 203 | 62 | 141 | 70 |
| 27S-11W-25ADCD | 89-11-?? | 10.8 | 2,270 | 86 | 2,184 | 96 |
| Newell irrigation well, Reno County | ||||||
| 24S-10W-19DACC | 82-07-20 | 0.71 | 260 | 118 | 142 | 55 |
| 24S-10W-19DACC | 82-07-27 | 0.90 | 305 | 118 | 187 | 61 |
| 24S-10W-19DACC | 82-08-01 | 0.95 | 323 | 124 | 199 | 62 |
| 24S-10W-19DACC | 82-08-07 | 0.99 | 334 | 126 | 208 | 62 |
| 24S-10W-19DACC | 82-08-13 | 1.03 | 345 | 128 | 218 | 63 |
| 24S-10W-19DACC | 82-08-21 | 1.06 | 354 | 130 | 225 | 63 |
| 24S-10W-19DACC | 82-08-25 | 1.06 | 356 | 132 | 225 | 63 |
| 24S-10W-19DACC | 82-08-29 | 1.08 | 357 | 128 | 230 | 64 |
| 24S-10W-19DACC | 82-09-05 | 1.08 | 397 | 169 | 228 | 57 |
| 24S-10W-19DACC | 82-09-18 | 1.10 | 392 | 159 | 233 | 60 |
Salinity sources were identified for the Kansas Corporation Commission (KCC) in ground waters at a site of known oil-brine contamination in eastern Pratt County (Whittemore, 1990a). The analyses included 4 monitoring well waters of the Corporation Commission, 3 observation well waters from a U.S. Geological Survey site in the same investigation area, a sample of oil brine from a tank battery at the site, a sample from the saltwater recovery system, and water from the nearby South Fork of the Ninnescah River. The estimated chloride concentrations for the different salinity sources are listed in Table 8 for the two waters in which oil-brine contamination was found. The chloride concentrations for the other 6 monitoring and observation wells ranged from 69 to 162 mg/L and contained less than 2 percent chloride from oil brine. The other well waters plot within or at the upper boundary of the mixing zone of freshwater with Permian saltwater in Figure 9. The Ninnescah River water had a chloride content of 279 mg/L and a bromide/chloride ratio that would plot in the middle of the natural ratio range at this chloride on Figure 9.
A study was conducted to determine the salinity sources in an irrigation well water from western Reno County in cooperation with GMD5 (Whittemore and Hathaway, 1983). The KGS had previously examined irrigation water quality across the Great Bend Prairie aquifer in 1977 (Hathaway et al, 1978). The previous investigation included a chloride concentration of 311 mg/L for a sample collected from the Newell irrigation well on July 27, 1977. In 1982, GMD5 collected 10 samples from the well during the irrigation season and sent them to the KGS for determination of ground-water quality changes with pumping and salinity sources. The chloride concentrations in the waters slowly climbed during pumping (Table 8). The salinity sources were reexamined for this current report to estimate more accurately the proportion of each. The same bromide/chloride ratio was used for the oil-brine end member of calculated mixing curves as for the mixing curves in Figure 10. The estimated chloride for the natural Permian source slowly rose during the summer. The predicted chloride for water at the aquifer base is between 500 and 1,000 mg/L (Plate 2). The pumping stress appears to have caused higher chloride water to rise from deeper in the aquifer to the irrigation well screen. The chloride from oil-brine also increased during the pumping suggesting that a greater concentration of oil brine is present at some horizontal or vertical distance from the well screen. The rate of increase in the oil-brine contamination was slightly greater than that for the natural source for most of the irrigation season. However, towards the end of the pumping the percentage of the oil-brine source dropped somewhat. This could reflect the localized nature of the pollution in contrast with the more widespread occurrence of the natural salinity.
Another investigation for the KCC was conducted at the Siefkes subsidence site (NE sec. 3, T. 22 S., R. 12 W.) in northeast Stafford County (Whittemore, 1990b). The KCC installed two monitoring wells in the aquifer in the subsidence area of a plugged well used in the past for oil-brine disposal. Both monitoring wells contain screened intervals of 50 ft that extend from depths of 80 and 85 ft in the aquifer middle to 130 and 135 ft at the aquifer base. Water collected from the top of the screened interval was fresh, with chloride contents of 18-72 mg/L. Samples collected from the bottom of the wells were saline with chloride concentrations of 2,390-5,220 mg/L. Points for the fresh waters and the saline waters would lie within the mixing zone of freshwater and Permian saltwater if plotted on Figure 9. Thus, no presence of oil brine could be identified in the waters.
Irrigation waters in GMD5 usually are pumped from the lower part of the unconsolidated aquifer. Although the waters must be fresh for use on crops, the water generally is more saline than the natural upper-aquifer waters as a result of Permian saltwater intrusion. Evaporation concentration of the irrigation waters sprayed from the air, as in center pivot systems, can be substantial during hot, dry days. Evapotranspiration of soil moisture from irrigation water or animal waste can also produce higher salinities. Sophocleous, et al. (1990a, 1990b) and Whittemore (1991) documented and chemically identified, respectively, local salinity increases in shallow ground waters in GMD5 resulting from agricultural activities. For example, the ground-water chloride concentration decreases from several hundred mg/L at a depth of 20 ft below the surface to about 100 mg/L at a depth of 34 ft at recharge study site 6, and from near or over 100 mg/L to 30-40 mg/L for a depth increase from 30 to 70 ft at recharge site 7 (Sophocleous, 1990a).
The amount of chloride contributed by evapotranspiration as a result of agricultural practices can be calculated in an analogous manner as for the oil brine. In this case, however, the dashed mixing lines are horizontal (Figure 10) and extend from the points for the affected ground water to intersect with the solid curve for the mixing of freshwater and natural Permian saltwater. An end point representing saline soil water contributing to the increased ground-water chloride would exist at even higher chloride concentrations, but at the same bromide/chloride ratio. The similar and conservative chemical character of bromide and chloride in surface and subsurface waters that are not very dilute results in little change in the ion ratio during evapotranspiration concentration. The increase in chloride with essentially the same bromide/chloride ratio for water from well 2-2 is consistent with this expectation.
The upper aquifer at 3 well sites contains identifiable chloride contributions from agricultural activities based on ground-waters sampled from the network (Table 9). None of the 3 sites is located in an oil field; distances to the nearest oil field range from about 0.5 to 1.5 mile. The nitrate-N contents for upper-aquifer wells 2-2, 5-3, and 27-3 were 6-8.8, 5.9, and 51-73 mg/L, respectively, for the sample dates in Table 9 based either on nitrate determination in the same sample or estimation from nitrate data for sample(s) nearest the sample date. Observation wells at 13 other sites contain nitrate concentrations about 6 mg/L or greater. However, except for well 7-3, any related chloride increases that might exist at these sites are not great enough to place points for the waters outside of the main band of points and above the solid curve on Figure 10. We117-3 could possibly have about 10 or more mg/L chloride added from agricultural sources. However, the sample for this well does not plot far enough from the main band of points to be included in the same group of waters in Table 9. The relative analytical error at the lower chloride and bromide concentrations is also greater, and thus, could comprise a more significant proportion of the shift on Figure 10. The nitrate-N for the well 7-3 sample was 5.6 mg/L, suggesting that some agricultural effect is present.
The high chloride attributed to agricultural sources for water from well 27-3 is not unreasonable, even though well 27-2 in the lower aquifer at this site is only 65 ft deep and yielded water containing 719 mg/L chloride. Well 27-3 is shallow--35 ft total depth. In addition to the very high nitrate concentration, the sulfate content for the four samples listed in Table 9 ranged from 117 to 201 mg/L in contrast with the lower sulfate of 70 mg/L for well 27-2. The sulfate/chloride ratio for the more saline water in the bedrock well 27-1 is close to that of the water from well 27-2. Concentration of waters by evapotranspiration increases the sulfate content of soil moisture as well as chloride. Not as much sulfate may be leached from soil salts to the ground water as chloride, because the sulfate minerals, mainly gypsum (CaSO4·H2O), are not as soluble as chloride salts. Thus, the increase in chloride can be greater in shallow ground water than the sulfate. However, much of the sulfate can be leached, which is reflected in the sulfate concentration higher than expected for natural sources in the shallow ground water at this site. At least one other location in GMD5 has a documented salinity exceeding that of well 27-3. Chloride concentrations as high as several hundred to over 1,000 mg/L have been found in ground water at a depth of 20 ft at a recharge study site near observation well network site 2 (Sophocleous et al., 1990a). The recharge study site was next to a flood-irrigated field. Nitrate-N contents of this water were 4.3-6.6 mg/L during the same period.
Table 9--Estimates of the natural and agricultural contributions to the chloride concentration of the observation well waters suspected of being substantially affected by agricultural activities. Natural chloride indicates sources from natural freshwater and Permian saltwater. The estimated agriculture chloride concentrations are computed using the intersections of the horizontal lines with the mixing curves through the main band of points in Figure 9; the minimum agricultural chloride is the intersection with the solid curve and the maximum agricultural chloride is the intersection with the dashed curve. The natural chloride concentration associated with the maximum agriculture chloride would be correspondingly smaller than the maximum natural chloride value. The minimum agriculture percentage is the minimum agriculture chloride value divided by the total chloride concentration multiplied by 100. The range in the agriculture percentage reflects the range in the two agriculture chloride values plus the estimated maximum analytical error. Sample date is year-month-day.
| Network site-well |
Sample date |
Chloride, mg/L | Agriculture, minimum, % |
Agriculture, % range |
|||
|---|---|---|---|---|---|---|---|
| Total | Natural, maximum |
Agriculture, minimum |
Agriculture, maximum |
||||
| 2-2 | 84-11-07 | 127 | 76 | 51 | 89 | 40 | 37-74 |
| 2-2 | 91-12-04 | 220 | 74 | 147 | 183 | 67 | 64-85 |
| 5-3 | 83-11-17 | 100 | 34 | 66 | 83 | 67 | 64-85 |
| 5-3 | 84-11-06 | 98 | 38 | 60 | 79 | 61 | 59-83 |
| 27-3 | 84-01-26 | 483 | 56 | 429 | 456 | 89 | 87-95 |
| 27-3 | 84-05-14 | 488 | 54 | 436 | 461 | 89 | 88-95 |
| 27-3 | 84-11-02 | 479 | 52 | 429 | 453 | 89 | 88-95 |
| 27-3 | 86-08-04 | 389 | 51 | 340 | 364 | 87 | 86-94 |
The question arises, could the higher ground-water salinities at the 3 sites in Table 10 represent accumulations of soil salts over long periods of time prior to agricultural activities, and which are now being leached to the ground water by increased amounts of recharge water from irrigation? The depth distribution of clay layers and sandy sections in the soils at the recharge sites appear to have some control on the distribution of soil salinity and nitrate movement (Sophocleous et al., 1990a; Townsend and Marks, 1990; Townsend and Young, 1992). Prior to cultivation, the prairie vegetation was grass with deep roots. The evapotranspiration by these plants could have concentrated some salts in the soils, such as observed in the caliche-like soil layers. An approximate equilibrium of salts leached to the ground water during recharge events balanced by constituent inputs from precipitation and leaching of soil matter could have been reached. Ground-water flow through the aquifer should have been great enough to maintain low chloride concentrations in the shallow ground waters not susceptible to substantial mineral intrusion from below.
Cultivation of the prairie actually allowed increased infiltration of recharge as a result of the removal of the prairie grasses with their long root systems which had been able to utilize deep soil moisture. Some of the accumulated salts in the soils could have been leached into the shallow ground water at a faster rate than natural as a result of cultivation. The presence of irrigation certainly would have accelerated the leaching of any natural soil salts, as well as substantially adding to the salt content by evaporation of the waters spayed above and flooded on the surface, and evapotranspiration of soil moisture near the surface. Thus, whether the original source of increased salinity found in the upper aquifer at the sites in Table 9 is mainly ancient or recent soil salts, agricultural activities are the expected cause for the entrance of the salts to the water table at a rate much greater than before soil cultivation.
Table 10--Relative variations in chloride concentration in samples from observation wells screened in the middle to upper part of the aquifer. The magnitude of the variations are relative to percent changes in the average chloride concentration for samples from the well. The term "constant" indicates no substantial change.
| Site-well number |
Sampling period |
Number of samples |
Relative change in chloride concentration during sampling period |
|---|---|---|---|
| 1-3 | 1978-1990 | 5 | Constant |
| 2-2 | 1978-1991 | 7 | Increase, with rise in increase rate |
| 3-2 | 1978-1984 | 4 | Small increase and decrease |
| 4-3 | 1978-1986 | 5 | Small increase and decrease |
| 5-3 | 1978-1986 | 5 | Constant |
| 6-3 | 1978-1986 | 4 | Increase and decrease |
| 7-3 | 1978-1986 | 6 | Constant |
| 8-3 | 1979-1983 | 2 | Constant |
| 8-4 | 1979-1986 | 5 | Small increase and decrease |
| 9-3 | 1979-1986 | 5 | Small decrease |
| 10-3 | 1979-1983 | 3 | Decrease from first sample, then constant |
| 10-4 | 1979-1986 | 5 | Constant |
| 11-2 | 1979-1986 | 4 | Small decrease |
| 12-3 | 1980-1986 | 5 | Constant |
| 13-3 | 1980-1986 | 5 | Constant |
| 14-3 | 1983-1986 | 3 | Increase and decrease |
| 15-3 | 1982-1986 | 4 | Small increase |
| 16-3 | 1981-1990 | 7 | Fluctuations |
| 17-3 | 1981-1986 | 6 | Fluctuations |
| 18-3 | 1981-1984 | 5 | Appreciable decrease |
| 19-3 | 1983-1991 | 5 | Constant, then small increase |
| 20-3 | 1984-1986 | 4 | Constant, then increase and decrease |
| 21-3 | 1982-1986 | 6 | Increase |
| 22-3 | 1981-1990 | 6 | Small increase |
| 23-3 | 1983-1986 | 4 | Small decrease |
| 24-2 | 1983 | 2 | Constant |
| 25-3 | 1983-1986 | 5 | Constant |
| 26-3 | 1983-1986 | 4 | Constant |
| 27-3 | 1984-1991 | 6 | Constant, then decrease |
| 28-3 | 1981-1986 | 5 | Decrease from first sample, then constant |
| 29-3 | 1981-1986 | 6 | Constant, then increase and decrease |
| 30-3 | 1983-1986 | 4 | Constant, then increase and decrease |
| 31-3 | 1983-1986 | 4 | Small decrease |
| 32-3 | 1983 | 1 | - |
| 32-4 | 1983-1986 | 4 | Decrease |
| 33-3 | 1983-1986 | 4 | Constant |
| 35-3 | 1983-1986 | 5 | Constant |
| 36-3 | 1983 | 1 | - |
| 36-4 | 1982-1986 | 4 | Constant |
| 37-3 | 1983 | 1 | - |
| 37-4 | 1983-1986 | 5 | Constant |
| 38-3 | 1982-1986 | 4 | Constant |
| 39-3 | 1983-1986 | 5 | Decrease, increase, and decrease |
| 40-3 | 1983-1986 | 5 | Small increase |
| 41-3 | 1982-1986 | 5 | Constant |
| 42-3 | 1983-1986 | 4 | Constant |
| 43-2 | 1982-1986 | 5 | Constant |
| 44-3 | 1982-1986 | 4 | Constant |
| 45-3 | 1982-1986 | 4 | Constant |
| 46-3 | 1982-1986 | 4 | Constant |
| 47-3 | 1982-1986 | 4 | Constant |
| 48-3 | 1984-1986 | 4 | Constant |
| 49-3 | 1982 | 1 | - |
| 49-4 | 1982-1986 | 4 | Constant |
| 50-2 | 1987 | 1 | - |
| 50-3 | 1987 | 1 | - |
| 51-2 | 1987 | 1 | - |
| 52-2 | 1987 | 1 | - |
The 3 sites of Table 9 represent only about 6 percent of the total sites in the network. If cultivation before the turn of the century were a major cause of leaching of ancient soil salts at faster rates, would increases in shallow ground-water salinity still be seen? Would the groundwater flow in the aquifer have been great enough to flush and dilute this increased salt input? Is the shallow ground-water flow at sites 2, 5, and 27 slower than the other sites such that possibly higher historical salinities have not been removed? Variations in the salinities of the shallow ground waters play an important role in answering such questions. The ground-waters from well 27-3 have generally markedly decreased in salinity since first sampling. The chloride content of 2 samples collected in 1990 and 1991 samples had dropped to below 300 mg/L (Appendix J), in comparison with 479-488 mg/L in 1984 (Table 9). Sulfate was determined in the 1984-1986 samples. The increase in sulfate concentration observed during this time compared to the decrease in chloride does not fit fluctuations in salinity from changes in the amount of salinity from deeper waters. The relatively rapid changes suggest that more recent agricultural activities are important in salinity effects.
During 1978 to 1991, the chloride content of waters from well 2-2 increased from 72 to 220 mg/L (Appendix H and Table 9). Nitrate concentrations of the waters also steadily increased and sulfate values rose at a rate faster than could be explained by effects of deeper, natural saline water, fining recent agricultural activities as the source. The initial 72 mg/L chloride observed in 1978 fits quite closely with the 76 mg/L value calculated from mixing-curve intersection (Figure 10 and Table 9). Additional information supporting agricultural sources of salinity in the shallow ground waters at site 2 can be found in Whittemore (1991).
Samples were collected at different times for nearly all of the shallow wells and some of the intermediate level wells in the aquifer to determine whether the concentrations of major and selected minor constituents varied. Many multiple samplings were also made for the deep aquifer and bedrock wells, primarily to determine whether representative samples had been collected. The data from the analyses of the Groundwater Management District (Appendix J) were used to help determine water-quality variations, with the consideration of the greater errors in these values than for those of the Survey.
Ground waters in the bedrock are probably too deep to exhibit appreciable temporal variations in quality related to short-term changes in recharge. Increases in the salinity of waters collected at different times from several of the bedrock wells probably reflect more representative sampling of the ground water in the vicinity of the screened interval. The pumping rate possible from many of the bedrock wells was small because the sediments were generally silty with a substantially lower permeability than the overlying aquifer. This resulted in a longer time needed to completely remove all water introduced during drilling and well installation.
Samples from the bedrock wells at sites 7 and 11 exhibited anomalous variations. At site 7, the second of the 3 samples had a much lower total-dissolved-solids concentration than the first and last samples. The chloride value for the last sample agreed within 3 percent of the value for the first sample. A concentration of 34,200 mg/L was therefore used in the chloride contour diagram. The chloride concentration at site 11 greatly rose from 6,930 to 25,000 mg/L, dropped to 4,460 mg/L over a span of five years, and then increased to 4,830 mg/L during the two years prior to the last sample collection. The variations in chloride may indicate different amounts of induced downward movement of fresher water from the overlying aquifer by pumping for sample collection. The tops of the screened intervals of the wells at sites 7 and 11 are 80 ft and 29 ft below the depth to bedrock, respectively, thus, if mixing with fresher water is the explanation for the salinity variations in these two wells, the fresher water would have to pass through a substantial amount of Permian strata. The possibility exists that the grouting between the top of the screen and the aquifer does not completely seal the interval, allowing fresher water from the aquifer base to mix with the ground water from the bedrock during pumping. The value of 4,460 mg/L chloride after several sampling times was used to estimate the chloride content at the aquifer base at this site, because no well was installed to sample the lower aquifer.
At site 41, the chloride content of ground water from the bedrock well steadily decreased during the sampling period until the last sample. The chloride concentration determined by the KGS and the GMD5 in the samples from the last collection date appreciably differed. Assuming that the error in the GMD5 value is no greater than 20 percent and that the samples were waters collected one after another rather than split from the same sample, the results suggest that the salinity of the water changes during pumping. The changes might be caused by mixing of fresher aquifer waters drawn down towards the screened interval by pumping. The bedrock depth is relatively shallow at site 41 and the top of the screened interval of the well is only 15 ft below the interface between the bedrock and the aquifer. The specific conductance of water from the bedrock at sites 7, 11, and 41 should be monitored continuously during pumping, if any additional samples are collected, to determine whether the variations are or related to pumping stress.
Most waters collected at different times from the aquifer-base wells that were sampled more than once contained chloride concentrations that were nearly constant considering analytical error. An appreciable increase in chloride content occurred with time in samples collected in 1983-1985 from the deep aquifer well at site 23. However, the sample collected and analyzed by the GMD5 in 1986 had essentially the same chloride as the previous sample for 1985, suggesting that the last samples are representative of deep aquifer water at this location. Small increases were observed for the aquifer-base waters at sites 9 and 29. These increases could possibly be related to the upconing of deeper, more saline water present at each site during pumping for sampling.
The chloride concentration in the second sample from the aquifer-base at site 6 was substantially smaller than in the initial sample. The bottom of the screen in the deep well at the site is only 3 ft above the bedrock surface. A possible explanation for the salinity decrease is a greater mixing of fresher aquifer waters with saline water just above the bedrock during the second pumping. This would be facilitated if the saline water layer above the bedrock was thin and the bedrock permeability is low at site 6.
Four to 5 samples were collected during 1978-1986 from most, and 5-7 samples collected during 1978-1992 for several of the upper-aquifer wells in the observation network (Table 10). Only one to 3 samples were taken from the intermediate depth wells in the aquifer. The relative changes in chloride concentration for the middle to upper part of the aquifer summarized in Table 10 indicate that no consistent pattern of variations were observed across the well network in the upper part of the aquifer during this time. Chloride contents at some sites remained relatively constant, others decreased, some increased, while still others fluctuated. The most common variation for the 1978-1986 interval was a decrease at the end of the period. The 5 sites at which samples were collected after 1986 exhibited increases, a decrease, or were constant. Variations in sulfate concentration during the same period were less pronounced than those for chloride.
Sites with observed variations in chloride concentration are located in the middle to northern part of the observation well network, while most of the sites in the southern part of the network, where bedrock and aquifer waters tend to have lower dissolved solids, exhibited no substantial changes in chloride. Thus, variations may be more pronounced where changes in ground-water quality with depth are greater. The increase in salinity at site 2 has been attributed primarily to leaching of soil moisture concentrated by evapotranspiration (Whittemore, 1991). Site 27, another location where agricultural activities appear to have contributed to ground-water chloride, showed an appreciable decrease in chloride from 479-488 mg/L in 1984 to 268-290 during 1990-1991. The large decrease does not correlate with changes at other sites, further suggesting that much of the salinity is anthropogenic, was higher in the past, and is now being diluted. The overall patterns in the variations in the observation well network suggest that differences in recharge and local anthropogenic effects with time and from site to site during the sampling period are currently more important in affecting salinity variations of the shallow aquifer waters than a network-wide change from pumping stresses.
Nitrate was determined for at least one sample from all of the network wells, ammonium ion and phosphate for most of the wells, and nitrite for many of the wells. Ranges observed in the nutrient species concentrations are listed in Table 5. Nitrate concentrations in the ground water generally decrease with depth in the aquifer and from the aquifer to the bedrock. The greater decrease is from the upper aquifer to the aquifer base. The lowest nitrate concentrations usually occur in the ground waters with the highest chloride content (Figures 11-13). A general inverse relationship between chloride and nitrate occurs in waters from the aquifer base and underlying bedrock suggesting that fresher waters from recharge tend to be related with higher nitrate.
The distribution of nitrate concentrations indicates that the maximum background nitrateN is less than 4 mg/L (Figures 11-13). Only one bedrock well yielded water with greater than 3.6 mg/L and only two wells gave water with more than 3 mg/L nitrate-N for the last samples collected from the aquifer base. Many of the upper aquifer waters contained greater than 3 mg/L nitrate-No Samples from the shallowest wells at sites 17, 27, 39, 40, and 50 contained nitrate greater than the maximum drinking-water limit of 10 mg/L, although the value at site 50 (10.6 mg/L) was close to the standard. Only site 27 of these 5 had an identifiable increase in chloride from agricultural activities. Nitrate concentrations were either nearly constant or generally increased in the upper aquifer during the data period. The sites with high nitrate tended to show increases. For example, the nitrate- N increase was 51 to 73 mg/L at site 27 during 1982-1984, even though the chloride concentration decreased from 483 to 389 mg/L in the same period.
Figure 11--Relationship between nitrate and chloride concentrations for Permian bedrock waters from the observation well network. The horizontal dashed line represents the maximum contaminant limit (10 mg/L) for nitrate-N in public drinking-water supplies.
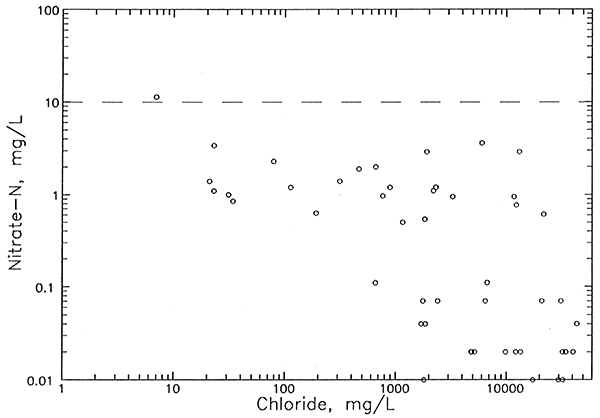
Figure 12--Relationship between nitrate and chloride concentrations for aquifer-base waters from the observation well network. The horizontal dashed line represents the maximum contaminant limit (10 mg/L) for nitrate-N in public drinking-water supplies.
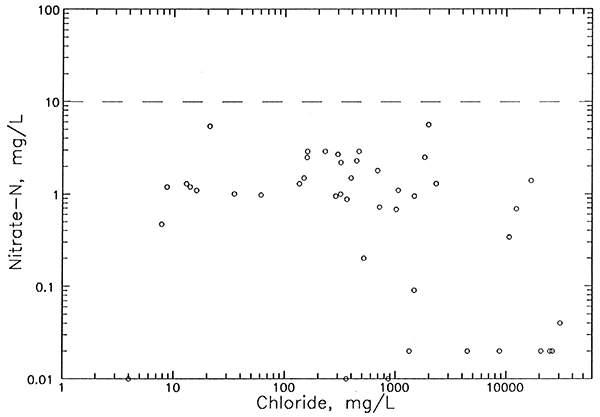
Figure 13--Relationship between nitrate and chloride concentrations for upper aquifer waters from the observation well network. The horizontal dashed line represents the maximum contaminant limit (10 mg/L) for nitrate-N in public drinking-water supplies.
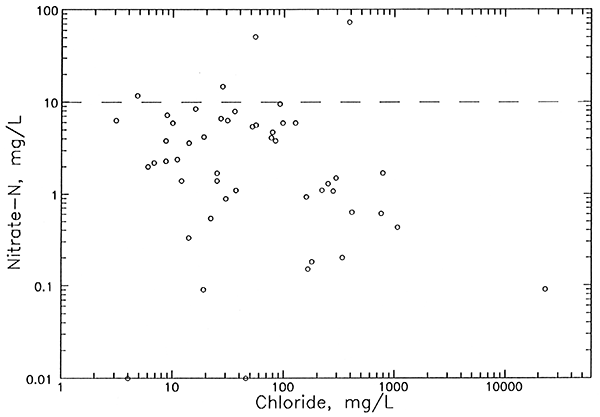
The nitrate-N content of about 11 mg/L in the bedrock water at site 34 is anomalously high in comparison with the values for the bedrock wells at all the other sites and the low nitrate for the aquifer well at site 34. The bedrock well at this site yields fresh waters with a low chloride content. The site area is surrounded by saline bedrock waters as shown on Plate 1. Recharge by oxygenated waters that have flushed saline waters from the bedrock and are oxidizing ammonium ion adsorbed on the sediments might be the cause of the anomalous nitrate.
Dissolved ammonium ion levels generally increase with depth in the aquifer and into the bedrock, reflecting more reducing conditions (lower dissolved oxygen) with depth (Table 5). Higher ammonium ion levels were associated with low nitrate concentrations. Ammonium ion concentrations were below 1 mg/L as nitrogen in most of the bedrock wells but were in the 3-4.8 mg/L range at 5 network sites. The total-dissolved concentration of all nitrogen species at the aquifer base is substantially less than the ammonium ion concentration in the bedrock water at 4 of these sites. The other network site does not include an aquifer base well but the total-dissolved nitrogen in the upper aquifer well is also appreciably less than the ammonium ion content in the bedrock well water. This indicates that most of the ammonium ion is derived from the Permian sediments and not the aquifer. Oxidation of ammonium ion in the bedrock sediments is probably the source of much of the nitrate in bedrock waters.
Nitrite contents are low in both aquifer and bedrock waters. No discernible pattern was observed in dissolved nitrite with depth although the data are more limited than for the other nutrient species. Most of the nitrite-N concentrations were less than 0.01 mg/L. The highest nitrite-N was 0.3 mg/L in the bedrock water at network site 48 which also contained detectable nitrate and ammonium ion. The aquifer base well at site 48 also contained nitrite, although at a near-detection level. No recognizable pattern exists for dissolved orthophosphate with depth; concentrations as phosphate-P were generally less than 0.2 mg/L. The higher concentrations of orthophosphate in a few of the earlier samples from the observation wells might reflect traces of drilling water. Ferric oxyhydroxide coatings on the sediment particles, especially in the Permian red beds, can readily adsorb phosphate and probably control its concentration.
The primary source of mineralized water in the Great Bend Prairie aquifer is dissolution of Permian evaporites. The chemical water type is Na-Cl, reflecting the main salinity source of dissolved halite. Water quality in the Permian bedrock underlying the unconsolidated aquifer ranges from saltwater in the northwest and central portions of the observation well network to fresh in the southernmost area. Fingers of more saline water in the bedrock appear to be related to bedrock channels and discharge zones, while protrusions of less saline water occur in bedrock highs and beneath recharge zones in the overlying aquifer.
The saline water in the lower part of the unconsolidated aquifer is derived from intrusion of saltwater from the Permian rocks. The distribution pattern of the saline water at the aquifer base indicates that saltwater intrusion occurs where Permian bedrock, especially the Cedar Hills Sandstone, underlies the aquifer. Cretaceous rocks in the western portion of the study area restrict saltwater intrusion. However, not all aquifer areas are as saline as would be expected from comparison of saline water distribution in the Permian bedrock immediately underlying the aquifer. Aquifer recharge areas are important in restricting mineral intrusion in these locations. The resulting area of saline water at the aquifer base is appreciably smaller than that for the Permian.
Water in the upper part of the unconsolidated aquifer is generally fresh except in the northeastern portion of the observation well network. Saline water intrusion to the shallow depths of the aquifer is mainly controlled by discharge along streams, especially Rattlesnake Creek and parts of the South Fork of the Ninnescah River and the Arkansas River, and in the Big and Little Salt marshes. The saline water is more concentrated and widespread in areas of shallow water tables in northeast Stafford, northwest Reno, and southwest Rice counties.
The salinity of ground waters in the unconsolidated aquifer increases with depth, but at greatly different rates. Comparison of the chloride distribution patterns for the upper aquifer and aquifer base reveal areas with great contrasts in salinity. Saltwater intrusion to the base of the aquifer in these areas has not dispersed into the upper aquifer, possibly due to protection by low permeability clays or lateral ground-water flow that minimizes the time for upward dispersion of salinity. High contrast locations include north-central Stafford County, a band along the Stafford-Reno county line south from Peace Creek, and northeast and north-central Pratt County. The area of townships T. 21 and 22 S., R 12 W. and the eastern halves of townships T. 21 and 22 S., R. 13 W. in north-central Stafford County exhibit the greatest salinity increase with depth. These areas are expected to be especially vulnerable to upconing of saline waters pumped by irrigation wells screened in the lower aquifer. The actual amount of upconing will be controlled by the presence or absence of clay layers in the lower aquifer.
The salinity of aquifer waters has been increased by local contamination from oil-field brines and agricultural activities. The regular distribution of well sites in the observation network near township-range comers approximates a random sampling of the aquifer, allowing a general assessment of contamination across the study area. Identifiable contribution to groundwater salinity by oil brine was found in waters from 8 wells at 6 of the 52 sites in the observation well network. The oil brine affected the salinity of the mid to upper aquifer at 3 of these sites and the lower aquifer at the other 3 sites. Oil-brine pollution has made water unusable for irrigation and drinking supply in the lower part of the aquifer at only one site, whereas the natural chloride concentration in parts of the aquifer at 4 of the other sites with oil brine is already too high for these uses. The results suggest that about 12 percent of the region within the network might be expected to have oil-brine contamination at some depth in the aquifer, because oil fields cover a substantial percentage of the network area in addition to the sites with contamination. However, the distribution of the expected pollution could range appreciably, with a near zero percentage in locations distant from oil fields to greater than 12 percent within some oil fields. The presence of oil brine in the aquifer at 3 additional locations described in this report support the expectation of oil-brine contamination at other places besides the network wells.
Agricultural activities appear to have substantially increased the chloride concentration of ground water in the upper aquifer at 3 sites in the observation well network. The expected natural chloride concentration is well below 100 mg/L at all these sites and the sites do not occur within oil fields. The agriculturally related increase in chloride concentration has made shallow ground water unusable for irrigation and drinking use at one site. The increases in chloride are associated with nitrate contents that are higher than expected for background in the aquifer. Leaching of salts concentrated in soils by evapotranspiration of irrigation waters and from fertilizers appear to be a major source of the salinity and nitrate increases. If the 3 sites are representative of the GMD5 region, then approximately 6 percent of the network area could have ground waters in the upper aquifer with salinity significantly affected by agricultural activities. The fact that other investigations within the network area have shown even greater salinity increases in wells screened closer to the water table than the network wells suggests that the 6 percent value may underestimate salinity increases at the aquifer top.
Background values for dissolved nitrate-N in the aquifer are typically less than 2 mg/L but can sometimes approach 4 mg/L. Nitrate concentrations in the ground water generally decrease with depth in the aquifer and from the aquifer to the bedrock. Upper aquifer waters at 5 network sites contained nitrate-N greater than 10 mg/L. This suggests that nearly 10 percent of the network area had nitrate concentrations exceeding the drinking-water limit in the upper aquifer at sometime during the 1980's. Only one of the sites with nitrate-N above 10 mg/L had an identifiable increase in chloride from agricultural activities. Nitrite-N contents are low in both aquifer and bedrock waters; most are <0.01 mg/L. Dissolved ammonium ion levels generally increase with depth in the aquifer and into the bedrock, reflecting more reducing conditions (lower dissolved oxygen) with depth. Although ammonium ion concentrations were below 1 mg/L as nitrogen in most of the bedrock wells, the presence of 3-4.8 mg/L ammonium-N at 5 sites indicates that the upper limit of natural dissolved nitrogen could be higher in the bedrock than in the lower aquifer. Oxidation of ammonium ion in the bedrock could be the source of much of the nitrate in bedrock waters, and in aquifer-base waters where upward flow occurs from the Permian.
There is no clear direction in the chloride concentration variations for the region as a whole during the period of available data (mainly the 1980's). Chloride concentrations were nearly constant at many network well sites, while many others had increases and/or decreases. Nitrate concentrations were either nearly constant or generally increased in the upper aquifer during the data period. The well sites with high nitrate tended to show increases. Chloride concentrations both increased and decreased in upper aquifer waters with nitrate concentrations above the background. The water-quality changes appear to be related more to the local site conditions than to the environment of the network region. Natural sources of salinity vary from changes in recharge and discharge in the system and from pumping stresses. Oil-brine and agricultural sources of chloride and nitrate also will vary from these factors, as well as the rate of contamination input or effects. Additional sampling of the network sites at which increased salinity was found from anthropogenic activities should be useful for further understanding changes in the salinity distribution. A couple of the bedrock wells in the network for which anomalously low salinities were obtained and which were only sampled once should be resampled to determine whether the existing data are representative.
Bayne, C.K., 1956. Geology and ground-water resources of Reno County, Kansas: Kansas Geological Survey, Bulletin 120, 130 p. [available online]
Burrton Task Force, 1984. Proposed Burrton intensive groundwater use control area: Available from Kansas Department Health and Environment, Topeka, Kansas, 103 p.
Cobb, P.M., 1980. The distribution and mechanisms of salt water intrusion in the fresh water aquifer and in Rattlesnake Creek, Stafford County, Kansas: MS thesis, Department of Civil Engineering, University of Kansas, Lawrence, 176 p.
Fader, S.W., and Stullken, L.E., 1978. Geohydrology of the Great Bend Prairie, south-central Kansas: Kansas Geological Survey, Irrigation Series 4, 19 p. [available online]
Fent, O.S., 1950, Geology and ground-water resources of Rice County, Kansas: Kansas Geological Survey, Bulletin 85, 142 p. [available online]
Gillespie, J.B., Hargadine, G.D., Myers, N.C., and Hargadine, D.A., 1991. Geohydrologic data for the South Fork Ninnescah River valley and adjacent plains in Pratt and Kingman counties, south-central Kansas: U.S. Geological Survey, Open-File Report 91-186, Lawrence, Kansas, 55 p. [available online]
Hathaway, L.R., Galle, O.K., Waugh, T.E., and Dickey, H.P., 1978. Chemical quality of irrigation waters in Ford County and the Great Bend Prairie of Kansas: Kansas Geological Survey, Chemical Quality Series 7, 41 p. [available online]
Kansas Geological Survey, 1989a. Oil and gas fields, Great Bend Quadrangle in Kansas, Map M 18-7.
Kansas Geological Survey, 1989b. Oil and gas fields, Pratt Quadrangle in Kansas: Kansas Geological Survey, Map M 18-10.
Lane, C. W., 1960. Geology and ground-water resources of Kingman County, Kansas: Kansas Geological Survey, Bulletin 144, 174 p. [available online]
Latta, B., 1950. Geology and ground-water resources of Barton and Stafford counties, Kansas: Kansas Geological Survey, Bulletin 88, 228 p. [available online]
Layton, D.W., and Berry, D.W., 1973. Geology and ground-water resources of Pratt County, south-central Kansas: Kansas Geological Survey, Bulletin 205, 33 p. [available online]
Rosner, M.L., 1988. The stratigraphy of the Quaternary alluvium in the Great Bend Prairie, Kansas: MS thesis, Department of Geology, University of Kansas, Lawrence, 183 p.
Sophocleous, M.A., and McAllister, J.A., 1990. Hydrologic-balance modeling of the Rattlesnake Creek watershed, Kansas: Kansas Geological Survey, Ground Water Series 11, 72 p. [available online]
Sophocleous, M.A., Townsend, M.A., Orountiotis, C; Evanson, R.A., Whittemore, D.O., Watts, C.E., and Marks, E.T., 1990. Movement and aquifer-contamination potential of atrazine and inorganic chemicals in central Kansas croplands: Kansas Geological Survey, Ground Water Series 12, 64 p. [available online]
Sophocleous, M.A., Townsend, M.A., and Whittemore, D.O., 1990, Aquifer contamination potential of atrazine in central Kansas croplands: Journal of Hydrology 115: 115-137.
Sophocleous, M.A., Arnold, B., McClain, T., and Stern, A., 1993. Configuration of the pre-Cenozoic bedrock surface of the Great Bend Prairie Region of Kansas: Kansas Geological Survey, in press.
Stullken, L.E., and Fader, S.W., 1976. Hydrogeologic data from the Great Bend Prairie, southcentral Kansas: Kansas Geological Survey, Basic Data Series, Ground-Water Release No. 5, 50 p.
Townsend, M.A., and Marks, E.T., 1990. Occurrence of nitrate in soil and ground water in sandy soils in south-central Kansas: Proceedings of National Water Well Association, 1990 Cluster Conferences, Agricultural Impacts on Ground Water Quality Session, Feb., 1990, Kansas City, MO, p. 145-157.
Townsend, M.A., and Young, M.A., 1992. Factors affecting nitrate concentrations in ground water in east-central Stafford County, Kansas: Kansas Geological Survey, Open-File Report 92-34, 35 p. [available online]
Whittemore, D.O., Sophocleous, M., Bryson, W.R., Schoof, J., and Bell, T.C., 1985. An interagency study of oilfield brine pollution in Kansas: Groundwater Contamination and Reclamation Symposium, Amer. Water Resources Assoc., p. 109-116.
Whittemore, D.O., 1984. Geochemical identification of salinity sources; in, R.H. French (ed.), Salinity in Watercourses and Reservoirs (Proceedings of the International Conference on State-of-the-Art Control of Salinity): Ann Arbor Science, Butterworth Publishers, Stoneham, MA, p. 505-514.
Whittemore, D.O., 1988, Bromide as a tracer in ground-water studies: Geochemistry and analytical determination: Proceedings Ground Water Geochemistry Conference, National Water Well Assoc., Dublin, OH, p. 339-360.
Whittemore, D.O., 1990a. Geochemical characterization of waters at the Maxedon Lease, Pratt County: Report for Kansas Corporation Commission, 6 p.
Whittemore, D.O., 1990b. Geochemical identification of saltwater contamination at the Siefkes subsidence site: Report for Kansas Corporation Commission, 6 p.
Whittemore, D.O., 1991. Geochemical identification of salinity sources in ground waters at and near site 2 of the observation-well network of Groundwater Management District No. 5: Kansas Geological Survey, Open-File Report 91-61, 15 p. [available online]
Whittemore, D.O. and Hathaway, L.R., 1983. Identification of saltwater sources affecting groundwater from R. Newell irrigation well, Reno County: Kansas Geological Survey, Open-File Report 83-14, 5 pp. [available online]
Whittemore, D.O. and Huggins, D.G., 1987. Chapter 3: Water Quality; in Cheyenne Bottoms: An Environmental Assessment: Prepared by Kansas Biological Survey and Kansas Geological Survey, for Kansas Fish and Game Commission, p. 31-54.
Young, D.P., 1992. Mineral intrusion: Geohydrology of Permian bedrock underlying the Great Bend Prairie aquifer in south-central Kansas: Kansas Geological Survey, Open-File Report 92-44, 47 p. [available online]
Next page: Plates
Kansas Geological Survey, Geohydrology
Placed online Feb. 25, 2016; originally released February, 1993
Comments to webadmin@kgs.ku.edu
The URL for this page is http://www.kgs.ku.edu/Hydro/Publications/1993/OFR93_2/index.html