Kansas Geological Survey, Open-file Report 92-43
KGS Open File Report 92-43
Released 1992
To read this report, you will need the Acrobat PDF Reader, available free from Adobe.
Natural dissolution of bedded salt occurs at shallow depths in many parts of the eastern Permian Basin of the southwestern U.S.A. (Johnson, 1981; Gustavson, Finley, and McGillis, 1980; Hargadine, Balsters, and Luehring, 1979; Walters, 1978). The resulting brines move laterally and vertically under hydrostatic pressure into overlying alluvial aquifers creating a saltwater interface with fresher waters above. Detection and regional geohydrologic characterization of this interface is critical in the management of groundwater in such areas (Buddemeier, Sophocleous, and Whittemore, 1992). The variable conductive properties of the water types can be exploited to locate an interface between them. This report describes results from experiments using a focused induction conductivity logging instrument to detect the interface in monitoring wells located in the Great Bend Prairie Aquifer of the Groundwater Management District No. 5.
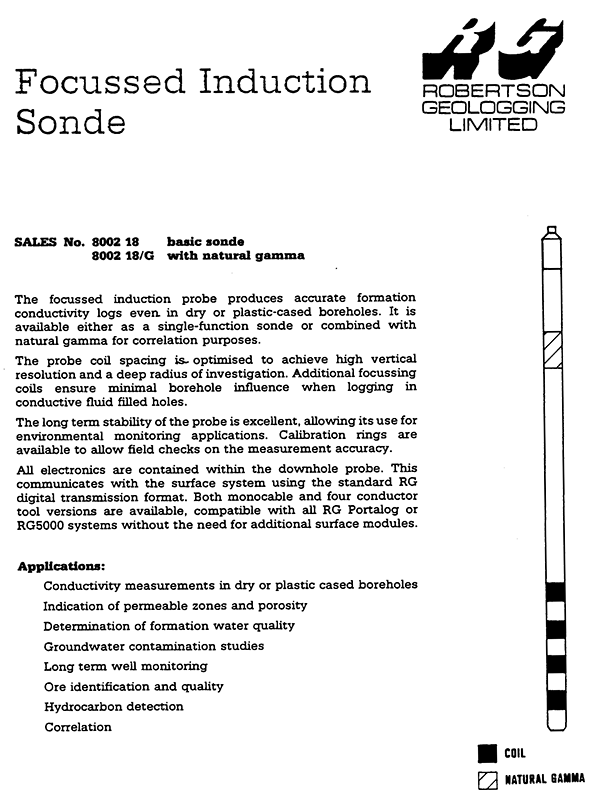
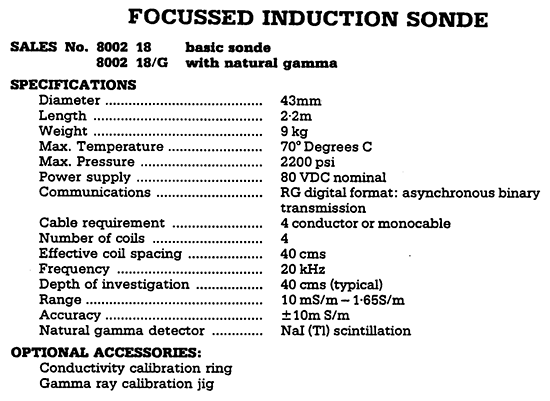
Two fully-screened wells and two sets of three partially-screened monitoring wells, located in northern Stafford County (Fig. 1), were selected for testing. These eight wells were logged in July 1992 using a Robertson Geologging, Ltd. focused induction sonde with digital interface data recording (see Appendix I for specifications). This instrument is designed to be most sensitive to formation conductivity at a radial distance of approximately 40 cm. Therefore, this instrument should be unaffected by the nature of the borehole fluid in these plastic cased wells. A schematic representation of the logging process is shown in Figure 2.
Figure 1--A. Location of test sites on a map of the bedrock beneath the Great Bend Prairie Aquifer, showing the areas in which the Permian formation has the potential to contribute salt water to the overlying aquifer. B. Vertical section from west to east across the region, showing the relation of the alluvial Great Bend Prairie Aquifer to the underlying Dakota and Permian formations.
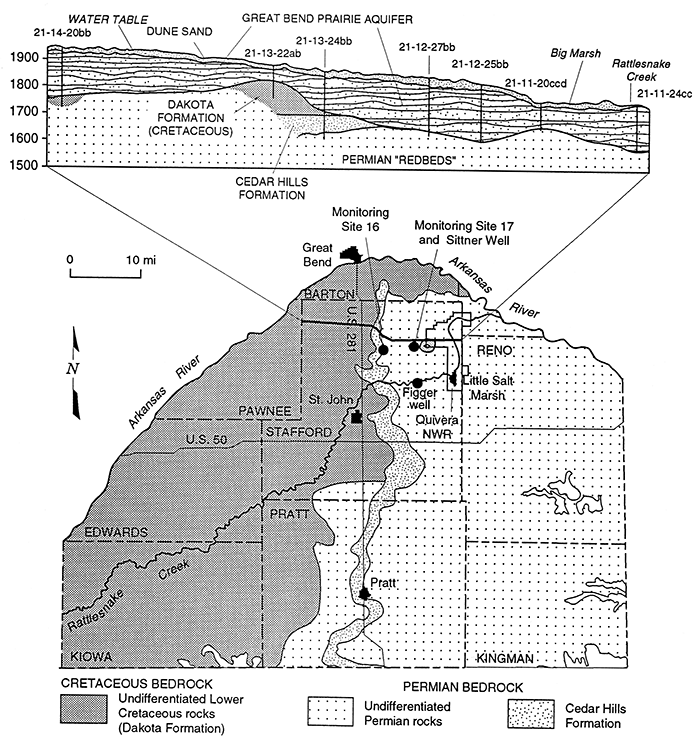
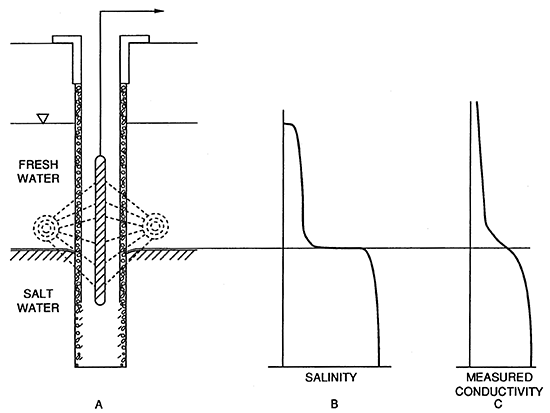
Figure 2--Schematic representation of focussed induction logging. A: the tool is designed to be sensitive to the response of the aquifer to electromagnetic fields at a distance outside of borehole disturbances. If a homogeneous aquifer contains a salt-water interface as shown in B, then the logging process will produce a record that looks likes C.
Initial duplicate logging runs in the same well revealed a baseline drift in conductivity of between 50 to 100 millisiemens per meter (mS/m). This drift is suspected to have been caused by temperature variations of the sonde. This offset was virtually eliminated by allowing the sonde to equilibrate with the well temperature in the bore hole before external calibration and downhole measurements.
For comparison, the location of the interface in the two fully-screened wells was also determined at the same time by measuring the depth profile of the borehole fluid conductivity.
The resulting conductivity logs are shown with vertical lithologic and natural gamma ray logs recorded when the wells were completed in Figures 3A to C. When necessary, the plots were normalized in order to remove between-hole variations in baseline. This process offset (less than 15 mS/m) the least varying conductivity region in all records to the value of the record in the same region with the lowest, yet still continuously positive profile. Plots of the comparable borehole fluid conductivity measurements in the fully-screened wells are shown in Figures 4A and B.
Figure 3A--Lithologic, gamma ray, and conductivity logs for the Figger well.
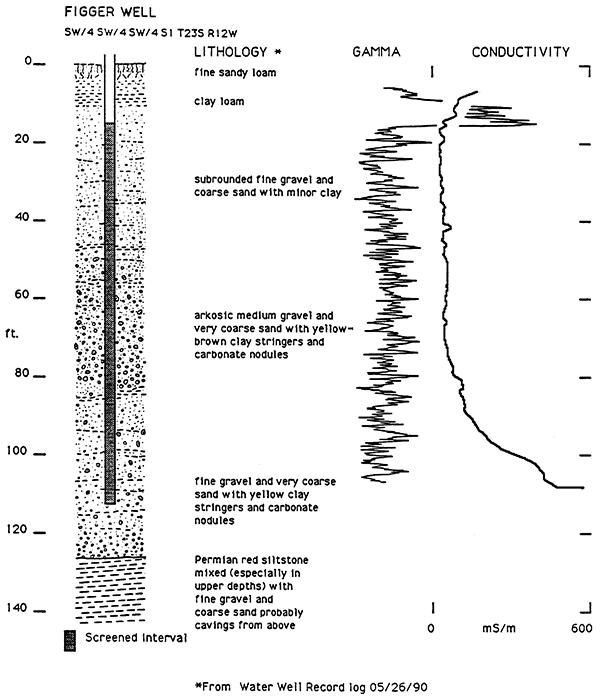
Figure 3B--Lithologic, gamma ray, and conductivity logs for the Monitoring Site 17 and Sittner wells.
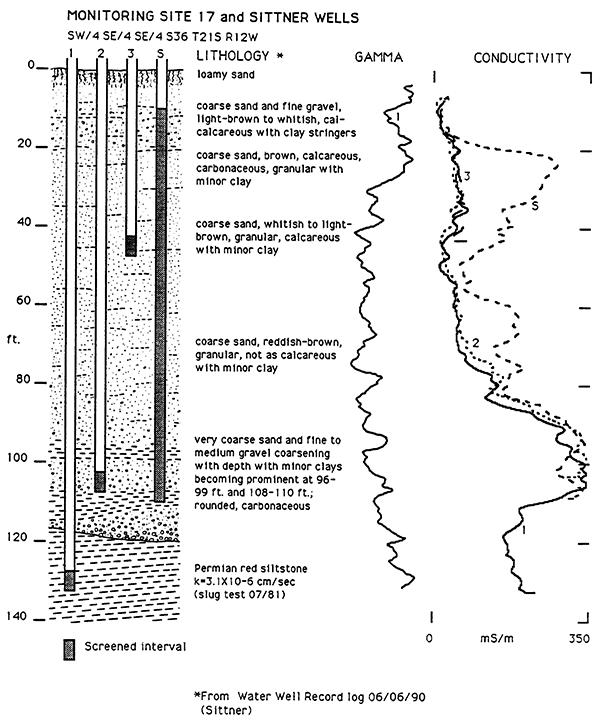
Figure 3C--Lithologic, gamma ray, and conductivity logs for the Monitoring Site 16 wells.
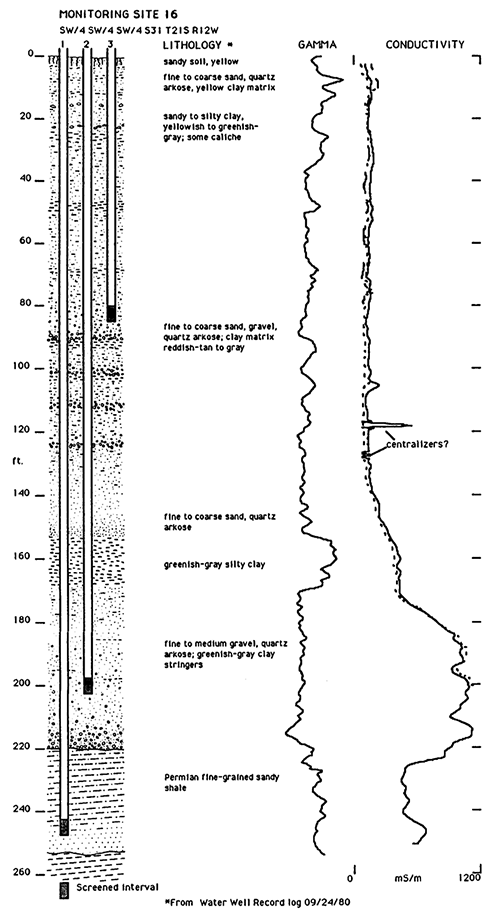
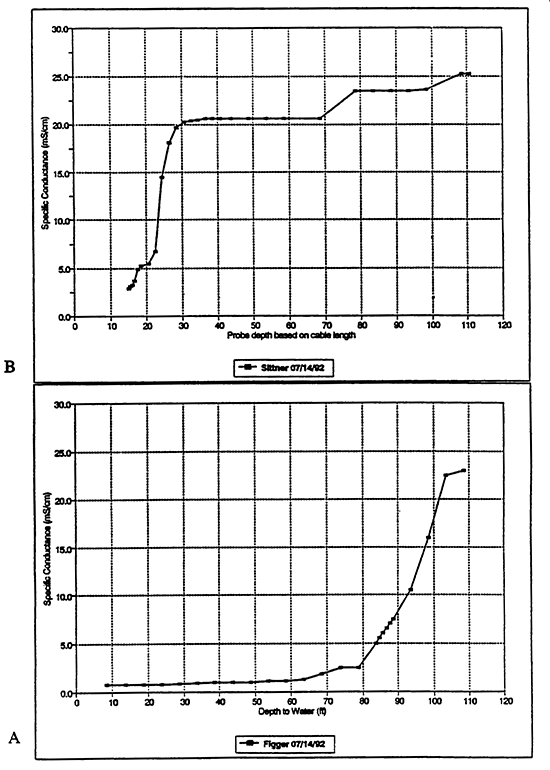
Figure 4--Borehole fluid conductivity profiles for the Figger (A) and Sittner (B) wells.
The general increase and abrupt rise in conductivity with depth indicates the presence of a saltwater interface within the alluvial aquifer. All of the partially-screened monitoring wells that penetrate the interface showed very reproducible patterns. Conductivity measurements were unaffected by the location of the 5-foot long screened interval in the upper and lower alluvial or bedrock monitoring wells and by the borehole fluid conductivity variations.
Similar conductivity profiles were obtained for the fully-screened Figger well (Figs. 3A and 4A) using both the focused induction sonde and the borehole fluid conductivity measurements. The fully-screened Sittner well induction profile (Fig. 3B) agrees well with the monitoring well profiles at depth, but not near the surface. Sophocleous and Perkins (1992) observed rapid and extensive changes in the borehole interface in this well. This suggests that the actual interface is partially confined and not free to respond to the pressure changes that affected the fully-screened well. We attribute the shallower conductivity anomalies to well-induced interface. movement in the immediate vicinity of the bore hole.
Clay lenses, within the alluvial aquifer, can act to confine the salt water and can also contribute to variations in the background conductivity response detected by the induction method. For example, these effects are indicated just above the interface at Monitoring Site 16 (Fig. 3C). The effect of clay without salt water is seen in the first 15 ft. of the Figger well record (Fig. 3A). Therefore, the observed conductivity is an integration of both the hydrologic and lithologic conductivities. Together with the natural gamma logs, the conductivity logs may also be used to analyze these and other important stratigraphic heterogeneities present in the Great Bend Prairie Aquifer. These measurements together may also prove useful in the hydrostratigraphic characterization of the different Permian bedrock lithologies, encountered in the deep wells, that subcrop beneath and are hydraulically connected to the alluvial aquifer.
This method is very successful in the detection of the saltwater interface in these wells. This type of instrument can be used to locate the saltwater interface in the other wells of the monitoring well network and any other suitably completed well in the Great Bend Prairie Aquifer. This will allow regional mapping of the interface as well as local monitoring of seasonal effects such as the potential upconing of the interface in the vicinity of high capacity pumping wells.
Mats Lagmanson, geophysicist with the AGE Corporation, performed the contract logging for this study. Dan Zehr, geologist for the Groundwater Management District No. 5, provided assistance with the data collection. Marios Sophocleous, Tain-shing Ma, and Samuel Perkins, of the Kansas Geological Survey, performed and supplied the borehole fluid conductivity measurements.
Buddemeier, R. W., M. A. Sophocleous, and D. O. Whittemore, 1992. Mineral Intrusion--Investigation of salt contamination of ground water in the eastern Great Bend Prairie Aquifer: Kansas Geological Survey Open-File Report 92-25, 47 p. [available online]
Gustavson, T. C., R. J. Finley, and K. A. McGillis, 1980. Regional dissolution of Permian salt in the Anadarko, Dalhart and Palo Duro Basins of the Texas Panhandle: Texas Bur. Econ. Geol., Rept. Invest. 106, 39 p.
Hargadine, G. D., R. Balsters, and J. Luehring, 1979. Mineral intrusion into Kansas surface waters: a technical report: Kansas Dept. of Health and Environment, Kansas Water Quality Management Section, Kansas Water Resources Board, 211 p.
Johnson, K. S., 1981. Dissolution of salt on the east flank of the Permian Basin in the southwestern U.S.A.: Journal of Hydrology, v. 54, pp. 75-92.
Sophocleous, M. A., and S. P. Perkins, 1992. Stream-aquifer and mineral intrusion modeling of the lower Rattlesnake Creek basin with emphasis on the Quivira National Wildlife Refuge: Kansas Geological Survey Open-File Report 92-6, 204 p. [available online]
Walters, R. F., 1978. Land subsidence in central Kansas related to salt dissolution: Kansas Geological Survey, Bull. 214, 82 p. [available online]
Kansas Geological Survey, Geohydrology
Placed online Feb. 16, 2016; originally released 1992
Comments to webadmin@kgs.ku.edu
The URL for this page is http://www.kgs.ku.edu/Hydro/Publications/1992/OFR92_43/index.html