Kansas Geological Survey, Open-file Report 94-28f
Part of the Mineral Intrusion Project: Investigation of Salt Contamination of Ground Water in the Eastern Great Bend Prairie Aquifer
A cooperative investigation by The Kansas Geological Survey and Big Bend Groundwater Management District No. 5
KGS Open File Report 94-28f
Released December, 1994
The major source of fresh water in the Big Bend Groundwater Management District #5 (GMD5) is provided by the Great Bend Prairie aquifer. There is concern that the increasing withdrawal of groundwater in the Big Bend Groundwater Management District #5 (GMD5) may cause significant decline of groundwater levels and contribute to the rising of the freshwater-saltwater interface from the saltwater source in the underlying geologic formation. A decline in the available groundwater supply and the deterioration of water quality would eventually result in shortages of freshwater supply in the district if the trend is not stopped by a sound management strategy. However, a clear understanding of the present quantity and quality of the groundwater in the district is necessary before a management plan for sustainable supply can be adequately designed.
The purpose of this research is to study the dynamics of the groundwater system by using available historical data in the region, mathematical modeling, and geostatistical analysis. The results of this research are intended to provide technical support for a management policy for the long-term sustainable groundwater supply.
The specific objectives of this research are:
The study area is situated in the northern part of the Big Bend Groundwater Management District #5 (GMD5) of the state of Kansas as shown in Fig. 1. The area is bounded by the Arkansas River and the Rattlesnake Creek and is approximately 625 mi2 (1600 km2) which covers parts of Barton, Rice, Reno, and Stafford counties. According to the 1990 census of population in Kansas, the total population in Barton, Rice, Reno, and Stafford counties was approximately 100,000. The main agricultural crops are wheat, grain sorghum, corn, and alfalfa hay. Groundwater is used for urban household, livestock, industry, and irrigation. Most of the precipitation falls during the growing season from April through September. The precipitation records from 1955-1992 at the Hudson climatic station show that the mean annual precipitation is about 27.74 in. The study area has a typical continental climate with a wide range of temperatures, rapid evaporation, and variable precipitation. Recharge is mainly from the precipitation and the annual recharge only ranges from 1 to 3 inches, approximately 10% of the annual precipitation (Sophocleous, 1991). Groundwater discharge occur in the vicinity of the Quivira Marsh, and the Arkansas River downstream from the Great Bend and Rattlesnake Creek (Sophocleous, 1992). The primary source of freshwater in the eastern portion of the GMD5 (Fig. 2) is the Great Bend Prairie aquifer which is underlain by Permian red beds (Fig. 3A and 3B) containing brines. There is no effective separation between the Great Bend Prairie aquifer and the Permian red beds east of the boundary of the Cretaceous bedrock. The continuous extraction of fresh water in the upper aquifer may cause upward movement of the deeper saltwater resulting in the deterioration of water quality. Consequently, to maintain a sustainable supply of water of good quality becomes a serious concern to the GMD5 and the State. In 1993, an intensive study site, the Siefkes site (Fig. 4), was developed to provide much needed field data on saltwater intrusion into the freshwater aquifer.
Figure 1--Region of the study area located at the north part of the Groundwater Management District #5.
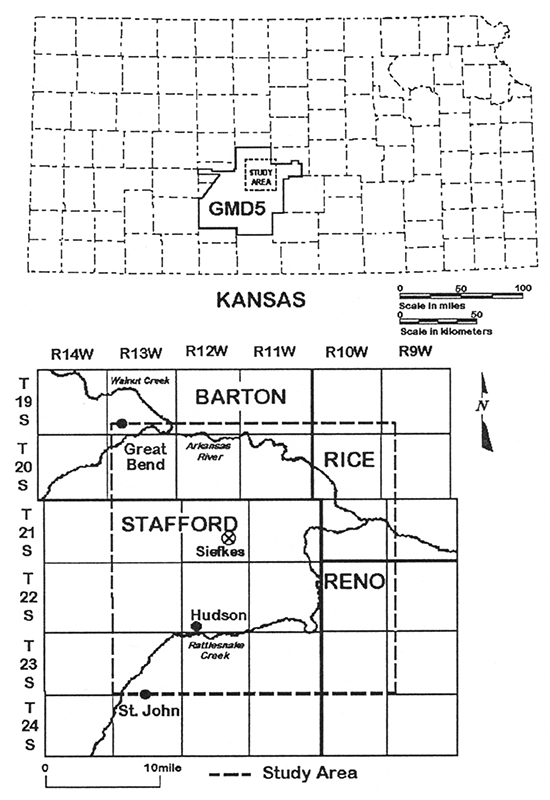
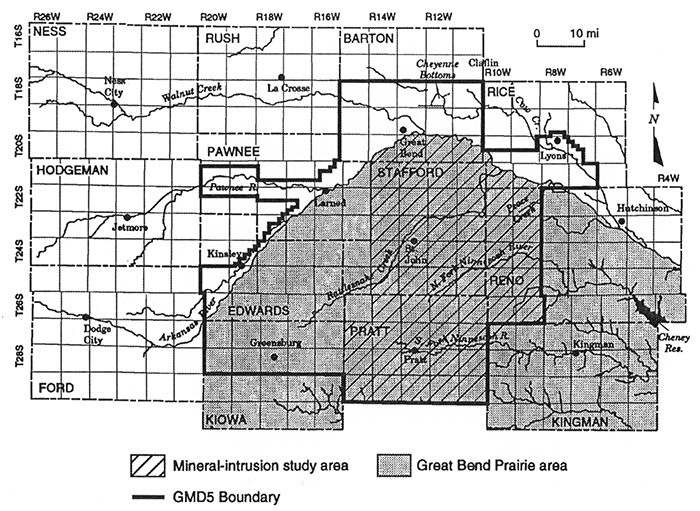
Figure 2--Region of Groundwater Management District #5 and the observed mineral intrusion area.
The main geologic units in the Great Bend Prairie aquifer are described by Latta (1950), Layton and Berry (1973), Fader and Stullken (1978), and Cobb (1980) (Figs. 3A and 3B.). The major geologic units (Fig. 3A) in descending order are the Great Bend Prairie aquifer, the Cretaceous Formations, and the Permian rocks.
Figure 3--Geologic formations of the Big Bend aquifer. A. Vertical section from west to east across the region, showing the relation of the alluvial Big Bend Prairie aquifer to the underlying Cretaceous and Permian strata (Latta, 1950). B. Bedrock geology underlying the Big Bend Prairie aquifer and areas in which the Permian bedrock has the potential to contribute saltwater to the overlying aquifer (Fader and Stullken, 1978).
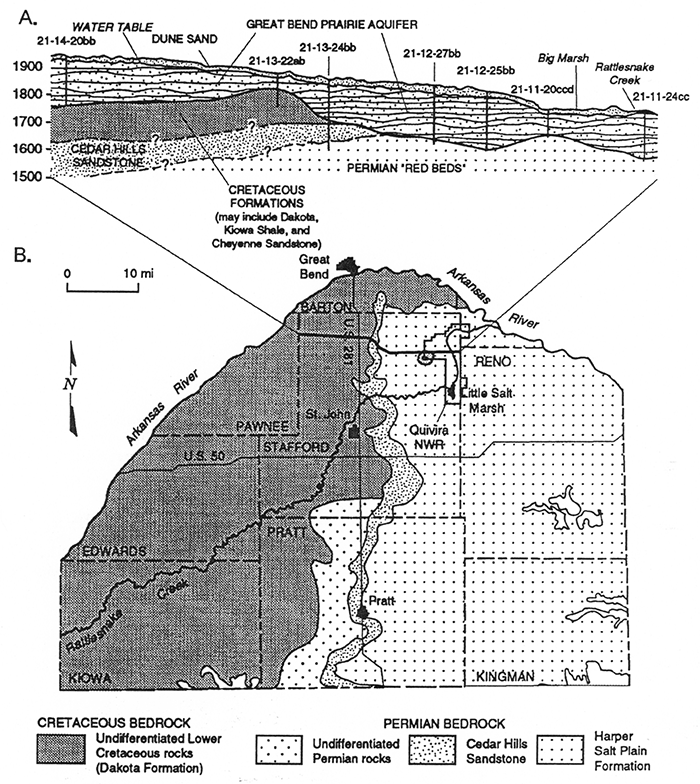
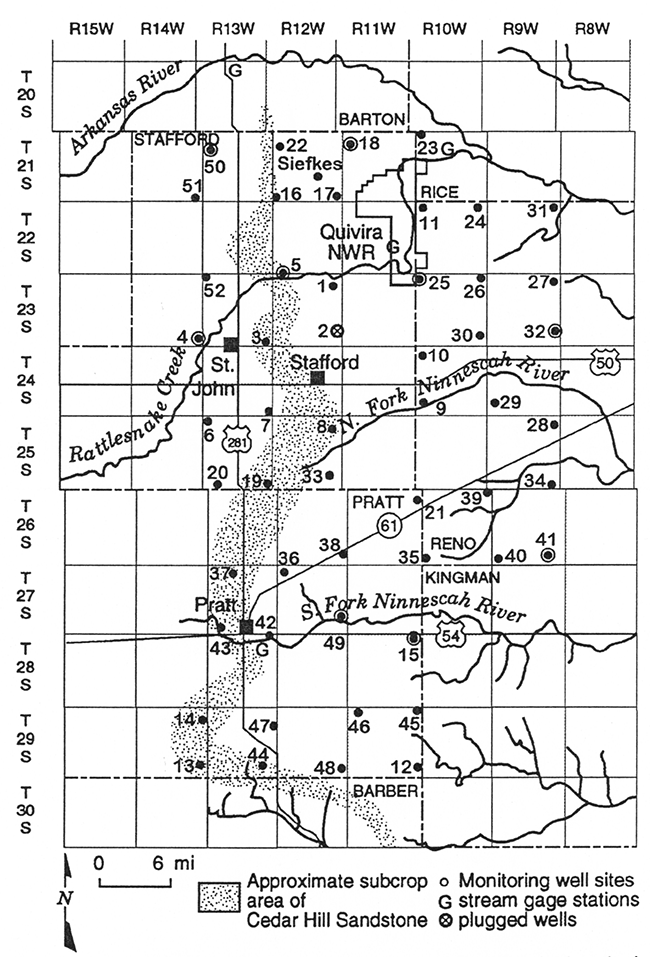
The Great Bend Prairie aquifer is in the drainage basin of the Arkansas River in south-central Kansas. The aquifer consists of alluvial sand, gravel, silt, and clay which were deposited by the ancestral Arkansas River. The thickness of the deposits range from several tens of feet to over 200 feet. The Cretaceous Formation which is known as the Dakota Formation is generally considered a confining or leaky confining layer; it effectively separates the Great Bend Prairie aquifer and the underlying Permian water bearing units. The Permian formations consist of reddish-brown sandstone, siltstone, shale, salt, gypsum, anhydrite and limestone and are known to contain salt water. The saline water rises upward into the unconsolidated aquifer in the lower reaches of the Rattlesnake Creek and increases the salinity of the available groundwater. Roughly east of US-281, the surface aquifer directly contacts with the Permian formation, and a threat of saltwater from the Permian bedrock is a major concern in this area. In addition, Gillespie et al. (1991) indicated that in some places the hydraulic heads in the Permian bedrock are higher than the freshwater table. This phenomenon was verified with observations of the KGS/GMD5 monitoring-well network at sites 2, 4, 5, 15, 41, and 49 (Fig. 4). The direction of groundwater flow can be determined by water level at different locations. The 1991 water-table contour for GMD5 (Buddemeier et al, 1992) indicates that the direction of ground water flow is generally eastward. The upward leakage from the Permian Bedrock has been studied by Cobb et al. (1982). However, the aquifer hydrogeologic properties and hydraulic relationships are still not clear. In addition, unplugged wells, sinkholes, boreholes, and fractures may provide pathways for more rapid contaminant transport (Young, 1992); therefore, estimation of total leakage from Permian bedrock is a difficult task at this time.
Figure 4--The location of Siefkes site and the observation well and other physical features in the area of the KGS/GMD5 monitoring-well network.
The ground-water-level data in the GMD5 are collected by the Kansas Geological Survey, the Division of Water Resources, GMD5, and the U.S. Geological Survey. Most of the wells are measured annually, some are quarterly, and a few well sites are equipped with continuous recorders. In order to avoid the influence from the irrigation pumping, most of the wells are measured in mid-winter. The water level data are published annually by the Kansas Geological Survey.
The bedrock elevation data were collected from the data used by Fader and Stullken (1978); the water-quality monitoring network established by the GMD5 since 1974; and the Kansas Geological Survey bulletins.
The natural gamma activity and formation conductivity in the monitoring well network (Fig. 4) is measured by using an electromagnetic (EM) logging tool (Young, et al., 1993). The data are collected at 0.1 foot intervals to obtain a vertical profile of conductivity. Water levels are also measured and recorded for each well before logging is conducted. The measured conductivity can be converted into its corresponding chloride concentration. A groundwater chloride concentration less than 500 mg/L is good for most general uses and is considered as the target for sustainable groundwater. Because of the noisy conductivity profile form the field measurements, the lowest conductivity value that can be reliably read is about 100 mslm and this value corresponds to a chloride concentration of about 3300 mg/L, which is too salty for most uses. A curve fitting technique is employed to produce a smoothly fitted curve and the location of the 500 mg/L chloride concentration can be estimated (Garneau et al., 1994). The first logging was conducted in March, April, and May, 1993. The Permian well and the deep-aquifer well were logged for most of the well sites; however, well sites 5, 39, and 49 were not logged due to inaccessibility. The results of the logging are documented by Buddemeier et al (1993).
The water level and the location of the saltwater-freshwater interface may vary from year to year, mainly due to the pumpage and yearly recharge. The observed water heads in the shallow aquifer and Permian monitoring wells in January 1994 were greater than or approximately equal to January 1993 due to the unusually high precipitation (high recharge) in 1993. At the Siefkes site, the water level increased 6 feet between April and October 1993, and the measured water level in March-April 1994 was still approximately 4 feet higher than the March-April 1993 level. Although groundwater heads had significant change in 1993, the amount of salt and the characteristics of most transition zones in the Great Bend Prairie aquifer remained rather stable. All the field data discussed above will be analyzed for the numerical model discussed later.
The purpose of this research is to develop a quantitative relationship between groundwater withdrawal and saltwater intrusion based on field data and modeling. The results will then be used to investigate possible best management practices for attaining optimal sustainable groundwater supply for the study area. Sustainable groundwater supply is an estimated amount of supply of freshwater for the study area that is sustainable for a relatively long term without substantial saltwater intrusion.
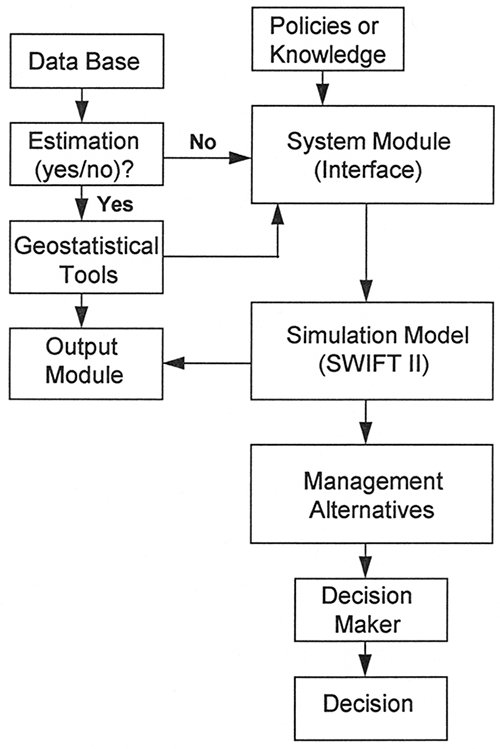
Because the field data in the study area have been collected for quite a long period of time by the GMD5 and the KGS, the management model will integrate the existing data, knowledge, and the mathematical model for evaluating the effects of various management options. The focus will be on the assessment of sustainable groundwater and water quality. Pumping patterns (demand) and precipitation are considered as the two major factors for aquifer discharge and recharge, respectively. Several scenarios will be proposed and based on these two factors to predict the movement of the saltwater-freshwater interface 10 years after the present operating conditions. The usable groundwater is the saturated thickness between the top of the freshwater body to the upper part of the transition zone. Figure 5 is the general structure of this microcomputer-based decision support system. The whole structure consists of the following modules:
1. Database:
The database contains the information on the characteristics of the aquifer, groundwater quality and quantity.
2. Geostatistics:
The geostatistics base serves as a tool for the estimation of the value of each grid point for the simulation model. Three components are included which are the kriging, the cokriging, and the conditional simulation.
3. Simulation Model:
The SWIFT-II model (Reeves, et al., 1986) is a fully-coupled, transient, threedimensional finite-difference model. This code has been verified against eight analytical solutions for heat flow and laboratory results (Ward et al., 1984). In addition, it has been applied to studies of nuclear waste isolation, deep injection (Ward et al., 1987) and mineral intrusion problems (Butow and Holzhecher, 1987). This model is apparently suitable for this study for the simulation of the present condition and trends of salt water interface of the Great Bend Prairie Aquifer
4. System Module
The system module is an user interface and serves as a bridge between the users and the whole system, which allows the users to perform the following tasks:
5. Output Module:
The output module contains several programs to extract and clearly display output from numerical model.
Finally, the system manager will be developed based on the above five components. This will be able to generate feasible decision and to evaluate the various management options.
Figure 5--The general structure of the microcomputer-based decision support system. Database, Geostatistics, Simulation model, System module, and Output module are the five major components in the system.
To read this report, you will need the Acrobat PDF Reader, available free from Adobe.
Kansas Geological Survey, Geohydrology
Placed online Feb. 23, 2016; originally released Dec., 1994
Comments to webadmin@kgs.ku.edu
The URL for this page is http://www.kgs.ku.edu/Hydro/Publications/1994/OFR94_28f/index.html