![]()
Prev Page--Geology || Next Page--Recharge, Discharge
Ground Water
Principles of Occurrence
The following discussion of the occurrence of ground water has been adapted from Meinzer (1923, pp. 2-102) and the reader is referred to his report for a more complete discussion of the subject.
All water beneath the surface of the earth is termed subsurface water. Below a certain level in the earth's crust the permeable rocks are generally saturated with water. The subsurface water that is in the zone of saturation is called ground water, whereas subsurface water above the zone of saturation is called suspended subsurface water or vadose water. The upper surface of the zone of saturation is the ground-water table or simply the water table. Ground water is the water that is available through wells and springs.
The ground water that is available through wells in Wichita and Greeley counties is derived entirely from precipitation that falls as rain or snow within the area or in areas immediately to the west and north. Part of the water that falls as rain or snow is carried away by surface runoff and is discharged as stream flow, and part of it evaporates or is absorbed by growing vegetation and transpired into the atmosphere. The part that escapes runoff, evaporation, and transpiration percolates slowly through the soil and underlying strata and eventually joins the body of ground water in the zone of saturation.
The rocks that form the outer crust of the earth are generally not entirely solid but contain numerous open spaces, called voids or interstices. It is in these spaces that water, natural gas, or oil is found. There are many kinds of rocks and they differ greatly in the number, size, shape, and arrangement of their interstices, and hence in their water-bearing properties. The interstices in rocks range in size from microscopic openings to large caverns, which are found in some limestones. The open spaces are generally connected so that water may percolate from one to another, but in some rocks they are isolated and the water has little or no chance to percolate. The mode of occurrence of ground water in any region is determined, therefore, by the geological character of the region.
Hydrologic Properties of the Water-bearing Materials
Porosity and Specific Yield
The amount of water that can be stored in a rock depends upon the porosity of the rock. Porosity is expressed quantitatively as the percentage of the total volume of the rock that is occupied by interstices. A rock is said to be saturated when all its interstices are filled with water. The specific yield of a water-bearing formation is defined as the ratio of the volume of water that, after being saturated, the formation will yield by gravity to its own volume. The ratio is usually stated as a percentage. Specific yield is a measure of the yield of a water-bearing material when it is drained by a lowering of the water table.
Permeability and Transmissibility
The amount of water a given rock can hold is determined by its porosity, but the rate at which it will transmit water or yield water to wells is determined by its permeability. The permeability of a water-bearing material is defined as its capacity for transmitting water under hydraulic head and is measured by the rate at which the formation will transmit water through a given cross section under a given difference of head per unit of distance. The coefficient of permeability in Meinzer's units may be expressed as the rate of flow of water in gallons a day through a cross-sectional area of 1 square foot under a hydraulic gradient of 100 percent at a temperature of 60°F (Wenzel, 1942, p. 7). The field coefficient of permeability is the same except that it is not corrected for temperature. A rock containing small interstices may be very porous, but water may pass through it with difficulty, whereas a coarse-grained rock, although perhaps less porous, is generally more permeable and allows water to pass through it more freely because interstices are larger. Part of the water in all rocks is held by the force of molecular attraction, which in fine-grained rocks is great enough to hold most of the water against the force of gravity, thus resulting in a very low specific yield.
Gravel is the best water-bearing material in most of the world. Gravel deposits of uniform texture have high porosity, high permeability, and high specific yield. Sand, clay, or silt mixed with the gravel reduces its porosity, permeability, and specific yield. Sand ranks next to gravel as a water bearer. Sand has smaller interstices, however, and conducts water less readily, giving up a smaller proportion of water to wells. Sand particles, because of their small size, are readily carried into wells by water and may create difficult problems in drilling and pumping. The shale and chalk beds of the Niobrara in places contain water along joints and bedding planes, but they are generally unfavorable materials from which to obtain water. Several common types of open spaces or interstices and the relation of rock texture to porosity are shown in Figure 8.
Fig. 8--Diagram showing several types of rock interstices and the relation of rock texture to porosity. A, well-sorted sedimentary deposit having a high porosity; B, poorly sorted sedimentary deposit having low porosity; C, well-sorted sedimentary deposit consisting of pebbles that are themselves porous so that the deposit as a whole has a very high porosity; D, well-sorted sedimentary deposit whose porosity has been diminished by the deposition of mineral matter in the interstices; E, rock rendered porous by solution; F, rock rendered porous by fracturing. (From O. E. Meinzer.)
Most of the ground water pumped in Wichita and Greeley counties comes from sand and gravel beds in the Ogallala formation. Beds in the Ogallala are in places well cemented or may contain large amounts of fine sand, silt, or clay, but where relatively well-sorted deposits of sand and gravel are entered by wells large amounts of water may be obtained.
The coefficient of transmissibility is a function similar to the coefficient of permeability. It is defined as the number of gallons of water a day transmitted through each 1-foot strip extending the height of the aquifer under a unit gradient at the prevailing temperature of the water. The coefficient of transmissibility also may be expressed as the number of gallons of water a day transmitted through each section 1 mile wide extending the height of the aquifer under a hydraulic gradient of 1 foot per mile. The coefficient of transmissibility is equal to the field coefficient of permeability multiplied by the saturated thickness of the aquifer.
Pumping Tests
The permeability and transmissibility of water-bearing materials in Wichita and Greeley counties were determined by four pumping tests using the recovery method developed by Theis (1935, p. 522) and also described by Wenzel (1942, pp. 94-97). The recovery formula is stated as follows:
in which T = coefficient of transmissibility, in gallons per day per foot
q = pumping rate, in gallons a minute
t = time since pumping began, in minutes
t' = time since pumping stopped, in minutes
s' = residual drawdown at the pumped well, in feet, at time t'
The residual drawdown (s') at any time (t) after pumping ceases, is computed by subtracting the static water level, extrapolated from the measurements made before pumping began, from the observed water-level measurement made at time t'. The ratio of log10 t/t' to s' is determined graphically by plotting log10 t/t' against corresponding values of s'. This procedure is simplified by plotting t/t' on the logarithmic coordinate and s' on the arithmetic coordinate of semilogarithmic paper (Fig. 9). If log10 t/t' is taken over one log cycle it will become unity and s' will be the difference in drawdown over one log cycle.
Fig. 9--Curve for pumping test on well 16-35-20ccc obtained by plotting the residual drawdown against t/t'
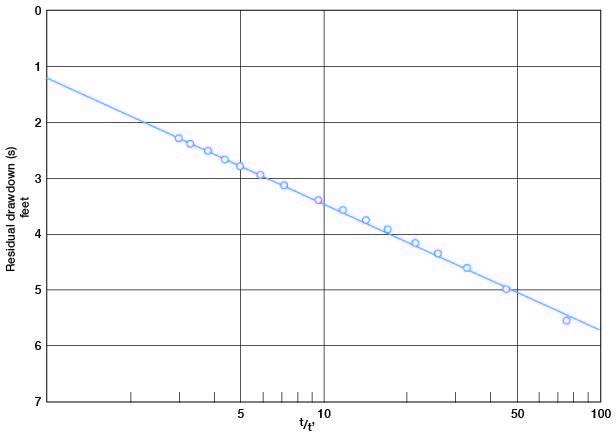
A pumping test on irrigation well 16-35-20ccc was made on August 17, 1948. The well was pumped for about 3 1/2 hours, during which period the pumping rate (average 850 gallons per minute) and the drawdown were measured frequently. Recovery measurements were made for 2 hours after pumping ceased. The data used in the calculation of the coefficients of transmissibility and permeability are given in Table 3.
Table 3--Data on pumping test of well 16-35-20ccc, August 17, 1948.
| Time since pumping began, minutes (t) |
Time since pumping ended, minutes (t) |
t/t' | Yield, gallons per minute (t) |
Depth to water level, feet |
Drawdown, or residual drawdown, feet |
|---|---|---|---|---|---|
| 0 | 110.60 | ||||
| 25 | 810 | 128.35 | 17.75 | ||
| 55 | 827 | 128.78 | 18.18 | ||
| 85 | 826 | 128.98 | 18.38 | ||
| 115 | 819 | 129.09 | 18.49 | ||
| 195 | 818 | 129.25 | 18.65 | ||
| 205 | 1,132 | 134.32 | 23.72 | ||
| 215 | 1,269 | ||||
| 227 | 3 | 75.7 | 116.13 | 5.53 | |
| 229 | 5 | 45.8 | 115.59 | 4.99 | |
| 231 | 7 | 33.0 | 115.20 | 4.60 | |
| 233 | 9 | 25.9 | 114.93 | 4.33 | |
| 235 | 11 | 21.4 | 114.73 | 4.13 | |
| 238 | 14 | 17.0 | 114.51 | 3.91 | |
| 241 | 17 | 14.2 | 114.34 | 3.74 | |
| 241 | 21 | 11.7 | 114.16 | 3.56 | |
| 245 | 26 | 9.6 | 113.98 | 3.38 | |
| 250 | 36 | 7.2 | 113.72 | 3.12 | |
| 270 | 46 | 5.9 | 113.53 | 2.93 | |
| 280 | 56 | 5.0 | 113.38 | 2.78 | |
| 290 | 66 | 4.4 | 113.26 | 2.66 | |
| 305 | 81 | 3.8 | 113.10 | 2.50 | |
| 320 | 96 | 3.3 | 112.97 | 2.37 | |
| 335 | 111 | 3.0 | 112.87 | 2.27 |
The computations are as follows:
T = (264 x 850 x 1) / 2.35 = 96,000 gpd/ft
P = 96,000 / 76 = 1,260 gpd/ sq. ft
The transmissibility is computed to be 96,000 gallons per day per foot, and the permeability, which is determined by dividing the transmissibility by the thickness of the aquifer, 76 feet, is 1,260 gallons per day per square foot.
Tables 4, 5, and 6 contain data for three other pumping tests, and Table 7 summarizes the four tests. Well 18-35-34abb had the largest yield, specific capacity (rate of yield per foot of drawdown), coefficient of transmissibility, and coefficient of permeability.
Table 4--Data on pumping test of well 18-35-34abb, August 13, 1948.
| Time since pumping began, minutes (t) |
Time since pumping ended, minutes (t) |
t/t' | Yield, gallons per minute (t) |
Depth to water level, feet |
Drawdown, or residual drawdown, feet |
|---|---|---|---|---|---|
| 0 | 89.18 | ||||
| 40 | 1,778 | 108.50 | 19.32 | ||
| 75 | 1,778 | 108.50 | 19.32 | ||
| 120 | 1,772 | 108.10 | 18.92 | ||
| 195 | 1,772 | 108.20 | 19.02 | ||
| 210 | 2,104 | ||||
| 235 | 4 | 58.8 | 92.04 | 2.86 | |
| 237 | 6 | 39.5 | 91.92 | 2.74 | |
| 242 | 11 | 22.0 | 91.73 | 2.55 | |
| 247 | 16 | 15.4 | 91.58 | 2.40 | |
| 255 | 24 | 10.6 | 91.38 | 2.20 | |
| 265 | 34 | 7.8 | 91.18 | 2.00 | |
| 275 | 44 | 6.3 | 91.05 | 1.87 | |
| 285 | 54 | 5.3 | 90.93 | 1.75 | |
| 300 | 69 | 4.3 | 90.76 | 1.58 | |
| 315 | 84 | 3.8 | 90.61 | 1.43 |
Table 5--Data on pumping test of well 18-35-36bcb, August 12, 1948.
| Time since pumping began, minutes (t) |
Time since pumping ended, minutes (t) |
t/t' | Yield, gallons per minute (t) |
Depth to water level, feet |
Drawdown, or residual drawdown, feet |
|---|---|---|---|---|---|
| 0 | 81.59 | ||||
| 15 | 1,191 | 95.50 | 13.91 | ||
| 45 | 1,179 | 95.30 | 13.71 | ||
| 75 | 1,182 | 95.20 | 13.61 | ||
| 105 | 1,180 | 95.05 | 13.46 | ||
| 135 | 1,187 | 95.50 | 13.91 | ||
| 195 | 1,182 | 95.60 | 14.01 | ||
| 202 | 3 | 67.3 | 84.50 | 2.91 | |
| 204 | 5 | 40.8 | 84.15 | 2.56 | |
| 206 | 7 | 29.4 | 83.97 | 2.38 | |
| 215 | 16 | 13.4 | 83.65 | 2.06 | |
| 218 | 19 | 11.5 | 83.55 | 1.96 | |
| 221 | 22 | 10.0 | 83.50 | 1.91 | |
| 226 | 27 | 8.4 | 83.41 | 1.82 | |
| 236 | 37 | 6.4 | 83.31 | 1.72 | |
| 253 | 54 | 4.7 | 83.12 | 1.53 | |
| 280 | 81 | 3.5 | 82.97 | 1.38 | |
| 310 | 111 | 2.8 | 82.80 | 1.21 | |
| 432 | 233 | 1.8 | 82.48 | 0.89 |
Table 6--Data on pumping test of well 18-38-31dcb, August 10, 1948.
| Time since pumping began, minutes (t) |
Time since pumping ended, minutes (t) |
t/t' | Yield, gallons per minute (t) |
Depth to water level, feet |
Drawdown, or residual drawdown, feet |
|---|---|---|---|---|---|
| 0 | 109.89 | ||||
| 15 | 610 | 125.81 | 15.92 | ||
| 45 | 611 | 126.48 | 16.59 | ||
| 75 | 611 | 125.80 | 15.91 | ||
| 135 | 611 | 126.05 | 16.16 | ||
| 165 | 607 | 126.03 | 16.14 | ||
| 195 | 604 | 126.32 | 16.43 | ||
| 210 | 623 | ||||
| 219 | 4 | 54.8 | |||
| 223 | 8 | 27.9 | 111.75 | 1.86 | |
| 225 | 10 | 22.5 | 111.66 | 1.77 | |
| 227 | 12 | 18.9 | 111.56 | 1.67 | |
| 231 | 16 | 14.4 | 111.42 | 1.53 | |
| 236 | 21 | 11.2 | 111.27 | 1.38 | |
| 245 | 30 | 8.2 | 111.14 | 1.25 | |
| 255 | 40 | 6.4 | 111.03 | 1.14 | |
| 272 | 57 | 4.8 | 110.90 | 1.01 | |
| 290 | 75 | 3.9 | 110.77 | 0.88 | |
| 315 | 100 | 3.2 | 110.60 | 0.71 | |
| 345 | 130 | 2.6 | 110.45 | 0.56 | |
| 375 | 160 | 2.3 | 110.31 | 0.42 |
Table 7--Results of pumping tests made in Wichita County, using the Theis recovery method for determining permeability. The specific capacity of a well is its rate of yield per unit of drawdown and is determined by dividing the rate of pumping in gallons a minute by the drawdown in feet.
| Well number | Discharge, gallons a minute |
Drawdown, feet |
Duration of pumping, minutes |
Specific capacity |
Coefficient of transmissibility, gallons a day per foot |
Approximate thickness of water-bearing material, feet |
Coefficient of permeability, gallons a day per square foot |
|---|---|---|---|---|---|---|---|
| 16-35-20cc | 850 | 19 | 224 | 45 | 96,000 | 76 | 1,260 |
| 18-35-34abb | 1,800 | 19 | 231 | 95 | 365,000 | 54 | 6,800 |
| 18-35-36bcb | 1,180 | 14 | 192 | 85 | 270,000 | 50 | 5,400 |
| 18-38-31dbc | 610 | 17 | 215 | 33 | 126,000 | 38 | 3,300 |
The Water Table and Movement of Ground Water
The water table is defined as the upper surface of the zone of saturation except where that surface is formed by an impermeable body (Meinzer, 1923a, p. 32). It does not remain stationary but fluctuates according to changes in recharge and discharge, barometric pressure, and other minor conditions.
Shape and Slope of the Water Table
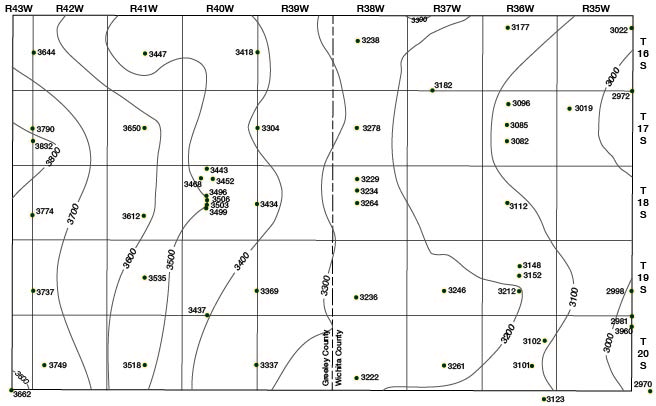
The shape and slope of the water table are shown on Plate 1 by contour lines. Each contour line has been drawn through points on the water table having the same altitude, and collectively they show the configuration of the water surface just as topographic maps show the shape of the land surface. Ground water moves at right angles to the water-table contour lines in the direction of maximum slope.
Plate 1 shows that the ground water is moving through Wichita and Greeley counties in a general easterly direction. Although the general slope of the water table is the same as the slope of the bedrock surface (Fig. 10), a comparison of the two maps indicates that irregularities in the bedrock floor are not reflected in the water table. Also, the water table is not a reflection of the surface topography. It is thought that in its eastern reach in Wichita County, Ladder Creek is a gaining stream; that is, it receives water from the ground-water body. However, the stream and the water table are apparently in approximate equilibrium, because on Plate 1 the contour lines cross the stream with little or no change in direction. If Ladder Creek were obtaining an appreciable amount of water from the ground-water body, the contour lines would have an upstream flexure, which would indicate that water was moving into the creek. Other factors that sometimes affect the shape of the water table are: pumping from Wells, which may cause local depression; unequal additions to the ground-water body at different places; and recharge to the ground-water body by ephemeral streams. In this area, pumping of wells has as yet caused only local or temporary irregularities in the water table. Any effects of pumping are more than balanced by the slight general rise in the water table that has occurred since 1947. Also, the measurements given in Plate 1 are not for any particular month, time of year, or year, but were made irregularly during the period 1947 to 1951. It is obvious that any irregularities caused by pumping would not be evident. For the same reason, effects of unequal recharge at different places and recharge from ephemeral streams probably would not be apparent. A large amount of ground-water recharge undoubtedly takes place through the sandy bottoms of White Woman and Sand Creeks but the irregularities caused by such recharge would be only temporary and would not show up on a generalized map such as Plate 1.
Fig. 10--Map of Wichita and Greeley counties showing the configuration of the bedrock surface beneath the Pliocene and Pleistocene deposits. A larger version of this figure is available.
Differences in the permeability and thickness of the water-bearing beds probably cause the principal irregularities in the water table in Wichita and Greeley counties. In general the slope of the water table varies inversely with the permeability of the water-bearing material. In areas where the water-bearing beds are relatively impermeable the slope of the water table steepens, but in areas where the beds are permeable, the water-table contour lines are farther apart. The permeability of the Ogallala formation is extremely variable because of changes in lithologic character from one place to another, and consequently the flow of ground water varies from place to place.
In parts of Wichita and Greeley counties, especially in Greeley County, the water-table contour lines are dashed. In such areas there is little or no water-bearing material and the water table is thought to be discontinuous. Although wells of small capacity can be obtained locally in areas of discontinuous water table from the deposits along White Woman Creek, from the Ogallala formation, or possibly from cracks or crevices in the Niobrara formation, wells drilled in these areas will commonly be practically dry.
Fluctuations in the Water Table
The water table is not a static surface but one that fluctuates much like the water surface in a lake. Its fluctuations are due principally to changes in recharge and discharge of the ground-water reservoir and to barometric fluctuations. If the amount of ground-water recharge exceeds the discharge the water level will rise and, conversely, if the discharge exceeds the recharge the water table will decline. Thus, changes in water levels in wells indicate to what extent the ground-water supply is being depleted or replenished.
The main factors controlling the rise of the water table in Wichita and Greeley counties are precipitation that penetrates the ground and reaches the zone of saturation, seepage from streams and undrained depressions, and ground water that enters the area from the west and north. Factors controlling the decline of the water table are pumpage from wells, flow from springs and seeps, evaporation and transpiration, and eastward movement of ground water from the area. The factors that cause the water table to rise are discussed in the section on ground-water recharge and those that cause it to decline are discussed in the section on ground-water discharge.
In the summer of 1947, 13 wells in Wichita County and 12 wells in Greeley County were selected as observation wells to obtain information concerning fluctuations of the water table. Since that time periodic measurement of the water level in some of these wells has been made by Howard Corrigan of the Division of Water Resources of the Kansas State Board of Agriculture. Water-level measurements made in 1947 and 1948 have been published in U. S. Geological Survey Water-Supply Paper 1128. Later measurements will be published in subsequent water-supply papers.
Apparently ground-water discharge and ground-water recharge have been about equal since 1947 because the present water level is essentially the same as the water level in 1947. The water-level measurements in wells that are still being measured (some have been discontinued) are given in Table 14.
Prev Page--Geology || Next Page--Recharge, Discharge
Kansas Geological Survey, Geology
Placed on web Jan. 11, 2008; originally published April, 1954.
Comments to webadmin@kgs.ku.edu
The URL for this page is http://www.kgs.ku.edu/General/Geology/Wichita/05_gw.html