![]()
Prev Page--Physical and Chemical Properties || Next Page--Allen to Franklin counties
Chapter IX—Oil and Gas Production in Kansas
Introduction
The oil- and gas-producing districts of Kansas comprise the northern portion of the so-called Midcontinent field, a term which has come into common use as convenient geographic and commercial designation for the oil and gas territory of Kansas, Oklahoma and adjacent parts of Arkansas, northern Louisiana, and Texas (Plate XXIII). The Kansas portion of this large field, although the first in the region to show the existence of important deposits of oil and gas, has not been the largest producer, for some years having been surpassed many millions of barrels by Oklahoma. In recent months, however, with the discovery and development of new pools in Butler county, Kansas, and the accompanying decline in production of the large Oklahoma pools, the northern part of the Midcontinent field is again attracting wide notice. The relative proportion of the crude-oil output of Kansas is increasing to an important degree.
Plate XXIII—Location Map of Midcontinent Field.
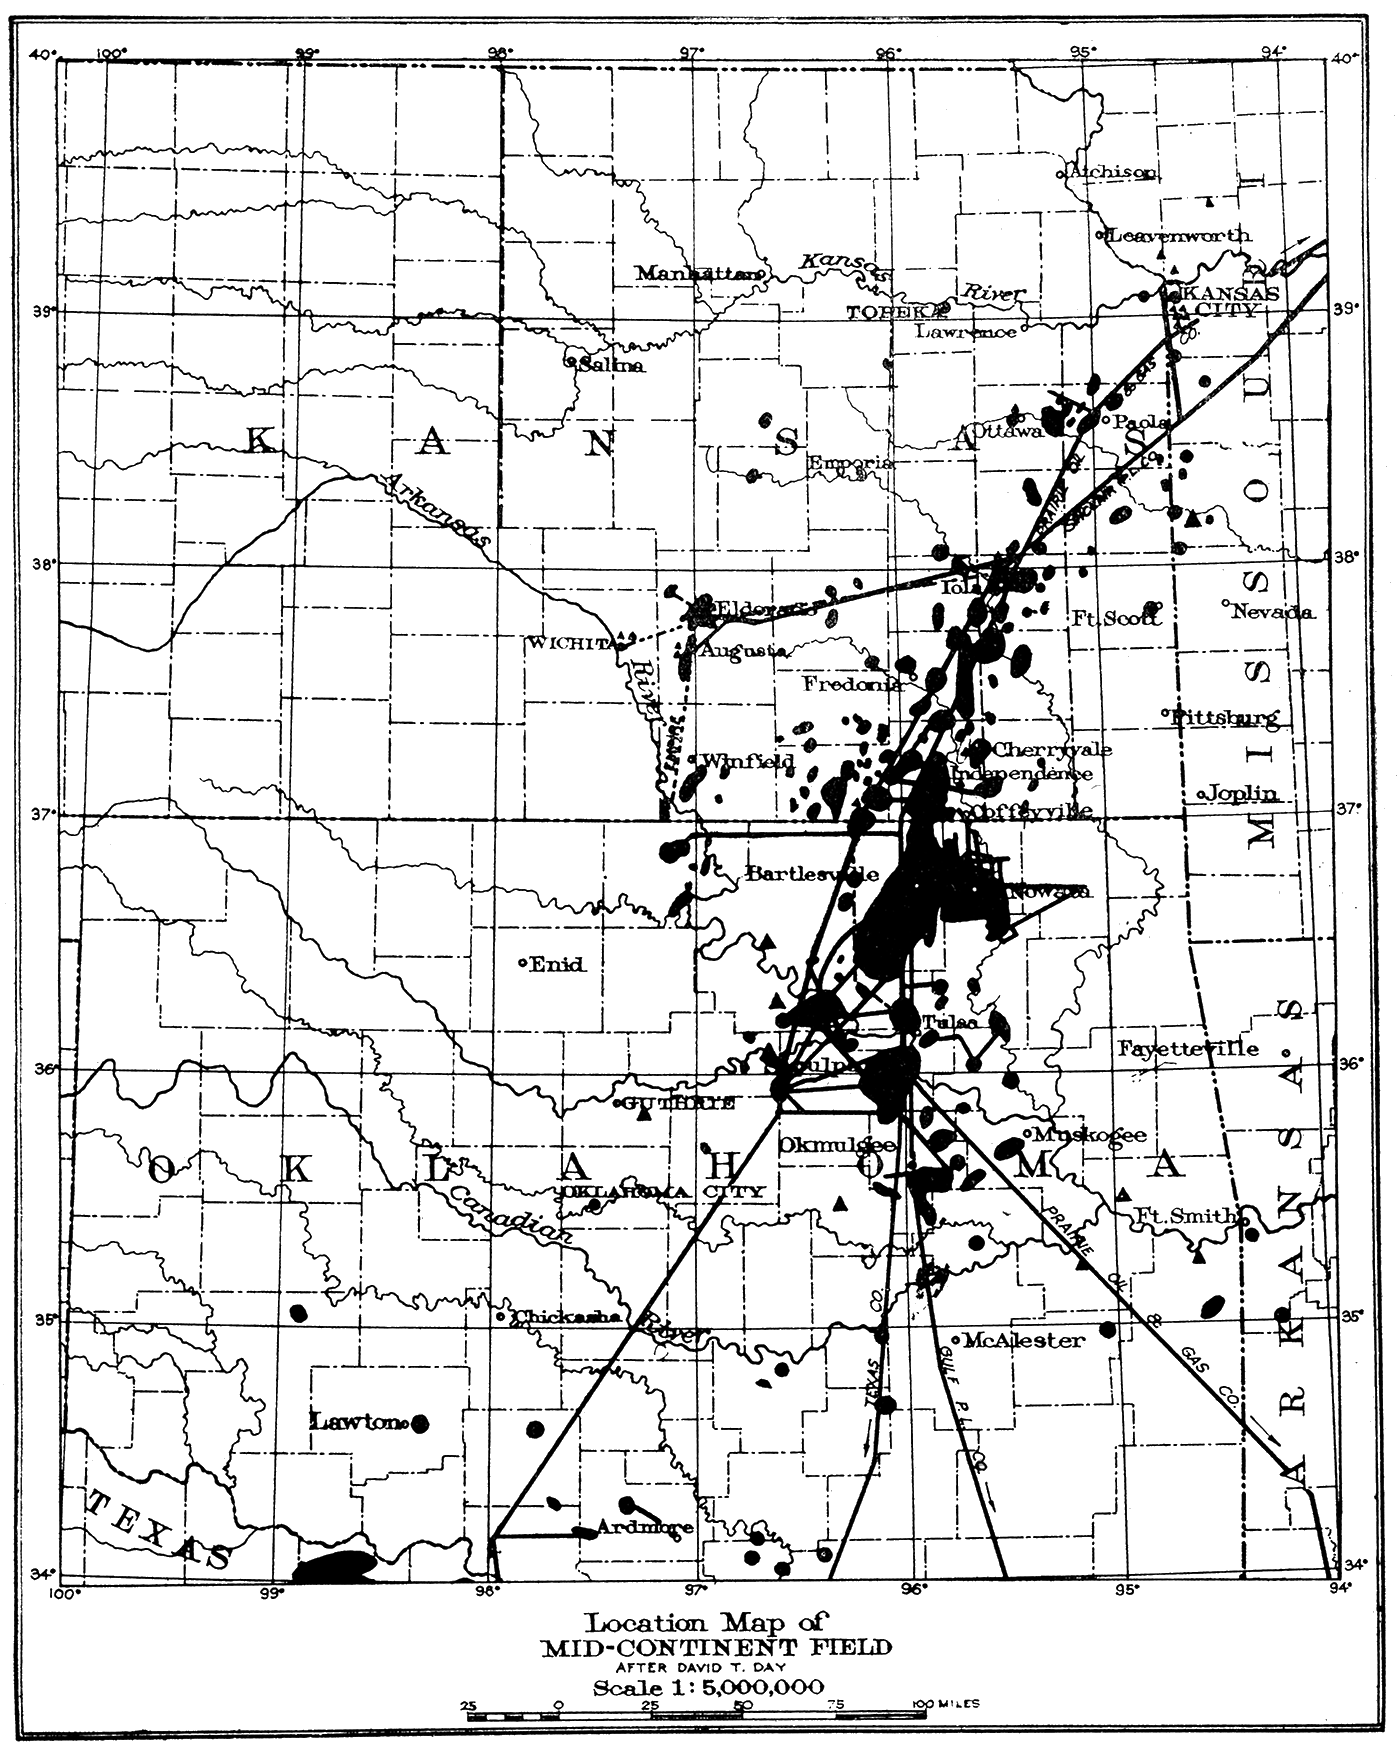
As shown in the accompanying maps of the field (Plates XXIII and XXIV), the chief producing districts in Kansas are located in the southeastern and south central portion of the state. A considerable area in southeast Kansas has long been known as productive oil and gas territory, the active wells being distributed in patches or spots of varying size, the location of which is controlled by the underground structure and character of the rocks. Most of these patches or "pools" have had a more or less important history as producers both of oil and of gas. The gas output has been the main supply for many years of towns and cities throughout all of eastern Kansas and western Missouri. Pipe lines have been extended very greatly, and natural gas is one of the most important fuels in an increasingly large area. In most of the districts the development of crude oil has followed somewhat that of the gas. In the early history of some pools, when wells were drilled only for gas, the presence of oil in the wells was regarded as a hindrance. The old gas fields have been extensively redrilled in recent years and in very many cases have been found to contain important quantities of crude oil.
The petroleum is in most cases obtained from relatively shallow wells with small average individual production from the wells. The areas which have yielded the largest gross amount of oil and gas are Chautauqua, Montgomery, Neosho, Wilson, Allen, Franklin and Miami counties. Less important territory is found in Labette, Greenwood, Woodson, Anderson, Linn and Bourbon counties. In 1914 oil was discovered in the gas field near Augusta, and a short time later in an anticlinal structure just west of El Dorado. Development in this new area in Butler county has been very rapid, and now the center of the oil and gas industry of Kansas, if not that of the entire Midcontinent field, is centered here. The discovery of such large quantities of oil a considerable distance west of the territory previously defined as oil and gas lands has drawn attention to adjacent areas. In 1916 a shallow gas and oil field was developed in Cowley county near Arkansas City, and oil has been found in some deep drilling, but no accumulations comparable to those of Butler county have been discovered. The productive oil and gas areas of Kansas are thus essentially as defined a decade or more ago, with the exception of the new very important Butler county fields. Largely due to the present high market price of crude oil, activity is great throughout both the old and the new districts.
Topography. The country in which the oil and gas deposits of the state, as known at present, are located is a broad plain of moderate relief crossed in a general north-south direction by a series of more or less prominent escarpments or benches made by the outcrops of relatively resistant limestone formations. The rock strata are gently inclined to the west, so that each escarpment slopes downward on the west and successively higher escarpments appear from east to west. One of the most prominent of the escarpments is that produced by the flinty limestone beds at the base of the Permian. The "Flint Hills" area, which contains the highest land in central Kansas stretches from north to south from Chase or Morris counties to Cowley county. The valleys of the larger streams are wide and flat bottomed, being filled to various depths with sand and alluvium.
Geology. The oil- and gas-bearing rock of Kansas and the adjacent region belong chiefly to the Pennsylvanian system. The Pennsylvanian beds outcrop in a large area in eastern Kansas (geologic map, Plate I), the older divisions occurring farthest east and the younger being found in order to the west. The strata which appear at the surface in southeastern Kansas are deeply buried to the northwest. The outcrops of the various limestone members are traceable for distances of 50 to 300 miles. Three-fourths of the oil has come from sands in the Cherokee formation at the base of the Pennsylvanian, most of the productive areas of eastern Kansas and Oklahoma obtaining the largest amount of oil from this horizon. To the west the Cherokee is more and more deeply buried, but is still an important source of oil and gas. Higher formations are productive to a varying degree here. The Pennsylvanian rock divisions are described in the chapter on stratigraphy.
In southern Oklahoma, in the Healdton field, oil has been obtained from Ordovician strata. [Note: Personal communication, Sidney Powers. Fossils collected at horizon of production prove conclusively the Ordovician age of the rocks.] In parts of northeastern Oklahoma, possibly also southernmost Kansas in Chautauqua and Montgomery counties, oil and gas have been obtained from strata of probable upper Mississippian age. Some of the productive sands in the central western part of Oklahoma and Kansas are Permian in age. Seepages in the Cretaceous rocks are well known, but in no case is large production recorded from these beds not belonging to the Pennsylvanian. In Kansas none of the rocks below the Pennsylvanian have so far proved of any importance as oil and gas producers. It is possible, however, that either the Permian or Cretaceous may contain commercial deposits of these fuels. The distribution and geologic relations of the Kansas formations are described in some detail in a preceding chapter.
Structure. The major structural features of the rocks of Kansas have already been described briefly. The position of the rocks underground are of prime importance to the oil and gas producer, for structure not only determines the accumulation of the oil and gas in the rocks but also the depth to which wells must be drilled. The rocks of Kansas are in the form of a broad, shallow trough or pan, sloping westward in the east part of the state and eastward in the west (Plate XII), so that a given stratum which appears at the surface in eastern Kansas is buried several hundred or perhaps some thousands of feet in central Kansas, but reappears at the surface in eastern Colorado near the Rocky Mountains. The dip of the rocks along the Front Range in Colorado is much steeper than that of the same beds in eastern Kansas and Missouri (Plates XII and XIV). The surface of the land rises gradually from east to west, so that the west part of the shallow, sagging rock basin is more deeply buried than the east. The slope of the beds is not uniform in different parts of the basin, as shown by the accompanying structure-contour maps of the Mississippian limestone in eastern Kansas (Plate XXV) and of the Dakota sandstone in western Kansas (Plate XXVI), which indicate all the larger irregularities of structure. In places there are slight upward folds which locally complicate the structure.
Plate XXV—Structure map of eastern Kansas. The numbered black lines show the position of the top of the Mississippian limestone above and below sea level. If the rocks above the Mississippian are imagined to be removed and the area flooded by the sea, the 0-contour would represent the shore line. If the water were raised by 100-foot intervals the shore would advance southeast to successive higher contours. Also, if the water were lowered by 100-foot intervals the shore would retreat westward to successively lower contours. The depth of the Mississippian below the surface in many deep wells is indicated.
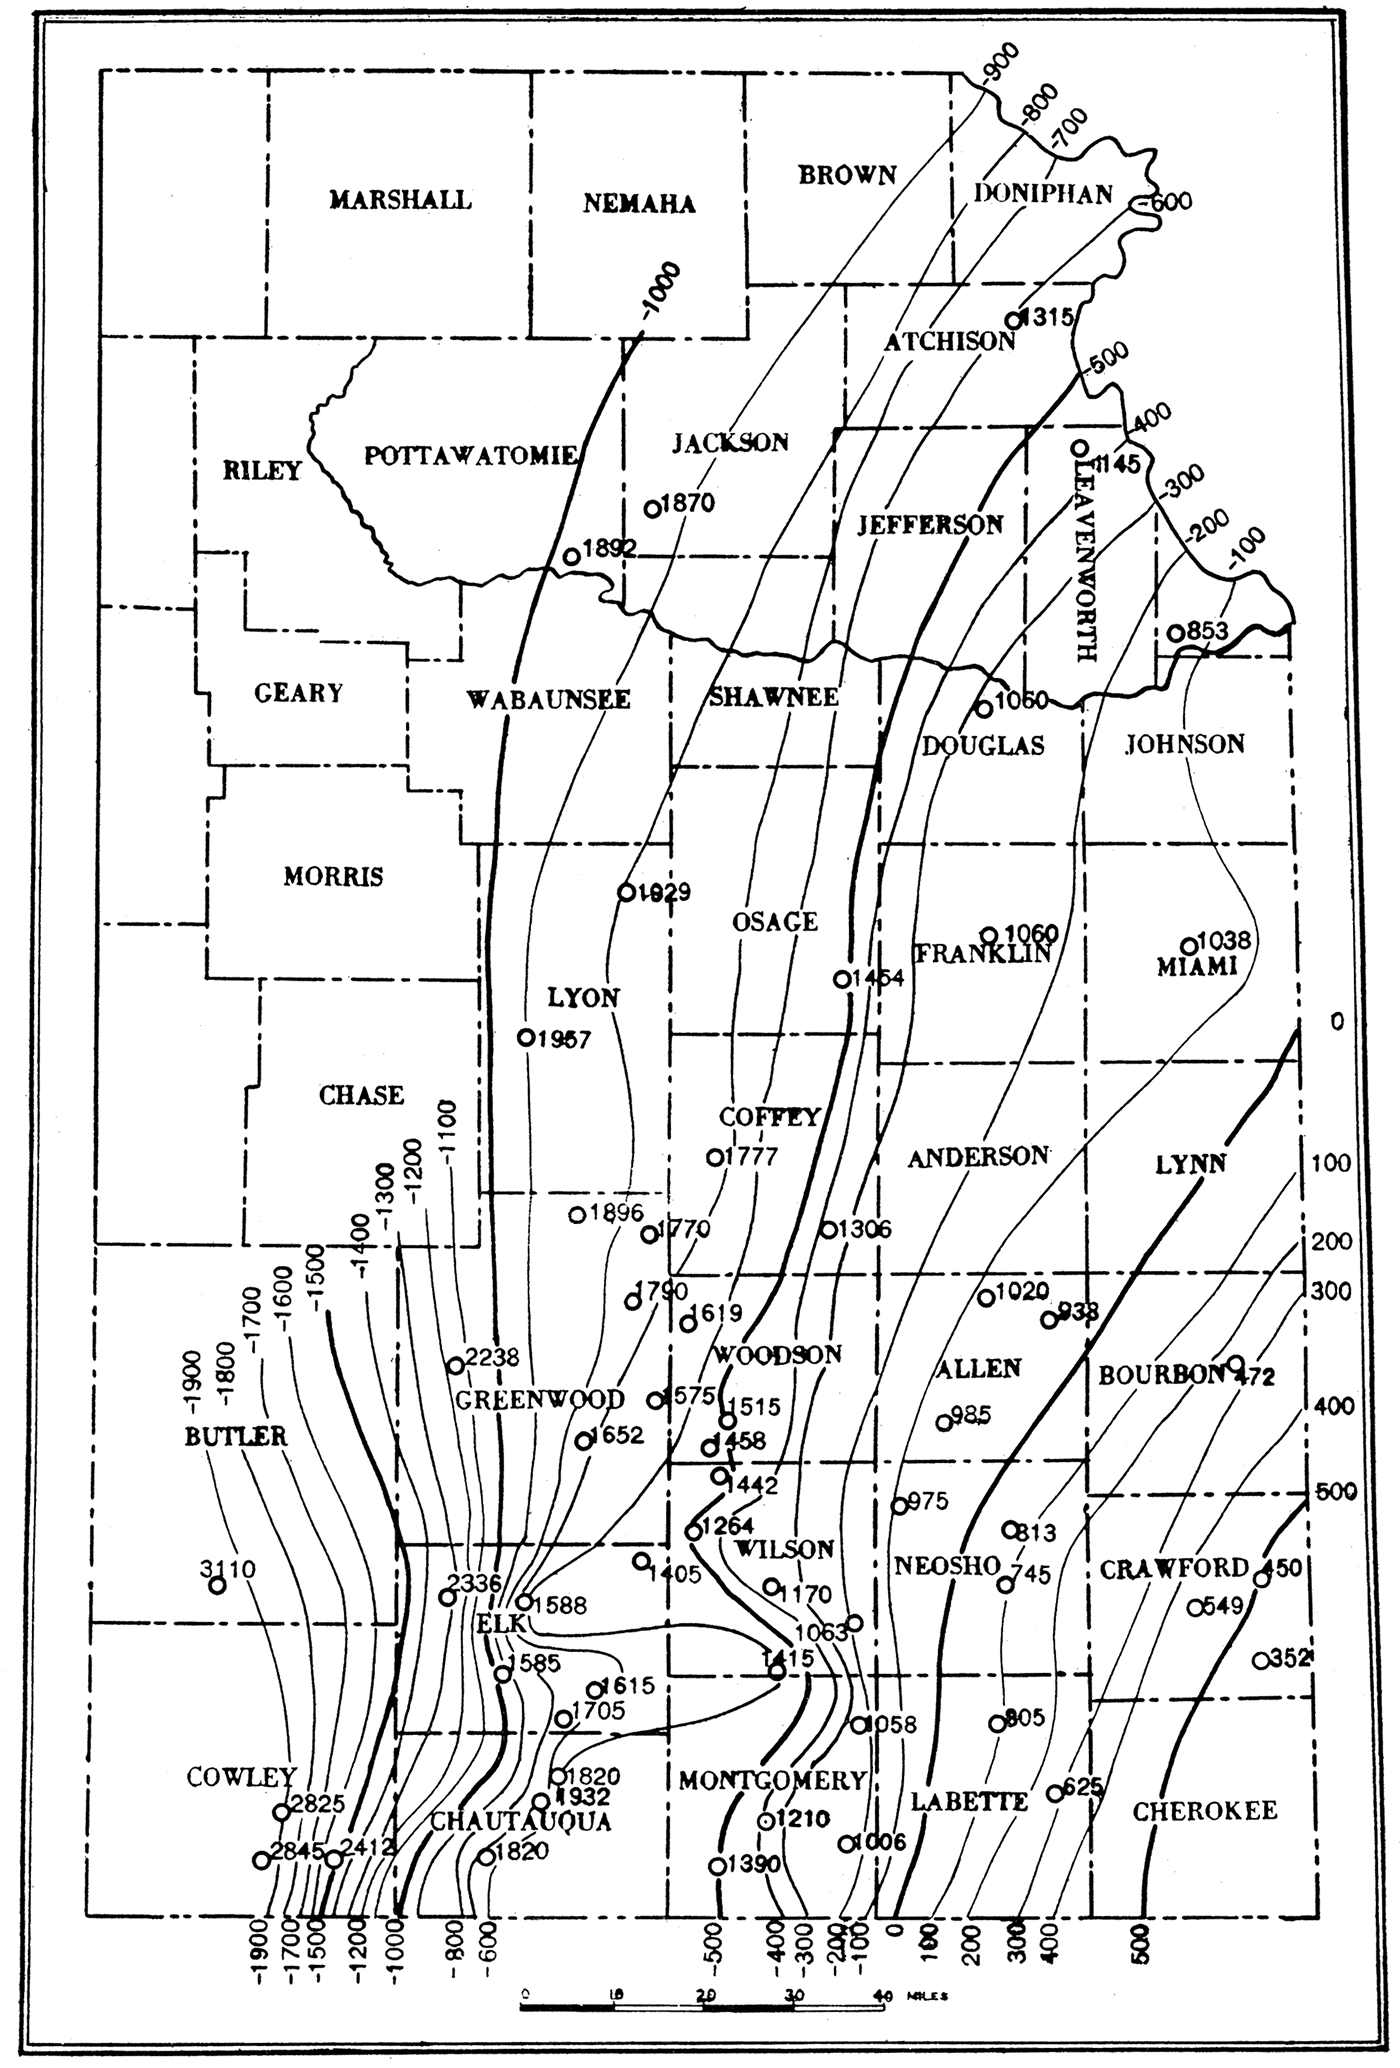
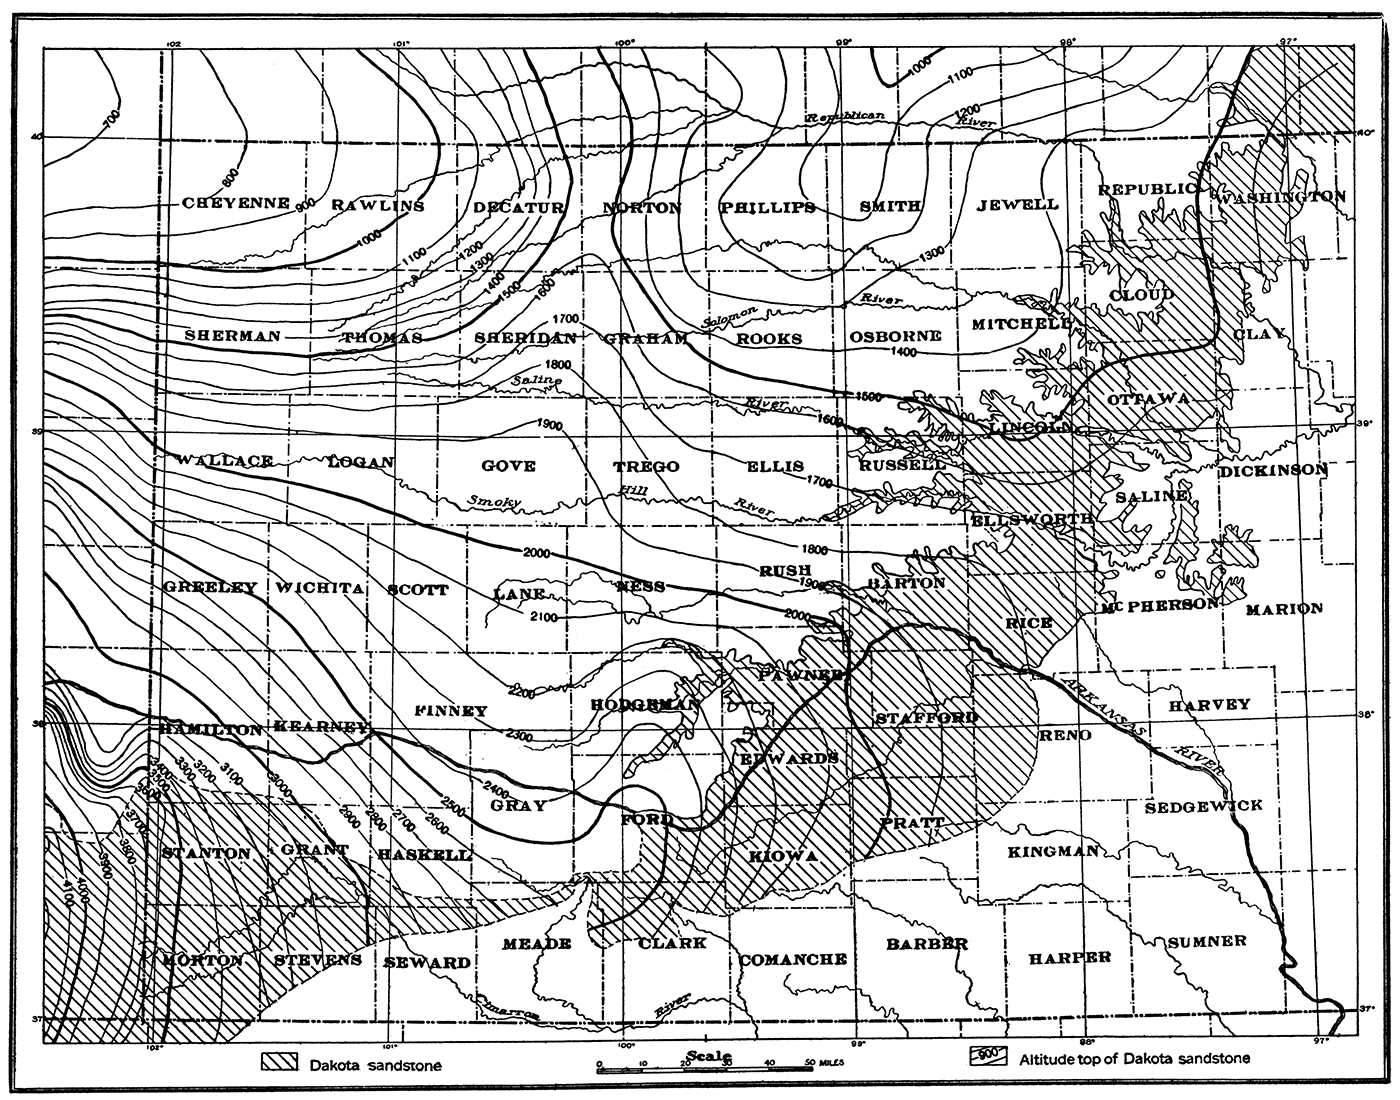
Plate XXVI—Structure map of western Kansas (after N. H. Darton). The numbered black lines show the elevation of the top of the Dakota sandstone above sea level. If the beds above the Dakota are imagined to be removed and the northwest part of the area flooded by water which stands 700 feet above sea level, the 700-foot contour line would represent the shore. If the water were raised by 100-foot interval, the successive shorelines would be represented in turn by the higher contour lines. The top of the Dakota inclines generally to the northeast, but there are local more or less pronounced irregularities. [Acrobat PDF version available.]
The depth of the Mississippian limestone is a very important consideration to drillers and operators in the Kansas oil and gas fields, since the top of the Mississippian is generally considered the lower limit of possible oil or gas, and stipulated as the limit of drilling in most drillers' contracts. The Mississippian consists of very hard, flinty limestone, which is extremely difficult to drill, and has characteristics which distinguish it readily from almost all of the limestones of the Pennsylvanian. It is therefore easily identified, and any driller who has had much experience in the Kansas fields is able to recognize it. Most of the well logs have reported correctly the depth of the Mississippian. The available records at the office of the State Geological Survey have been plotted, the figures indicating the depth at which the Mississippian limestone is reached. Inasmuch as the uneven surface of the ground is an important factor in the depth to the Mississippian, it was necessary to reduce all of the well records to the same datum, for which mean sea level was used. This was done by determining the elevation of the top of the well as closely as possible from topographic contour maps and bench marks. The lines were drawn connecting all points at the top of the Mississippian limestone of approximately the same elevation above or depression below mean sea level. These lines or structural contours, therefore, define the elevation and structure of the Mississippian limestone so far as known in Kansas.
Throughout eastern Kansas the Mississippian dips gently to the west at an angle almost identically that of the overlying Pennsylvanian strata. In the vicinity of Butler county, however, the Mississippian limestone dips much more steeply, dropping sharply within the space of a very few miles. This steep western dip of the Mississippian in this section is associated with a considerable thickening of the Cherokee shale with its included sand beds, a condition which has an important bearing on the producing fields of this region. Wells which have been drilled in Butler county have encountered many more sands and a much greater thickness of the Cherokee shale than would be expected. The structure map of the Mississippian shows the approximate depth at which the Mississippian may be expected in any given locality.
In the map showing the structure of western Kansas the most prominent and desirable key horizon is the Dakota sandstone, which outcrops in a considerable belt in the central part of the state and is encountered in many well borings farther west. The depth of the Dakota beneath the surface has been determined by well logs, and the structure contours drawn in a manner entirely similar to that employed in making the Mississippian map. [Note: The structure map of the Dakota was made by N. H. Darton (1905, Pl. 58).] The contours show an anticline of moderate prominence in the western part of Norton county, extending northward into Nebraska, and a dome of considerable height in Hamilton county, the crest of which is about six or eight miles southwest of Syracuse.
It is fully realized that there are many inaccuracies in the structure contour maps. These are partly due to errors in the well logs, partly to error in measurement and computation of surface elevations, and partly to insufficient data. However, the maps are, in general, fairly accurate.
Petroleum
According to official records, Kansas produced to the end of the year 1916 a grand total of 40,108,638 barrels of crude oil. [Note: The figures of oil and gas production in Kansas and the Midcontinent field are taken chiefly from reports of the U. S. Geological Survey, Mineral Resources of the United States.] This is not an inconsiderable contribution to the petroleum supply of the country, but the most interesting fact with regard to the oil production of Kansas is the remarkable increase in the yield of the last two years. This is to be correlated especially with the discovery and development of the Butler county districts, which in recent months have surpassed the entire remaining portion of the state. The gross production of crude oil in Kansas from the beginning of development in 1889 is shown in the following table:
| Petroleum production of Kansas for the years 1889 to 1916, inclusive. | ||
|---|---|---|
| Year | Barrels | Value |
| 1889 | 500 | $385 |
| 1890 | 1,200 | 925 |
| 1891 | 1,400 | 785 |
| 1892 | 5,000 | 2,500 |
| 1893 | 18,000 | 10,800 |
| 1894 | 40,000 | 19,200 |
| 1895 | 44,430 | 28,435 |
| 1896 | 113,571 | 71,549 |
| 1897 | 81,098 | 54,000 |
| 1898 | 71,980 | 176,000 |
| 1899 | 69,700 | 52,167 |
| 1900 | 74,714 | 79,035 |
| 1901 | 179,151 | 154,373 |
| 1902 | 331,749 | 292,464 |
| 1903 | 932.214 | 988.220 |
| 1904 | 4,250,779 | $4,123,276 |
| 1905 | 3,750,250 | 2,250,150 |
| 1906 | 3,627,375 | 1,367,224 |
| 1907 | 2,409,521 | 965,134 |
| 1908 | 1,801,781 | 746,695 |
| 1909 | 1,263,764 | 491,633 |
| 1910 | 1,128,668 | 432,638 |
| 1911 | 1,278,819 | 608,756 |
| 1912 | 1,592,796 | 1,095,695 |
| 1913 | 2,375,029 | 2,248,283 |
| 1914 | 3,103,585 | 2,433,074 |
| 1915 | 2,823,487 | 1,702,891 |
| 1916 | 8,738,077 | 10,339,958 |
| Total | 40,108,638 | $30.736.245 |
It will be observed that the production reported for the year 1916 more than doubles that of any preceding year and exceeds by 5,639,660 barrels, or 228 percent, the output of 1915. The average price for the oil at the wells in 1916 was $1.18 a barrel, making the total market value of the yield for that year $10,339,958. This total is in excess of the amount received for the Kansas oil of 1915 by $8,637,067, an increase of 507 percent.
The following table shows the production of the Kansas fields from 1913 to 1916, inclusive, by months:
| Petroleum production of Kansas for the years 1913 to 1916, inclusive, by months. | ||||
|---|---|---|---|---|
| Month | 1913 | 1914 | 1915 | 1916 |
| January | 160,899 | 260,343 | 245,606 | 197,348 |
| February | 161,306 | 250,421 | 207,411 | 284,726 |
| March | 176,134 | 291,631 | 226,183 | 353,693 |
| April | 184,231 | 262,733 | 209,173 | 441,422 |
| May | 184,093 | 280,922 | 211,159 | 633,726 |
| June | 183,156 | 284,835 | 217,838 | 834,640 |
| July | 194,637 | 292,972 | 239,216 | 705,376 |
| August | 200,304 | 234,845 | 247,029 | 644,667 |
| September | 209,082 | 238,908 | 252,748 | 951,516 |
| October | 217,392 | 238,510 | 259,494 | 1,260,585 |
| November | 234,381 | 230,848 | 262,955 | 1,212,459 |
| December | 269,414 | 236.617 | 244,675 | 1,217,919 |
| Total | 2,375,029 | 3,103,585 | 2,823,487 | 8,738,077 |
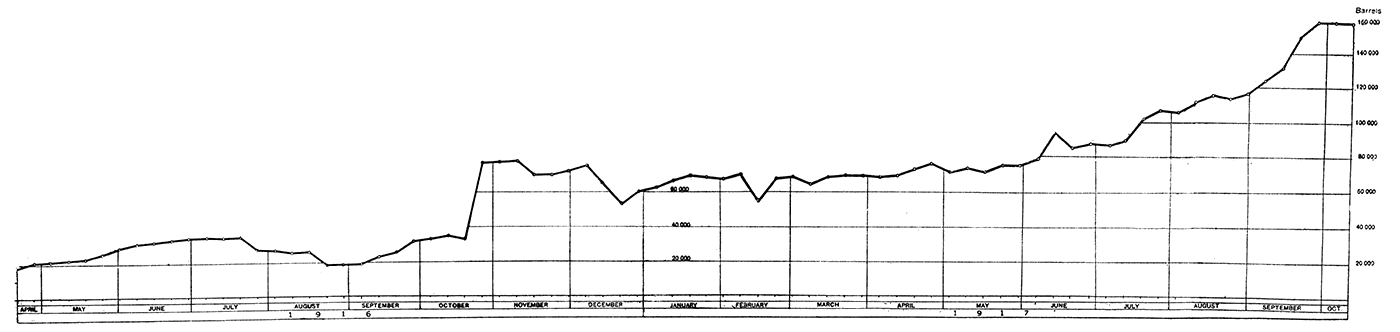
The record of oil production in Kansas by weeks gives interesting information concerning the activity in the various fields. This record, from April, 1916, to October, 1917, is shown in the accompanying chart, Plate XXVII. The weekly production shown in the early part of 1916 indicates the average yield of crude oil in the state before the development of the west portion of the El Dorado field, Butler county. The sudden increases in October, 1916, and June, 1917, are due to the large production of new wells in this region.
The character of the Kansas oil fields is in part indicated by the statistics of wells drilled. Throughout the larger portion of the producing area, especially that located in the southeastern counties of the state, the wells are numerous but none have a large output. The average yield for each producing well is from 1 or 2 barrels a day to 25 barrels a day. In the Butler county fields, however, some of the wells are credited with a very large individual daily output, in the case of wells on the Trapshooter lease, Towanda township, which have been: drilled recently, amounting to more than 20,000 barrels a day. The drilling in of only a few of these wells with large production has had an easily perceptible effect on the amount of the total Kansas production.
In general the interest in development and activity in the fields is also shown by the number of new wells drilled. Field operations follow more or less closely the fluctuation of the market, periods of greatest activity accompanying times of highest crude oil prices. As reported for the years 1912 to 1916, inclusive (U. S. Geol. Survey, Mineral Resources of the United States, 1915, p. 651, and Press Bulletin, July, 1917.), 7,463 wells were drilled in Kansas, of which 6,256 were producing and 1,207 dry. The dry wells comprise about 17 percent of the total number drilled. Of the 3,624 wells put down in 1916, 3,142 were oil producing, 112 gas wells, and the 370 remaining dry, the dry wells averaging about 1 in 10. The following table is a summary of data concerning wells completed each year from 1904 to 1916, inclusive.
| New wells completed in the Kansas fields, 1904 to 1916, inclusive. | ||||
|---|---|---|---|---|
| Year | Oil | Gas | Dry | Total new wells completed |
| 1904 | (a) 2,418 | 364 | 2,782 | |
| 1905 | 817 | 211 | 249 | 1,277 |
| 1906 | 366 | 262 | 151 | 779 |
| 1907 | 68 | 236 | 64 | 368 |
| 1908 | 72 | 367 | 127 | 566 |
| 1909 | 69 | 383 | 106 | 558 |
| 1910 | 85 | 261 | 82 | 428 |
| 1911 | 172 | 150 | 96 | 418 |
| 1912 | 536 | 253 | 160 | 949 |
| 1913 | 1,422 | 334 | 260 | 2,016 |
| 1914 | 1,753 | 317 | 270 | 2,340 |
| 1915 | 610 | 331 | 147 | 1,088 |
| 1916 | 3,142 | 112 | 370 | 3,624 |
| Totals | 11,530 | 3,255 | 2,408 | 17,193 |
| (a) Includes gas wells. | ||||
| New wells completed in the Kansas fields, 1904 to 1916, inclusive, by counties. The data in this table, from Mineral Resources of the United States, U. S. Geol. Survey are chiefly from trade journal sources. |
||||||||||||||
|---|---|---|---|---|---|---|---|---|---|---|---|---|---|---|
| County | 1904a | 1905 | 1906 | 1907 | 1908 | 1909 | 1910 | 1911 | 1912 | 1913 | 1914 | 1915 | 1916b | |
| Allen | Oil | 387 | 7 | 6 | 22 | 16 | 13 | 30 | 50 | 154 | 175 | 49 | 314 | |
| Gas | 3 | 2 | 37 | 133 | 100 | 51 | 19 | 2 | 6 | 8 | 13 | 6 | ||
| Dry | 63 | 3 | 2 | 37 | 35 | 14 | 10 | 6 | 11 | 10 | 3 | 6 | ||
| Total | 450 | 13 | 2 | 45 | 192 | 151 | 78 | 59 | 58 | 171 | 193 | 65 | 326 | |
| Anderson | Oil | 1 | ||||||||||||
| Gas | 9 | 1 | ||||||||||||
| Dry | 4 | |||||||||||||
| Total | 9 | 1 | 1 | 4 | ||||||||||
| Bourbon | Oil | 8 | 1 | |||||||||||
| Gas | 6 | |||||||||||||
| Dry | 2 | |||||||||||||
| Total | 16 | 1 | ||||||||||||
| Butler | Oil | 5 | 22 | 836 | ||||||||||
| Gas | 24 | 34 | 35 | |||||||||||
| Dry | 4 | 126 | ||||||||||||
| Total | 29 | 60 | 997 | |||||||||||
| Chautauqua | Oil | 566 | 191 | 125 | 20 | 16 | 23 | 42 | 64 | 182 | 311 | 308 | 112 | 440 |
| Gas | 15 | 6 | 17 | 5 | 5 | 4 | 6 | 12 | 54 | 30 | 26 | 20 | ||
| Dry | 64 | 29 | 25 | 10 | 3 | 3 | 14 | 12 | 28 | 77 | 38 | 26 | 51 | |
| Total | 630 | 235 | 156 | 47 | 24 | 31 | 60 | 82 | 222 | 442 | 376 | 164 | 511 | |
| Coffey | Oil | 5 | 3 | |||||||||||
| Gas | 1 | |||||||||||||
| Dry | 1 | |||||||||||||
| Total | 7 | 3 | ||||||||||||
| Cowley | Oil | 3 | 2 | |||||||||||
| Gas | 6 | 12 | ||||||||||||
| Dry | 8 | 4 | ||||||||||||
| Total | 17 | 18 | ||||||||||||
| Elk | Oil | 9 | 1 | 7 | ||||||||||
| Gas | 3 | 2 | 1 | 3 | ||||||||||
| Dry | 4 | 1 | 4 | 3 | 2 | |||||||||
| Total | 16 | 2 | 9 | 1 | 4 | 3 | 5 | |||||||
| Franklin | Oil | 55 | 63 | 9 | 1 | 1 | 18 | 54 | 163 | 71 | ||||
| Gas | 4 | 1 | 1 | 6 | 2 | 1 | 32 | 21 | ||||||
| Dry | 4 | 8 | 6 | 1 | 1 | 3 | 30 | 22 | ||||||
| Total | 63 | 72 | 16 | 2 | 7 | 3 | 18 | 58 | 225 | 114 | ||||
| Labette | Oil | 31 | 1 | 1 | 2 | 8 | 19 | |||||||
| Gas | 3 | 8 | 2 | 1 | 3 | 28 | 7 | |||||||
| Dry | 1 | 1 | 3 | 18 | 3 | |||||||||
| Total | 32 | 1 | 4 | 11 | 3 | 1 | 2 | 3 | 54 | 29 | ||||
| Linn | Oil | 2 | ||||||||||||
| Gas | ||||||||||||||
| Dry | ||||||||||||||
| Total | 2 | |||||||||||||
| Miami | Oil | 84 | 197 | 25 | 5 | 131 | 33 | 217 | ||||||
| Gas | 17 | 5 | 3 | 6 | 13 | 4 | 2 | |||||||
| Dry | 13 | 32 | 8 | 2 | 42 | 15 | 56 | |||||||
| Total | 97 | 246 | 38 | 10 | 6 | 186 | 52 | 275 | ||||||
| Montgomery | Oil | 715 | 104 | 60 | 21 | 1 | 5 | 16 | 60 | 202 | 602 | 691 | 201 | 778 |
| Gas | 89 | 88 | 31 | 79 | 100 | 56 | 36 | 116 | 173 | 137 | 129 | 34 | ||
| Dry | 113 | 40 | 21 | 4 | 17 | 22 | 7 | 22 | 47 | 92 | 75 | 49 | 48 | |
| Total | 828 | 233 | 169 | 56 | 97 | 127 | 79 | 118 | 365 | 867 | 903 | 379 | 860 | |
| Neosho | Oil | 454 | 97 | 68 | 7 | 30 | 18 | 9 | 16 | 62 | 257 | 221 | 92 | 237 |
| Gas | 27 | 61 | 87 | 54 | 65 | 61 | 21 | 30 | 32 | 23 | 43 | 6 | ||
| Dry | 65 | 31 | 36 | 18 | 34 | 17 | 17 | 22 | 23 | 27 | 19 | 9 | 8 | |
| Total | 519 | 155 | 165 | 112 | 118 | 100 | 87 | 59 | 115 | 316 | 263 | 144 | 251 | |
| Wilson | Oil | 170 | 36 | 7 | 1 | 2 | 18 | 40 | 27 | 6 | 63 | |||
| Gas | 24 | 48 | 47 | 66 | 89 | 80 | 65 | 86 | 54 | 12 | 13 | 3 | ||
| Dry | 41 | 16 | 26 | 10 | 21 | 24 | 27 | 27 | 52 | 45 | 20 | 4 | 2 | |
| Total | 211 | 76 | 81 | 57 | 87 | 113 | 108 | 94 | 156 | 139 | 59 | 23 | 68 | |
| Woodson | Oil | 20 | 1 | 2 | 12 | |||||||||
| Gas | 2 | 3 | 23 | |||||||||||
| Dry | 4 | 3 | 3 | 2 | 2 | |||||||||
| Total | 24 | 2 | 7 | 5 | 14 | 25 | ||||||||
| Miscellaneous | Oil | 21 | 8 | 2 | 2 | 1 | 2 | |||||||
| Gas | 167 | 42 | 13 | 15 | 5 | 4 | 1 | 4 | 11 | 3 | ||||
| Dry | 51 | 24 | 12 | 14 | 1 | 3 | 1 | 2 | 4 | |||||
| Total | 239 | 74 | 25 | 31 | 6 | 9 | 1 | 6 | 15 | 7 | ||||
| (a) Includes gas wells. (b) Data from trade journals. |
||||||||||||||
| Wells drilled and acreage held in Kansas for the years 1910 to 1915, inclusive | ||||||||
|---|---|---|---|---|---|---|---|---|
| Year | Wells | Acreage | ||||||
| Wells productive Jan. 1 |
New wells completed |
Abandoned | Average daily production in bbls. per well |
Fee | Lease | Total | ||
| Oil | Dry | |||||||
| 1910 | 1,831 | 53 | 26 | 97 | 1.9 | 9,651 | 101,589 | 111,240 |
| 1911 | 1,787 | 164 | 25 | 194 | 1.9 | 10,031 | 110,199 | 120,230 |
| 1912 | 1,757 | 279 | 41 | 224 | 1.9 | 18,458 | 119,274 | 137,732 |
| 1913 | 1,812 | 1,336 | 87 | 94 | 2.0 | 20,566 | 182,438 | 203,004 |
| 1914 | 3,054 | 552 | 156 | 194 | 2.0 | 21,450 | 261,386 | 282,856 |
| 1915 | 3,460 | 469 | 158 | 256 | 1.7 | 36,338 | 68,206 | 104,544 |
| 1916 | 3,673 | 3,150 | 360 | |||||
| 1917 | 6,823 | |||||||
The following is a statement of the total number of wells drilled and acreage held in various counties in Kansas for the years 1910 to 1915, inclusive:
Wells drilled and acreage held in Kansas for the years 1910 to 1916, inclusive, by counties. Compiled from records of U. S. Geol. Survey, Mineral Resources of the United States.
| County | Year | Wells | Acreage | |||||
|---|---|---|---|---|---|---|---|---|
| Wells productive Jan. 1 |
New wells completed |
Abandoned | Fee | Lease | Total | |||
| Oil | Dry | |||||||
| Allen | 1910 | 156 | 9 | 18 | 5 | 1,017 | 7,529 | 8,546 |
| 1911 | 160 | 46 | 11 | 36 | 613 | 8,465 | 9,078 | |
| 1912 | 170 | 34 | 14 | 32 | 1,452 | 7,913 | 9,365 | |
| 1913 | 172 | 142 | 9 | 5 | 1,126 | 13,117 | 14,243 | |
| 1914 | 309 | 66 | 5 | 10 | 2,008 | 12,735 | 14,743 | |
| 1915 | 365 | 50 | 32 | 28 | 2,941 | 16,773 | 19,714 | |
| 1916 | 387 | |||||||
| Anderson | 1915 | 4 | ||||||
| Butler | 1914 | 1 | 60,1081 | 60,108 | ||||
| 1915 | 1 | 19 | 4 | 104,060 | 104,060 | |||
| 1916 | 20 | |||||||
| Chase | 1914 | 1 | ||||||
| 1915 | 1 | |||||||
| Chautauqua | 1910 | 785 | 34 | 3 | 45 | 4,125 | 30,447 | 34,572 |
| 1911 | 767 | 53 | 4 | 54 | 5,967 | 36,911 | 42,878 | |
| 1912 | 766 | 106 | 19 | 61 | 10,600 | 47,982 | 58,582 | |
| 1913 | 811 | 292 | 27 | 27 | 12,459 | 49,754 | 62,213 | |
| 1914 | 1,076 | 193 | 25 | 36 | 9,154 | 44,691 | 53,845 | |
| 1915 | 1,233 | 114 | 29 | 32 | 12,914 | 52,992 | 65,906 | |
| 1916 | 1,315 | |||||||
| Clark | 1915 | 1 | 10,000 | 7,000 | 17,000 | |||
| Coffey | 1910 | |||||||
| 1911 | 2 | 240 | 240 | |||||
| 1912 | 2 | 398 | 398 | |||||
| 1913 | 2 | 1 | 2 | 158 | 158 | |||
| 1914 | 1 | 18 | 80 | 80 | ||||
| 1915 | 19 | 4 | 1,195 | 1,195 | ||||
| 1916 | 23 | |||||||
| Cowley | 1913 | 2 | 10,622 | 10,622 | ||||
| 1914 | 1 | 13,965 | 13,965 | |||||
| 1915 | 1 | 1 | 6 | 20,354 | 20,354 | |||
| 1916 | 2 | |||||||
| Elk | 1910 | |||||||
| 1911 | 5 | 1 | 150 | 150 | ||||
| 1912 | 4 | 2 | 150 | 150 | ||||
| 1913 | 6 | 160 | 160 | |||||
| 1914 | 6 | 160 | 160 | 320 | ||||
| 1915 | 6 | 1 | 2 | 160 | 160 | |||
| 1916 | 7 | |||||||
| Ford | 1916 | 1 | ||||||
| Franklin | 1910 | 25 | 327 | 327 | ||||
| 1911 | 25 | 1 | 77 | 77 | ||||
| 1912 | 26 | 14 | 77 | 77 | ||||
| 1913 | 12 | 47 | 2 | 1,137 | 1,137 | |||
| 1914 | 59 | 54 | 9 | 1,170 | 3,397 | 4,567 | ||
| 1915 | 113 | 31 | 5 | 6 | 1,290 | 4,761 | 6,051 | |
| 1916 | 138 | |||||||
| Greenwood | 1913 | 1 | 2,107 | 2,107 | ||||
| 1914 | 1 | 8 | ||||||
| 1915 | 1 | |||||||
| 1916 | 1 | |||||||
| Labette | 1911 | 1 | ||||||
| 1912 | 1 | |||||||
| 1913 | 1 | 2 | 60 | 3,000 | 3,060 | |||
| 1914 | 1 | 6 | 4 | 400 | 710 | 1,110 | ||
| 1915 | 7 | 3 | 3 | 60 | 4,200 | 4,260 | ||
| 1916 | 10 | |||||||
| Linn | 1914 | 2 | ||||||
| 1915 | 2 | |||||||
| 1916 | 2 | |||||||
| Miami | 1910 | 34 | ||||||
| 1911 | 33 | 9 | 32 | 391 | 423 | |||
| 1912 | 24 | 3 | 30 | 388 | 418 | |||
| 1913 | 27 | 15 | 4 | 14 | 510 | 6,7337,243 | ||
| 1914 | 28 | 99 | 19 | 11 | 6131 | 20,125 | 20,738 | |
| 1915 | 116 | 38 | 13 | 9 | 351 | 9,384 | 9,735 | |
| 1916 | 145 | |||||||
| Montgomery | 1910 | 450 | 8 | 27 | 324 | 30,015 | 30,339 | |
| 1911 | 431 | 38 | 31 | 58 | 851 | 45,307 | 46,158 | |
| 1912 | 411 | 101 | 2 | 68 | 3,548 | 51,684 | 55,232 | |
| 1913 | 444 | 558 | 25 | 35 | 5,647 | 55,203 | 60,850 | |
| 1914 | 967 | 127 | 54 | 60 | 5.301 | 67,271 | 72,572 | |
| 1915 | 1,034 | 145 | 38 | 131 | 6,974 | 144,616 | 151,590 | |
| 1916 | 1,048 | |||||||
| Neosho | 1910 | 185 | 2 | 5 | 16 | 610 | 12,502 | 13,112 |
| 1911 | 170 | 26 | 1 | 13 | 1,050 | 3,798 | 4,848 | |
| 1912 | 183 | 24 | 5 | 39 | 1,7781 | 3,860 | 5,638 | |
| 1913 | 1681 | 244 | 15 | 7 | 724 | 24,823 | 25,547 | |
| 1914 | 405 | 26 | 21 | 47 | 1,844 | 21,075 | 22,919 | |
| 1915 | 384 | 53 | 18 | 23 | 1,660 | 25,052 | 26,712 | |
| 1916 | 414 | |||||||
| Summer | 1914 | 3 | ||||||
| 1915 | 1 | |||||||
| Wilson | 1910 | 196 | 3 | 3,572 | 20,398 | 23,970 | ||
| 1911 | 193 | 6 | 23 | 1,518 | 14,860 | 16,378 | ||
| 1912 | 170 | 9 | 1 | 10 | 1,050 | 6,822 | 7,872 | |
| 1913 | 169 | 33 | 4 | 40 | 15,624 | 15,664 | ||
| 1914 | 198 | 7 | 5 | 28 | 800 | 15,989 | 16,789 | |
| 1915 | 177 | 10 | 3 | 25 | 198 | 10,603 | 10,801 | |
| 1916 | 162 | |||||||
| Woodson | 1913 | 3 | 1 | |||||
| 1914 | 3 | 2 | 2 | 1 | 1,080 | 1,080 | ||
| 1915 | 4 | 2 | 42 | 42 | ||||
| 1916 | 2 | |||||||
| (a) Includes Elk and Coffey counties. (b) Included with Chautauqua county. |
||||||||
It is noteworthy that the number of wells drilled in different portions of the Kansas fields is by no means an indication of their relative importance. For example, both Chautauqua and Montgomery counties have several hundred more wells than Butler county, but the latter, although only recently developed, has probably already produced a larger quantity of oil. The oil-producing wells of Chautauqua and Montgomery counties have a small average output, while the yield from Butler county wells has been, on the average, large.
The average production of newly drilled wells for the first twentyfour hours after completion, and the total volume of the initial production of new wells in Kansas, are shown in the following tables:
| Total and average initial daily production of new wells in Kansas fields 1905-1916, in barrels |
||
|---|---|---|
| Year | Total initial production |
Average per well |
| 1905 | 14,551 | 17.7 |
| 1906 | 5,761 | 15.7 |
| 1907 | 886 | 13.0 |
| 1908 | 1,159 | 16.1 |
| 1909 | 1,309 | 19.0 |
| 1910 | 1,897 | 22.3 |
| 1911 | 3,271 | 19.0 |
| 1912 | 7,245 | 13.5 |
| 1913 | 22,467 | 15.8 |
| 1914 | 18,932 | 10.8 |
| 1915 | 11,319 | 18.6 |
| 1916 | 949.264 | 79.0 |
| Initial daily production of new wells completed in Kansas in 1915, in barrels, by counties | |||||||||||||
|---|---|---|---|---|---|---|---|---|---|---|---|---|---|
| County | Jan. | Feb. | March | April | May | June | July | Aug. | Sept. | Oct. | Nov. | Dec. | Total |
| Allen | 25 | 40 | 5 | 35 | 65 | 95 | 235 | 500 | |||||
| Butler | 90 | 25 | 300 | 2,905 | 3,320 | ||||||||
| Chautauqua | 545 | 675 | 55 | 20 | 90 | 40 | 55 | 75 | 150 | 240 | 570 | 2,515 | |
| Coffey | 5 | 5 | 10 | 20 | |||||||||
| Cowley | 15 | 40 | 5 | ||||||||||
| Franklin | 25 | 20 | 20 | 15 | 25 | 40 | 20 | 50 | 70 | 125 | 210 | 620 | |
| Labette | 30 | 20 | 55 | 105 | |||||||||
| Linn | |||||||||||||
| Miami | 70 | 15 | 10 | 5 | 5 | 159 | 198 | 462 | |||||
| Montgomery | 201 | 239 | 75 | 65 | 30 | 40 | 45 | 335 | 180 | 340 | 378 | 577 | 2,505 |
| Neosho | 17 | 65 | 35 | 130 | 600 | 335 | 1,182 | ||||||
| Wilson | 10 | 5 | 10 | 10 | 35 | ||||||||
| Totals | 843 | 974 | 230 | 105 | 110 | 130 | 225 | 530 | 370 | 790 | 1,927 | 5,085 | 11,319 |
Plate XXVII—Weekly production of oil in Kansas, April, 1916, to October, 1917. The increase late in October. 1916, was due to the remarkable new wells in the Towanda district, El Dorado field, Butler county. The sudden increase in production in June, 1917, and the steady rise from July to October are due to the great development and remarkable flow of the new wells from this same district. (Data from trade journals.) [Acrobat PDF version available.]
| Total and average initial daily production of new wells in Kansas, 1911-1915, in barrels, by counties | ||||||||||
|---|---|---|---|---|---|---|---|---|---|---|
| County | Total initial production | Average per well | ||||||||
| 1911 | 1912 | 1913 | 1914 | 1915 | 1911 | 1912 | 1913 | 1914 | 1915 | |
| Allen | 353 | 632 | 2,960 | 1,896 | 500 | 11.8 | 12.6 | 19.2 | 10.8 | 10.2 |
| Anderson | 10 | 10.0 | ||||||||
| Bourbon | 5 | 5.0 | ||||||||
| Butler | 47 | 3,320 | 9.4 | 15.1 | ||||||
| Chautauqua | 1,355 | 2,963 | 7,358 | 5,379 | 2,515 | 21.2 | 16.3 | 23.7 | 17.5 | 22.5 |
| Coffey | 45 | 20 | 9.0 | 6.7 | ||||||
| Cowley | 150 | 55 | 50.0 | 27.5 | ||||||
| Franklin | 155 | 748 | 1,360 | 620 | 8.6 | 13.9 | 8.3 | 8.7 | ||
| Labette | 15 | 32 | 105 | 7.5 | 4.0 | 5.5 | ||||
| Linn | 30 | 15.0 | ||||||||
| Miami | 920 | 462 | 7.0 | 14.0 | ||||||
| Montgomery | 1,300 | 2,522 | 5,871 | 6,262 | 2,505 | 21.7 | 12.5 | 9.8 | 9.1 | 12.5 |
| Neosho | 208 | 693 | 5,168 | 2,414 | 1,182 | 13.0 | 11.2 | 20.1 | 10.9 | 12.8 |
| Wilson | 35 | 255 | 342 | 268 | 35 | 27.5 | 14.2 | 8.6 | 9.9 | 5.8 |
| Woodson | 5 | 13 | 114 | 5.0 | 6.5 | 9.5 | ||||
| Miscellaneous | 5 | 7 | 5.0 | 3.5 | ||||||
| Totals and averages | 3,271 | 7,245 | 22,467 | 18,932 | 11,319 | 19.0 | 13.5 | 15.8 | 10.8 | 18.56 |
| Total initial daily production of new wells in Kansas, 1911-1915, by months, in barrels | ||||||||||||||
|---|---|---|---|---|---|---|---|---|---|---|---|---|---|---|
| Year | Jan. | Feb. | March | April | May | June | July | Aug. | Sept. | Oct. | Nov. | Dec. | Total | Monthly average |
| 1911 | 155 | 90 | 304 | 161 | 438 | 255 | 285 | 363 | 265 | 380 | 265 | 310 | 3,271 | 273 |
| 1912 | 65 | 173 | 213 | 390 | 352 | 714 | 834 | 940 | 507 | 842 | 1,185 | 1,030 | 7,245 | 604 |
| 1913 | 860 | 1,065 | 1,003 | 1,897 | 1,548 | 1,918 | 1,945 | 2,250 | 2,283 | 2,501 | 2,857 | 2,340 | 22,467 | 1,872 |
| 1914 | 2,077 | 2,196 | 1,950 | 2,083 | 2,411 | 2,178 | 1,820 | 1,395 | 1,006 | 700 | 501 | 615 | 18,932 | 1,078 |
| 1915 | 843 | 974 | 230 | 105 | 110 | 130 | 225 | 530 | 370 | 790 | 1,927 | 5,085 | 11,319 | 943 |
The following table shows the runs, shipments and stocks of the Prairie Oil and Gas Company, and the Prairie Pipe Line Company, October, 1916, to September, 1917, inclusive:
| Runs, shipments and stocks of the Prairie Oil and Gas Co. and the Prairie Pipe Line Co., October, 1916, to September, 1917, inclusive. [From trade journals.] |
|||
|---|---|---|---|
| Month | Runs | Shipments | Stocks |
| 1916—October | 3,255,000 | 3,892,039 | 40,000,000 |
| 1916—November | 3,360,000 | 3,691,269 | 39,500,000 |
| 1916—December | 3,379,000 | 4,056,980 | 39,250,000 |
| 1917—January | 3,410,000 | 4,068,530 | 39,200,000 |
| 1917—February | 3,080,000 | 3,655,531 | 39,000,000 |
| 1917—March | 3,565,000 | 4,172,346 | 38,400,000 |
| 1917—April | 3,600,000 | 4,298,844 | 38,200,000 |
| 1917—May | 3,937,000 | 4,248,116 | 37,900,000 |
| 1917—June | 3,840,000 | 4,218,171 | 37,500,000 |
| 1917—July | 4,185,000 | 4,746,857 | 37,000,000 |
| 1917—August | 4,341,000 | 5,027,727 | 36,400,000 |
| 1917—September | 4,950,000 | 4,967,840 | 35,600,000 |
The following table shows the runs, shipments and stocks of all Oklahoma and Kansas lines, some lines that do not make regular reports being estimated:
| Runs, shipments and stocks of Oklahoma and Kansas, October, 1916, to September, 1917, inclusive. [From trade journals.] |
|||
|---|---|---|---|
| Month | Runs | Shipments | Stocks |
| 1916—October | 8,961,457 | 10,090,854 | 82,551,658 |
| 1916—November | 9,239,496 | 9,654,230 | 82,206,458 |
| 1916—December | 9,150,214 | 9,904,340 | 81,974,458 |
| 1917—January | 9,207,642 | 10,200,970 | 82,728,583 |
| 1917—February | 8,335,853 | 9,079,425 | 82,428,693 |
| 1917—March | 9,715,703 | 10,120,453 | 81,791,000 |
| 1917—April | 9,796,636 | 10,313,411 | 80,988,802 |
| 1917—May | 10,475,547 | 10,697,247 | 80,525,173 |
| 1917—June | 10,098,048 | 10,561,027 | 80,218,516 |
| 1917—July | 11,028,050 | 11,430,690 | 80,063,000 |
| 1917—August | 11,032,811 | 11,799,592 | 81,127,000 |
| 1917—September | 11,574,840 | 11,454,455 | 80,697,418 |
Natural Gas
Although natural gas was reported to be escaping {rom springs in many places in eastern Kansas as early as 1864, the first record of any attempt to utilize the gas was in 1882, when wells were drilled in Miami county about seven miles east of Paola and furnished gas in considerable quantity from a depth of about 300 feet. In 1886 the Paola Gas Company supplied the town of Paola with gas and had 42,240 feet of pipe laid. Southwest of Fort Scott, in Bourbon county, the Fort Scott Economy Fuel Company drilled four wells at about this time and obtained a good supply of gas from a depth of 275 to 295 feet. Gas seepages were reported at La Cygne and Mound City, in Linn county; Girard, Crawford county; Mound Valley, Labette county; Ottawa, Franklin county; but were not developed at this time. Before 1892 a number of the important gas fields were located and producing. In Montgomery county at Coffeyville and Cherryvale wells were producing 1,000,000 to 5,000,000 feet from a 600- to 700-foot sand. In 1893 the Iola field was developing rapidly.
The value of gas produced in Kansas increased 55 percent from 1900 to 1901, with an increase in the number of wells from 21:3 to 256. The wells had a production of from 2,000,000 cu. ft. to 8,000,000 cu ft. per day. The largest wells were located in Neosho, Allen and Montgomery counties. A sudden impetus was given to the development of natural gas in 1904, when the Caney and Independence gas fields in Montgomery county were discovered. The Caney field in the southwest part of the county contained wells yielding from 10,000,000 to 20,000,000 cu. ft. The Independence field had an even larger production, some of the wells producing from 16,000,000 to 37,000,000 cu. ft.
From 1909 to 1912 Kansas ranked third among the states producing natural gas. There was a steady decrease in the production and in the pressure of many of the gas fields in the state, however, and in 1913 Kansas had dropped to fifth place. During this year there was a further decrease in gas production. In 1914 and 1915 the Augusta gas field in Butler county was opened. It contained wells with a capacity of 2,000,000 to 40,000,000 cu. ft. per day and caused a material increase in the total production of the state. This was, nevertheless, not even one-half the production of 1910.
Although the great demand for gas as a fuel in the industrial centers of eastern Kansas and western Missouri has kept up the search for gas, no new fields have been opened up since the Augusta field was discovered. Many of the older fields are entirely unable to supply the market. This shortage of gas, especially for city supply, has been the cause of the recent increase in price, and unless new production of large volume is found the price will not go back to its former figures.
| Quantity of Natural Gas Produced in Kansas in Cubic Feet. Data from Mineral Resources of the United States, U. S. Geol. Survey. |
|
|---|---|
| 1906 | 69,322,633,000 |
| 1907 | 74,526,300,000 |
| 1908 | 80,740,264,000 |
| 1909 | 75,074,416,000 |
| 1910 | 59,380,157,000 |
| 1911 | 38,799,406,000 |
| 1912 | 28,068,370,000 |
| 1913 | 22,884,547,000 |
| 1914 | 22,627,507,000 |
| 1915 | 27,945,908,000 |
| Record of natural gas industry in Kansas, 1897-1915. Data from Mineral Resources of the United States, U. S. Geol. Survey. |
||||||||
|---|---|---|---|---|---|---|---|---|
| Year | Gas produced | Gas consumed | Wells | |||||
| Number of producers |
Value | Number of consumers | Value | New wells | Total number of wells productive Dec 31 |
|||
| Domestic | Industrial | Gas | Dry | |||||
| 1897 | 10 | $105,700 | 3,956 | 20 | $105,700 | 16 | 8 | 90 |
| 1898 | 29 | 174,640 | 6,186 | 44 | 174,640 | 34 | 18 | 121 |
| 1899 | 31 | 332,592 | 10,071 | 71 | 332,592 | 44 | 22 | 160 |
| 1900 | 32 | 356,900 | 9,703 | 65 | 356,900 | 54 | 15 | 209 |
| 1901 | 48 | 659,173 | 10,227 | 72 | 659,173 | 71 | 35 | 276 |
| 1902 | 80 | 824,431 | 13,488 | 91 | 824,431 | 144 | 63 | 404 |
| 1903 | 120 | 1,123,849 | 15,918 | 143 | 1,123,849 | 295 | 66 | 666 |
| 1904 | 190 | 1,517,643 | 27,204 | 298 | 1,517,643 | 378 | 135 | 1,029 |
| 1905 | 171 | 2,261,836 | 46,852 | 601 | 2,265,945 | 340 | 157 | 1,142 |
| 1906 | 130 | 4,010,986 | 79,270 | 990 | 4,023,566 | 331 | 99 | 1,495 |
| 1907 | 196 | 6,198,583 | 149,327 | 1,605 | 6,208,862 | 361 | 163 | 1,760 |
| 1908 | 212 | 7,691,587 | 168,855 | 1,162 | 7,691,587 | 403 | 208 | 1,917 |
| 1909 | 199 | 8,293,846 | 182,657 | 1,160 | 8.,356,076 | 452 | 214 | 2,138 |
| 1910 | 204 | 7,755,367 | 186,333 | 1,412 | 9,335,027 | 392 | 195 | 2,149 |
| 1911 | 232 | 4,854,534 | 199,523 | 907 | 9,493,701 | 301 | 152 | 2,033 |
| 1912 | 253 | 4,264,706 | 195,446 | 1,104 | 8,521,858 | 435 | 200 | 2,106 |
| 1913 | 305 | 3,288,394 | 195,131 | 950 | 6,983,802 | 506 | 253 | 2,297 |
| 1914 | 353 | 3,340,025 | 187,714 | 1,079 | 7,163,746 | 445 | 219 | 2,261 |
| 1915 | 371 | 4,037,011 | 201,133 | 1,446 | 8,174,289 | 554 | 194 | 2,443 |
| Depth and rock pressure of wells in Kansas, 1906-1915, by counties | |||||||||||
|---|---|---|---|---|---|---|---|---|---|---|---|
| County | Depth (feet) |
Pressure (pounds) | |||||||||
| 1906 | 1907 | 1908 | 1909 | 1910 | 1911 | 1912 | 1913 | 1914 | 1915 | ||
| Allen | 600-1,500 | 40-400 | 10-300 | 5-300 | 5-300 | 15-350 | 5-351 | 10-300 | 5-260 | 6-240 | 5-300 |
| Anderson | 230-1,070 | 65-240 | 43-200 | 65-200 | 65-200 | 40-150 | 60-225 | 30-240 | 65-250 | 65-225 | 60-225 |
| Bourbon | 150-800 | 5-60 | 50 | 50 | 75 | 35-45 | 40 | 40 | 75 | 75 | 80 |
| Butler | 1,330-1,650 | 75-450 | 40-640 | 40-500 | 40-550 | 65-450 | 60-525 | 50-560 | 400-600 | 300-500 | |
| Chase | 64-1,100 | 48-100 | 17-300 | 17-300 | 10-350 | 1-400 | 7-80 | 3-95 | 10-160 | 6-160 | |
| Chautauqua | 300-1,700 | 75-320 | 50-280 | 50-260 | 60-500 | 40-500 | 25-250 | 50-300 | 35-410 | 40-210 | 25-425 |
| Cowley | 575-1,500 | 75-320 | 25-150 | 20-26 | |||||||
| Crawford | 100-640 | 5-60 | 25-150 | 20-26 | 55-80 | 4-65 | 20-40 | 15-50 | 40-50 | 80-90 | 40-176 |
| Douglas | 350-450 | 150-180 | 60-230 | 5-170 | 40-180 | 10-100 | 30-120 | 10-280 | 20-60 | 10-180 | 20-610 |
| Elk | 500-1,400 | 80-290 | 10-300 | 100-215 | 40-200 | 100-225 | 100-225 | 100 | 90-100 | 75 | 40 |
| Ellsworth | 950-1,250 | 125-270 | 240-270 | 160-250 | 195-275 | ||||||
| Franklin | 160-720 | 70-75 | 20-225 | 20-260 | 20-200 | 75-210 | 50-220 | 3-260 | 1-500 | 50-210 | 112 |
| Greenwood | 350-400 | 80-290 | 75-450 | 40-640 | |||||||
| Johnson | 130-950 | 150-180 | 60-230 | 5-170 | |||||||
| Labette | 350-1,000 | 250-285 | 80-200 | 80-208 | 60-125 | 50-160 | 25-235 | 23-185 | 20-240 | 50-200 | 42-195 |
| Linn | 85-750 | 25-185 | 9-175 | 10-175 | 10-150 | 12-130 | 22-110 | 6-170 | 20-100 | 20-100 | 10-100 |
| Miami | 160-750 | 70-75 | 20-225 | 20-260 | 20-200 | 75-210 | 50-220 | 3-260 | 1-500 | 40-120 | 45-100 |
| Montgomery | 160-1,600 | 100-650 | 25-530 | 40-530 | 10-350 | 3-295 | 5-350 | 2-515 | 5-700 | 15-400 | 15-175 |
| Morris | 600 | 250 | |||||||||
| Neosho | 490-1,200 | 90-300 | 40-225 | 50-250 | 25-350 | 35-300 | 20-287 | 28-250 | 15-325 | 25-360 | 260 |
| Wilson | 250-1,300 | 135-400 | 70-395 | 50-395 | 25-400 | 12-400 | 20-380 | 15-380 | 15-285 | 12-350 | 30-475 |
| Woodson | 650-1,150 | 75-450 | 40-640 | 90-250 | 200 | ||||||
| Wyandotte | 271-800 | 135-400 | 175 | 160-198 | 150-250 | 50-200 | 40-250 | 40-125 | 30-125 | 85 | 15-75 |
The following cities and towns in Kansas are supplied wholly or in part with natural gas (In 1915. Data from Mineral Resources of the United States, 1915, Pl. II, pp. 1008-1009, U. S. Geol. Survey.):
|
Altamont Altoona Arkansas City Atchison Atlanta Augusta Baldwin City Bartlett Bassett Baxter Springs Belle Plaine Benedict Bentley Bonner Springs Bronson Buffalo Buffville Burden Burlington Burrton Cambridge Caney Carlyle Chanute Chautauqua Springs Cherokee Cherryvale Chetopa Coffeyville Colony Columbus Cottonwood Falls Coyville Deerfield |
Derby Douglass Earleton Edgerton Edna Edwardsville El Dorado Elk City Elk Falls Elm Elmdale Elsmore Empire City Emporia Erie Eudora Eureka Fairhaven Fall River Fort Scott Fredonia Galena Gardner Garnett Gas Greeley Grenola Hackney Halstead Havana Haven Hepler Howard |
Humboldt Hunnewell Hutchinson Independence Iola Jefferson Kansas City Labette La Harpe Lawrence Leavenworth Lenexa Liberty Merriam Moline Moran Mound City Mound Valley Mount Hope Mulvane Neodesoa New Albany New Salem Newton Niotaze North Altoona Olathe Osawatomie Oswego Ottawa Oxford Paola Parsons |
Peru Pittsburg Pleasanton Princeton Rantoul Richmond Roper Rose Savonburg Scammon Scipio Sedan Sedgwick Shawnee Spring Hill Stanley Strong Sycamore Thayer Tonganoxie Topeka Turner Tyro Udall Valley Center Vilas Weir Welda Wellington Wellsville Wichita Winfield Yates Center |
Casinghead Gasoline. Plants for the extraction of the gasoline content of the natural gas have been installed in some parts of the Kansas fields, but to the present this industry is largely restricted to Chautauqua county. Three plants were in operation in 1914 and 1915. This important product from natural gas is receiving more attention each year. The gasoline content of the natural gas used in the Kansas plants ranges from 0.5 to 2 gallons to the thousand cubic feet. [Northrup, J. D., Natural gas: U. S. Geol. Survey, Mineral Resources of the United States, 1914, Pt. II, p. 809, 1915; 1915, Pt. II, p. 1006, 1916.]
Prev Page--Physical and Chemical Properties || Next Page--Allen to Franklin counties
Kansas Geological Survey, Geology
Placed on web Aug. 10, 2018; originally published 1917.
Comments to webadmin@kgs.ku.edu
The URL for this page is http://www.kgs.ku.edu/Publications/Bulletins/3/10_rept.html