Frequently Asked Questions
1) No variation along X-axis. When I run analysis (either auto or manual), all the 1D graphs work but I cannot generate a 2D profile. I get a message that says "Input file [filename].TXT has NO variation along X-axis. Data can not be displayed!" What is the problem?
2) Output file open failure I am attempting to format SEG2 files for SurfSeis running in Windows Vista. I see the message "OUTPUT FILE OPEN FAILURE!" when I attempt "Run Format." I also notice that although I specify Output file 1069kgs, the information just above "Output File Name" in Utils > Format states 1069kgs.DAT.DAT. Any ideas?
3) Invalid data format I'm having problems getting SurfSeis to read my input data. I get the error message "Invalid data format <nnnn.DAT>. Perhaps raw data in SEG-2 format?"
4) Seeing only higher modes I suspect that I do not see the fundamental mode, only higher modes. Is this possible?
5) Defining only higher modes I cannot fit all modes together if I assume the slowest mode is the fundamental. I get a better fit if I assume my slowest mode is the first higher mode. Is it possible to define only higher modes with SurfSeis?
6) RMS error What are the formulas used to calculate RMS error in SurfSeis?
7) RMSE of VS, the RMSE Error and the VS error What formula is used to calculate the RMSE of VS, the RMSE Error and the VS error?
8) New dongle with upgrade Do I get a new dongle when I upgrade my copy of SurfSeis?
9) Lost dongle My dongle is lost. How do I get a replacement?
10) Damaged dongle My dongle is damaged. What do I do?
11) What are the data input limits for SurfSeis?
12) Software known to conflict with the SurfSeis dongle or SurfSeis components.
13) During inversion for some dispersion curves the program closes but it doesn't give me an error.
15) How is the signal-to-noise ratio derived?
16) If you're having issues with Windows and the HASP drivers (which control the HASP dongle)...
17) Multi-mode inversion takes too long.
18) I'm getting the following message: "SurfSeis 4 additional 2-D displays are not licensed."
20) How is the default phase-velocity-frequency image made?
21) What is the inversion algorithm?
23) I am getting the message "__ is not a valid floating point value."
25) Why is one of my SurfSeis forms (i.e., secondary windows) not showing up?
1) When I run analysis (either auto or manual), all the 1D graphs work but I cannot generate a 2D profile. I get a message that says "Input file [filename].TXT has NO variation along X-axis. Data can not be displayed!" What is the problem?
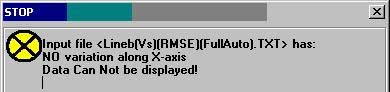
[SurfSeis3] The error "No variation along X-axis" means that all X locations are identical. This can happen as a result of using a fixed spread for all the shot records. When the spread is fixed, then the middle of the spread is always the same. This can be resolved by cutting shorter spreads for each record that changed location, with an identical offset range from each record, emulating roll-along acquisition. Then the middle of the spread of these shorter offset range records will be different. We describe this operation in detail at the following link: How to use a fixed spread with SurfSeis software to emulate a roll-along data acquisition pattern.
2) I am attempting to format SEG2 files for SurfSeis running in Windows Vista. I see the message "OUTPUT FILE OPEN FAILURE!" when I attempt "Run Format." I also notice that although I specify Output file 1069kgs, the information just above "Output File Name" in Utils > Format states 1069kgs.DAT.DAT. Any ideas?
Try a simple folder name, such as c:\TEST. Folder names that are too long sometimes cause problems.
3) I'm having problems getting SurfSeis to read my input data. [SurfSeis3] I get the error message "Invalid data format <nnnn.DAT>. Perhaps raw data in SEG-2 format?"

You need to convert the data to KGS format.
- [SurfSeis2] You can find step-by-step instructions in the v2.05 manual in the Manuals folder in your SurfSeis20 folder. See p. 7, Section 2.2 "Data Processing," which gives instructions for formatting (Step 1) and field setup (Step 2).
- [SurfSeis3] For SurfSeis 3 the interface has changed a little bit but the steps are the same. See p. 3 of the v3.05 manual in the Manuals folder in your SurfSeis30 folder.
4) I suspect that I do not see the fundamental mode, only higher modes. Is this possible?
Yes, we've seen this happen in some geological settings as well.
5) I cannot fit all modes together if I assume the slowest mode is the fundamental. I get a better fit if I assume my slowest mode is the first higher mode. Is it possible to define only higher modes with SurfSeis?
Yes, the inversion will run without a fundamental mode assigned. For optimal results you may still need more tests to tune up the maximum depth of the model.
6) What are the formulas used to calculate RMS error in SurfSeis?
For the equal weight, the rms error at the ith iteration observed during inversion is calculated by the following
where O and T are the observed and calculated phase velocities.
For the weighted case, the rms error is calculated by the following
where wk is the weight of the kth data and tr(w) is the sum of the weights (= ![]() ).
).
7) What formula is used to calculate the RMSE of VS, the RMSE Error and the VS error?
C = [GTG +I]-1GT([GTG +I]-1GT)T,
where G is an m × n matrix and stands for the Jacobian matrix of the inversion system (Xia et al., 1999) at the last iteration, I is the unit matrix, and the superscript T stands for the transpose operation. The root-mean-square (rms) error of each vs is determined by the corresponding diagonal element of matrix C. The formula only gives a rough measure of the rms errors because the damping factor could be varied in a large range at the last iteration.
8) Do I get a new dongle when I upgrade my copy of SurfSeis?
No, the dongle you receive with your first purchase of SurfSeis can be updated by you passing a C2V (customer-to-vendor) file to the SurfSeis Office at SurfSeis@ku.edu. She will generate a V2C (vendor-to-customer) file and return it to you via e-mail after payment (if appropriate) has been made. A new license (and therefore a new dongle) comes only with purchase of another copy of SurfSeis. Instructions for generating a C2V file and applying the returned V2C file are on p. 15-16 of the file "Manual3.05.pdf," which you will find in the C:\SurfSeis30\Manual folder.
9) My dongle is lost. How do I get a replacement?
You must purchase a new copy of SurfSeis to get a new dongle--they are not available by themselves and there is no discount on replacement. Your SurfSeis program cannot run without the dongle, so it is very important that you do not lose it.
10) My dongle is damaged. What do I do?
In general a damaged dongle means you need to purchase a new license. However, there is a chance your dongle can be recovered. If you ship us the dongle we will try to recover it. If we are able to do so, you will be responsible only for handling and return shipping charges.
11) What are the data input limits for SurfSeis?
While there are no formal limitations, header-word numbers cannot exceed 32768 because of a header format limitation. This limitation affects the following parameters:
- The total number of shots
- The number of samples per trace
- The number of traces per shot
- The Shot and Receiver station numbers
- The CMP number. This number is formed by the sum of the Shot and Receiver stations. If these stations are above 16001, for example, because you had a line #16, then at some combination of station numbers they would become greater than 32768 and be wrongly written into the header, causing an error message.
SurfSeis has been tested in-house with huge data sets and it worked fine.
12) Software known to conflict with the SurfSeis dongle or SurfSeis components.
System: Windows Vista
Software: AT&T Communication Manager
Fix: The computer did not acknowledge the presence of the dongle while AT&T Communication Manager was installed on the computer. Removing the AT&T software allowed the system to "see" the dongle again.
System: Windows (version unknown)
Software: CylancePROTECT
Issue: This security system quarantines the required file HRLRTLDKia32.dll.
Fix: Unknown.
13) During inversion for some dispersion curves the program closes but it doesn't give me an error.
Check your data points or the velocity model. One or more of your values is unrealistic or you may have random points on your dispersion curve that were not edited out. Once you correct this, your dispersion curves should complete processing normally.
14) The inversion algorithm generates systematically shallow reverse Vs at the very top of the section (e.g., around 3-5 m depth), even if the dispersion curve is monotonically decreasing and doesn't exhibit any velocity inversion for high frequencies.
This can happen if you do not have enough high frequency data to support any layers below half of the shortest wavelength.
15) How is the signal-to-noise ratio derived?
Signal-to-noise ratio is defined as S/N where S is the root-mean-square amplitude for the whole trace, and N is the root-mean-square amplitude within the user-defined noise window. Or
where a[i] = seismic amplitude at sample i,
M = total samples in the seismic trace, and
W = number of samples in the user-defined noise window.
With this approach, traces with large amplitudes in the noise window will tend to have small signal-to-noise ratio. The amplitude of the point that is selected related to the rest of the amplitudes at that frequency. It serves just for qualitative assessment of that point.
16) If you're having issues with Windows and the HASP drivers (which control the HASP dongle)...
Here are possible steps to update to the most recent HASP dongle driver:
- Unplug your SurfSeis dongle from your computer.
- Go to https://supportportal.thalesgroup.com/csm/?id=sentinel.
- There are six boxes on this screen. Click on the box labeled Drivers and Downloads.
- On the Sentinel Driver and Downloads Page click on Sentinel HL, LDK, HASP Drivers.
- In the list of downloads, find the most recent HASP/LDK Window GUI Runtime Installer.
- On the next page, toward the bottom of the next page it says Click here to download file. Click that link and follow the instructions to upgrade the Sentinel LDK Run-time Environment on your machine.
- When you have completed installation, plug your SurfSeis dongle back in to your computer.
17) Multi-mode inversion takes too long.
When picking more than one mode at any picked frequency, the software calculates (interpolates) the .dc values for the other modes involved, as well. Because of this the number of actual dispersion curve points can increase significantly, but this is what the actual inversion algorithm requires. At a given frequency the phase velocities of all modes involved need to be used as input, so you may end up with too many points (and a long inversion time). The increased amount of dispersion-curve data--which is actually used by the inversion algorithm--is now stored by the program in .dct files. These data are different (they have more points) than the originally picked dispersion curves saved in .dc files. Use a few points when picking more than one mode, especially points in the range where mode frequency ranges overlap.
18) I'm getting the following message: "SurfSeis 4 additional 2-D displays are not licensed."
You are running SurfSeis 4 software with a dongle that is only licensed for SurfSeis 3. At the time you purchased your SurfSeis 4 software your staff member corresponding with us would have received a V2C file that should have been applied to your dongle to give you access to new SurfSeis 4.0 features. If you do not know who received your V2C file, or for other reasons do not have access to your V2C file, please contact the SurfSeis Office (kgs-exploration@ku.edu). State your new SurfSeis 4 serial number (4Annnn) [or any details you know about the upgrade purchase] and provide name and email address of the primary SurfSeis user (if it is someone other than you).
19) I have installed SurfSeis 4.2 and upgraded my dongle. The v4.2 program works except that the HRLRT option does not appear anywhere (my window looks like Figure 2 on p. 2 in the SurfSeis 4 users manual). What's the problem?
The HRLRT was developed for Active data and you are working with a Passive data set. The HRLRT radio button is not displayed when working with Passive data, indicating that this function is not available with this type of data. When working with Active data, this window will appear as shown in Figure 20a (p. 15) of the SurfSeis 4 users manual.
20) How is the default phase-velocity-frequency image made?
- Transformation of seismic data to a phase-velocity-frequency image is based on the method described by
- Park, C.B., R.D. Miller, and J. Xia, 1998, Imaging dispersion curves of surface waves on multi-channel record: [Exp. Abs.]: Soc. Explor. Geophys., p. 1377-1380.
21) What is the inversion algorithm?
- The inversion data is based on the gradient iterative method described by
- Xia, J., R.D. Miller, and C. B.Park, 1999, Estimation of near-surface shear-wave velocity by inversion of Rayleigh waves: Geophysics, v. 64, p. 691-700.
- The following two articles will give you background information on higher modes.
- [SurfSeis3] Xia, J., R.D. Miller, C.B. Park, and G. Tian, 2003, Inversion of high frequency surface waves with fundamental and higher modes: Journal of Applied Geophysics, v. 52, p. 45-47.
- Luo, Y., J. Xia, J. Liu, Q. Liu, S. Xu, 2007, Joint inversion of high-frequency surface waves with fundamental and higher modes: Journal of Applied Geophysics, v. 62, p. 375-384.
22) How do I export a data file (*.dat; seismic or dispersion-curve image[OT]) so that it can used in other software?
Open a *.dat or *OT).dat file from View > Seismic data. Seismic data will be displayed. If it is a dispersion-curve image file it will be displayed in the window for viewing seismic data but it will be in color. Make sure the "Record" toolbar buttons are available, i.e., you see the blue arrows for navigating from one record to another. If you do not see these buttons, click on the "Record" sign (button) at the top left to activate these buttons. The ninth button to the right will save the data as a 3 column .txt file.
23) I am getting the message "__ is not a valid floating point value."
24) What correlation relationship/method does SurfSeis use to transform between shear wave velocity profiles and SPT blow count profiles?
The Vs to SPTN coefficients, 78 and 0.4, are from Anbazhagan and Sitharam (2008), who also mention the Japan Road Association coefficients, 100 and 0.333 for clayey soil, and 80 and 0.333 for sandy soil. Users can specify different values consistent with their site at the SPT N tab of the "View *.LST File(s)" form accessible from the main menu.
Anbazhagan, P., and T.G. Sitharam, 2008, Mapping of Average Shear Wave Velocity for Bangalore Region: A Case Study, Journal of Environmental and Engineering Geophysics, 13, 69-84. http://library.seg.org/doi/abs/10.2113/JEEG13.2.69
25) Why is one of my SurfSeis forms (i.e., secondary windows) not showing up?
If one or more of your secondary SurfSeis windows are no longer visible, then it is possible that your Windows' registry got damaged and some of the window coordinates became significantly larger than the size (in number of pixels) of your monitor(s). SurfSeis uses the registry to remember various parameters for a user's convenience, including the locations of various menu windows.
Here's how you fix this problem:
Launch Windows' "Registry Editor," find the SurfSeis software registry folder--e.g., Computer\HKEY_CURRENT_USER\SOFTWARE\KGS\SurfSeis6--containing the variables used to remember your last settings.
Make sure variables related to the locations of secondary windows do not have unrealistic numbers, such as a value greater than the pixels on your screen.
If you find an extreme value, change it to a small number, which would determine the pixel location or size on your screen.
Do not change anything else in the registry. Close Windows' "Registry Editor."