![]()
Prev Page--Paleozoic rocks, Cretaceous System || Next Page--Well Records
Geologic Formations and their Water-bearing Properties, continued
Quaternary System
Geology by S. W. Lohman, Hydrology by V. C. Fishel
Pleistocene Series
Belleville formation
Redefinition of name--The Belleville formation in northern Republic County was named and described by Wing (1930, pp. 19-21) who stated (p. 21) concerning its age:
It is clearly of Tertiary age and probably equivalent to a part of the Ogallala formation of western Kansas, but because of great distance the correlation is made provisionally. . . . Middle Pliocene age is indicated by the identification of teeth of trilophodon, a bunomastodon or long-jawed Proboscidean represented among living forms by the elephant.
After a detailed study of the Pleistocene deposits of Nebraska Lugn (1934, p. 355; 1935, p. 197) stated:
The "Belleville formation" of northern Republic County, Kansas, described as sand, gravel, and clay, and assigned to the Tertiary on the basis of two questionably identified Mastodon teeth, is the extension of the fluviatile Pleistocene sand and gravel formations of Nebraska. The formation is continuous with the Pleistocene deposits (Grand Island formation) in Nuckolls and Thayer Counties. Equus and other Pleistocene mammalian remains have been gotten from the same deposits at the same locations described by Mr. Wing. Since the "Belleville formation" has been defined and described in print as a Tertiary formation; and, while it seems to be wholly or in part a southeastward extension of the Grand Island formation in Nebraska, it is not as typical in its development in Republic County, Kansas, as at Grand Island, Nebraska; it is believed best to recommend the acceptance of the term Grand Island for this upper sand and gravel sheet, in preference to the application of "Belleville," even in a redefined sense. Also, there is some possibility that the lower part of the sand and gravel in this vicinity may include the Fullerton formation and more or less of the Holdredge sand and gravel. However, well logs at Chester, Byron, and Deshler do not suggest the presence of these lower units, and, so far, it appears to be only the Grand Island formation which seems to occupy the "Chester basin" and the buried channel, which extends from west to east across Republic County, Kansas.
I agree with Lugn as to the Pleistocene age of the Belleville formation, for which additional paleontologic evidence is given below, but I am not in agreement with Lugn that the name Belleville should be discarded and that the deposits in northern Republic County be classed as Lugn's Grand Island formation, for these reasons. (1) The name Belleville assigned by Wing in 1930 has priority, even though the age assigned by Wing obviously was incorrect (though it is not to be inferred that priority alone be given undue weight without other substantiating evidence). (2) The Pleistocene deposits in northern Republic County seem to be equivalent not only to Lugn's Grand Island formation but also to his underlying Fullerton and Holdrege formations except that here his three units cannot be recognized and differentiated and hence his formational names are not usable. The possible existence of representatives of the two lower units in northern Republic County was admitted by Lugn in the quotation given above, but he suggested the probable absence of the Holdrege on the grounds that the Fullerton was not detected in the logs of wells from the area. That Lugn's Fullerton formation does not everywhere separate the other two formations and hence that all three units are of doubtful formational rank is well stated by Cady (in press) who describes the Pleistocene deposits in and near the Republican River Valley in southern Nebraska just upstream from Republic County:
The early Pleistocene sand and gravel deposits were studied by Lugn in the Platte Valley and upland area between that valley and the valley of the Republican. . . . Lugn found that many of the wells and test holes in the areas studied by him encountered a layer or zone of fine-grained material at some point about midway between the top and the base of the sand and gravel deposit, and that in many localities the owners and drillers of water wells recognized an upper and a lower source of water. . . . Believing the lower gravel, the intervening bed of finer-grained material (in some places clay, in other places silt, clayey sand, silty sand, or fine sand) and the upper gravel to be appropriately continuous, he [Lugn] proposed formational status for them, and offered the respective names of Holdrege formation, Fullerton formation, and Grand Island formation. . . .
Without going into a critical discussion of the inferences and evidence that support Lugn's classification, it is necessary to remark that in the Republican Valley area the early Pleistocene sand and gravel deposit is not divisible into a lower and upper part, since no distinctive zone of clay or other fine-grained material is seen in the outcrop nor encountered in wells and test holes. Hence, the formational names cannot be used.
Inspection of the logs given at the end of this report and of the cross sections in Plate 5 will indicate that the same holds true in northern Republic County. Thin lenses of fine-grained material separating larger bodies of sand and gravel were encountered in test hole 11 (cross section E-E') but were not persistent enough to carry through to test hole 12 near by. Similar discontinuous lenses are shown in cross sections D-D' and G-G' (Pl. 5). Such lenses can hardly be regarded as constituting a formation; hence there seems to be no good reason for assigning separate formational names to the units of sand and gravel immediately above and below such lenses. Moreover, where such lenses are absent the sand and gravel forms a single lithologic unit.
For the reasons given above, the name Belleville formation is retained in this report to designate the stream-deposited sand and gravel in northern Republic County that occurs in and near the channel of the ancestral Republican River and below the loess, but it is redefined as being of Pleistocene age. Fossil evidence and correlation in support of this redefinition are given below under Age and correlation.
Character--The Belleville formation consists mainly of crossbedded coarse sand containing beds and lenses of medium to coarse gravel, but also contains thin lenses of clay, some of which are green and gritty. Much of the sand and gravel is stained or streaked by iron oxide giving outcrops a rusty brown appearance. Some beds are partly cemented but most of them are unconsolidated. The finer grains are composed mainly of quartz or pink feldspar and the larger pebbles are mainly of pink granite.
The Belleville is poorly exposed in most parts of northern Republic County, being generally covered by "loess" and in places covered by dune sand. It is exposed at a few sand and gravel pits north of Belleville (Pls. 1 and 7B), in a sand and gravel pit northeast of Republic City in sec. 20, T. 1 S., R. 4 W., and along some of the small streams. An excellent exposure of the equivalent Pleistocene sand and gravel in Nebraska is shown in Plate 7A.
Distribution and Thickness--The general distribution of the Belleville formation in northern Republic County is shown on Plate 1 and is taken from a geologic map prepared by Wing (1930, Pl. 2). The mapped area may include some reworked younger sand and gravel and is also the area underlain by the thickest deposits of "loess" and by dune sand, so that the exact boundaries are difficult to determine.
The Belleville ranges in thickness from a few feet along the southern margin of its outcrop to 30-40 feet in places north of Belleville, and attains its maximum thickness of about 120 feet in the deepest part of the channel of the ancestral Republican River southwest of Chester, Nebraska (Pl. 5).
Age and correlation--Vertebrate fossils collected from sand and gravel pits in the Belleville formation during the present investigation and some collected by previous investigators were examined by Claude W. Hibbard, formerly of the Museum of Vertebrate Paleontology, University of Kansas, who made the following statement (personal communication, Nov. 8, 1945):
The Stegomastodon molar (no. 395) which was taken by Elias and Wing in the McCullough sand pit in sec. 16, T. 2 S., R. 3 W., teeth of Equus cf. excelsus Leidy (no. 6642) from the gravel pit in the SW SE sec. 20, T. 1 S., R. 4 W., as well as the isolated Steqomostodon teeth and the Imperial elephant tooth that I examined from the Republic County gravel pits indicate mammals that lived in that area during early Pleistocene time.
The Belleville formation seems to be correlative wholly or in part with the Holdrege, Fullerton, and Grand Island formations of Lugn in southern Nebraska, though no divisions of his formations seem possible in this area. The possible time of deposition of the Belleville within the Pleistocene is discussed on pp. 31-32.
Water supply--Information regarding ground-water conditions in the ancestral Republican River Valley is based on the records of the domestic and stock wells in the area, the Belleville municipal wells that were drilled in 1927, and the test drilling by the Federal and State Geological Surveys in 1942. The farm wells penetrate only a few feet into the saturated gravel and sand and hence are a poor index of the availability of ground water in the area. They yield adequate water for domestic and stock use with small drawdowns. Many farmers in the area had reported that their wells yielded "unlimited quantities" of water, but the ground-water potentialities of the formation remained unknown until 1927 when the Layne-Western Company drilled test holes in their search for a water supply for Belleville. Prior to 1927, Belleville obtained its water supply from deep wells in the Dakota formation located within the city limits (pp. 59-61). These wells yielded rather brackish water. After test drilling for a new water supply near Belleville proved unsuccessful, the Layne-Western Company undertook a test drilling program to check the. numerous reports of the large available supplies in the Belleville formation. The resulting wells located in section 2, T. 1 S., R. 3 W. penetrated approximately 100 feet of saturated coarse gravel, and yield 425 gallons a minute with a drawdown of 4.5 feet. Thus, the specific capacity of the wells is 94 gallons a minute per foot of drawdown.
The thick deposits of loess overlying much of the Belleville formation are relatively impermeable; hence ground-water recharge of the Belleville formation is probably very small. Recharge to the Belleville probably is much better in a limited area northeast of the City of Republic in which the Belleville is overlain by dune sand.
A perennial water supply from this formation will depend largely on the movement of ground water into the area from the sides of the formation, most of which will be from the north from Nebraska and from the recharge area northeast of the City of Republic where the surface deposits are composed of dune sand. The direction of movement of the ground water is shown by Plate 8.
Data are not available concerning the permeability of the gravel and sand deposits of the Belleville formation; hence it is not feasible to attempt an estimation of the perennial water supply that could be obtained. The Belleville municipal wells would probably yield as much as 2,000 gallons a minute with adequate drawdown based on a specific capacity of 94 gallons a minute per foot of drawdown. It would be unwise to concentrate many wells of large capacity in a small area, however, as the resulting drawdown would be large.
The water table is too deep in most of the area for economical irrigation at the present time and it seems unlikely that in the next few decades there will be much withdrawal of water for irrigation. Unless new industries are brought into the area the perennial water supply of the formation will be more than adequate to supply the needs of the domestic and stock supplies and the municipal water supplies of the cities located in or adjacent to the area.
Water from the Belleville formation is relatively hard, but it is suitable for most ordinary uses. The iron content is relatively high in most of the area.
Loess
General features--Two distinct types of "loess" separated by a well-defined soil zone cover most of the area underlain by the Belleville formation (Pl. 1) and also cover some of the interstream areas and valley sides in parts of the area south of the mapped limits of the Belleville. The probable origin and some of the characteristic features of the loess are discussed on pp. 32-33.
The lower "loess," which is not all loess or silt but contains also beds and lenses of sand, gravel, and clay and some calcareous material, generally is reddish brown and contains at the top a well defined dark soil zone. The lower part of the material seems to have been stream-deposited and reworked in part from the underlying materials-the Belleville formation or some of the Cretaceous formations. The upper part of the lower "loess" may have been deposited by water or by wind, and consists mostly of silt and fine sand. The lower "loess" ranges in thickness from a feather edge to about 100 feet--the maximum thickness being found over the ancestral Republican River Valley.
The upper grayish-buff to yellow silt or "loess" overlies the soil zone except in places where the lower "loess" has been removed by erosion. It ranges in thickness from a feather edge to perhaps 20 or 30 feet.
Good exposures of the "loess" may be seen along the bluffs bordering the Republican River Valley north of the City of Republic, between Norway and, Scandia, just west of Concordia, and along road cuts and small streams in parts of the uplands. An especially good exposure showing the entire sequence was observed along a small stream in the NE SE NE sec. 13, T. 1 S., R. 5 W., and is shown in Plate 6B. A similar sequence several hundred feet west of the section shown in the photograph was measured by Charles C. Williams and Claude W. Hibbard, and is given below:
| Measured section of "loess" in the NE SE NE sec. 13, T. 1 S., R. 5 W. | Thickness | |||
|---|---|---|---|---|
| feet | inches | |||
| Soil, dark brown | 2 | 0 | ||
| Quaternary--Pleistocene | ||||
| "Peorian loess" | ||||
| Silt, buff; contains some fine to medium sand and some pebbles 1/2-inch in diameter. Where photo (Pl. 6B) was taken this interval is only 4 feet thick and is composed of fine to coarse sand and some tan silt | 9 | 5 | ||
| "Loveland loess" | ||||
| Soil zone, light brown, sandy | 2 | 3 | ||
| Sand, fine to coarse; contains some silt and some pebbles up to 2 inches in diameter | 5 | 0 | ||
| Clay, dark brown | 0 | 6 | ||
| Sand, fine to coarse, and some buff to brown silt | 7 | 8 | ||
| Belleville formation | ||||
| Sand, fine to coarse, and some gravel; cross-bedded. (To bed of stream) | 3 | 0 | ||
A less complete section along a road cut just south of the Chicago, Rock Island, and Pacific Railway cut in the SW NW sec. 24, T. 2 S., R. 2 W. was measured by Charles C. Williams and S. W. Lohman, as follows:
| Measured section of "loess" in the SW NW sec. 34, T. 2 S., R. 2 W. | Thickness, feet |
||
|---|---|---|---|
| Soil | |||
| Quaternary--Pleistocene | |||
| "Peorian loess" | |||
| Silt, buff; contains fragments of reworked Cretaceous rocks | 4 | ||
| "Loveland loess" | |||
| Soil zone, dark, silty | 2.3 | ||
| Silt, clayey, buff to tan | 5 | ||
| Gravel, fine | .6 | ||
| Sand, medium, gray, grading downward to coarse sand and fine gravel | 1.6 | ||
| Caliche | .1-.2 | ||
| Cretaceous--Gulfian | |||
| Carlile shale | |||
| Shale, yellow; contains brownish streaks, very fossiliferous (To bottom of exposure) | 4 | ||
Age and correlation--The age of the material within the Pleistocene and correlation with equivalent units in Nebraska is discussed on pp. 32-33. The lower reddish-brown "loess" and overlying soil zone are correlative with the Loveland loess of Nebraska, and the upper gray-buff to yellow "loess" is correlative with Lugn's Peorian loess of Nebraska. The entire sequence seems to be correlative also with the Sanborn formation of western Kansas (Elias, 1931, p. 163), which has been traced as far eastward as Jewell County by Hibbard, Frye, and Leonard (1944).
Fossil material collected from the lower reddish-brown "loess" during the course of the investigation was examined by Claude W. Hibbard, Museum of Vertebrate Paleontology, University of Kansas, who stated as follows (personal communication, Nov. 8, 1945):
The materials collected from the "Loveland" in the NW corner, sec. 18, T. 3 S., R. 4 W., are the remains of the Prairie-dog Cynomys ludovicianus (Ord) (Nos. 7313-7322), and are the same as other Prairie-dog remains which are found in deposits of this age to the west. So far as known Cynomys ludovicianus does not appear in deposits earlier than late Pleistocene.
Water supply--No water is obtained from the "loess" deposit because they lie above the zone of saturation. Because "loess" has low permeability, it retards the downward movement of rain water and thus hinders the recharge of the ground-water reservoir.
Pleistocene and Recent Series
Alluvial material of Pleistocene and Recent age is found principally in the Republican River Valley and in the valleys of some of the creeks (Pl. 1). Creeks having little or no alluvium include Rose, Mill, Beaver, Oak, East Marsh, White Rock, and Otter Creeks.
The alluvium is typical of stream-laid deposits, ranging in texture from silt to sand and coarse gravel. The youngest deposits consist largely of sand and silt deposited over the flood plain in time of flood or under normal conditions in the channel of the stream. Beneath the finer surficial deposits are beds of sand and gravel that are somewhat older. The older alluvium in the Republican River Valley is of Pleistocene age. The character, age, and origin of this alluvium and of the associated terrace deposits are discussed on pages 33-36, and its distribution, thickness, and hydrologic character are discussed below in a separate section.
The smaller stream valleys are partly filled with alluvium consisting mainly of silt and fine sand, but some, such as the valley of Salt Creek (Pl. 5, section M-M') contain some gravel. Good exposures of the alluvium along Riley Creek, a tributary of Salt Creek, are found in the NW sec. 1, T. 4 S., R. 3 W. An old gravel pit revealed a section capped by 8 to 10 feet of reddish-brown silt containing many small pebbles of limestone. This material resembles the lower water-laid part of the "Loveland" loess. The silt is underlain by about 30 feet of cross-bedded coarse sand and fine to medium gravel containing some angular fragments of ironstone which may have been derived from the Dakota formation. Only part of the 30 feet of sand and gravel is exposed, the rest having been encountered in sinking a near-by well (209). The same sequence of materials is exposed just to the north along the south bank of Riley Creek, except that here about 3 or 4 feet of the gravel has been cemented to a hard conglomerate. As noted, some of the Belleville formation may have been deposited along southward-flowing streams this far south of the old drainage divide, but the presence of the fragments of ironstone plus the lime-cemented gravel suggest that the material probably was derived at later date from erosion of the Belleville formation.
Alluvium of the Republican River Valley
Distribution and Thickness--Republican River enters Republic County about 1 mile south of the northwest corner. of the county, then flows south, entering Cloud County about 8 miles east of the western border where it turns southeast for about 8 miles and then flows east, leaving Cloud County about 6 miles south of the Cloud-Republic County line. The Republican River Valley ranges in width from 1.4 miles near Scandia to 3.6 miles near Concordia.
The alluvium in the Republican River Valley consists at the top of sand and silt deposited over the flood plain in time of flood or under normal conditions in the channel of the stream. Beneath the finer surficial deposits are layers of sand and gravel. The alluvium supplies water to many domestic and stock wells in the valley and yields abundant supplies to some irrigation wells. Very little was known concerning the thickness, character, and distribution of the alluvium, and the quality of the water, other than from the statements of many well owners.
In order to determine the thickness, character, and extent of water-bearing alluvium on both sides of the river and the locations of any deep channels that might have been excavated into bedrock, 45 test holes were put down along the five lines shown in Plate 2. The test holes were drilled through the entire thickness of alluvium and from 1 to 10 feet into the underlying bedrock. Samples of material were collected at regular intervals or whenever the slightest change in the character of the material was noted.
The results of the test drilling are shown graphically in Plate 5, are given in the logs at the end of this report, and were used in drawing the contours on the bedrock shown in Plate 2. In cross-section B-B' north of the City of Republic the alluvium is shallow but extends over a wide area, a condition resulting from the early geologic history of the valley which is described by S. W. Lohman in an earlier section of this report. The thickness of the saturated sand and gravel deposits at this cross section averages only about 20 feet. In cross section H-H' between Republic and Scandia the valley is narrower but the alluvium is much thicker than at cross section B-B'.
The sand and gravel deposits at Scandia (section J-J') are as much as 70 feet thick but the valley at this point is very narrow--approximately 1 1/2 miles. The deepest part of the bedrock channel is about three-fourths of a mile west of the present river.
The alluvium in cross section K-K' at Norway is about 3 miles wide and in some places is more than 100 feet in thickness. The saturated gravel and sand deposits have a thickness of more than 80 feet. in some places.
The cross section (L-L') at Concordia is comparable to the one at Norway, the alluvium being about 3 1/2 miles wide and a little thicker than at Norway.
Hydrologic properties of the water-bearing materials--The quantity of ground water that a water-bearing formation will yield to wells depends upon the hydrologic properties of the material. The two hydrologic properties of greatest significance are permeability and specific yield. Permeability is a measure of the ability of a formation to transmit water; specific yield is a measure of the quantity of water that the formation will yield when it is drained.
The specific yield of a water-bearing formation is defined by Meinzer (1923, p. 26) as the ratio of (1) the volume of water which, after being saturated, it will yield by gravity to (2) its own volume. It is a measure of the quantity of water that a formation will yield when it is drained by a lowering of the water table.
The permeability of a water-bearing formation is the discharge per unit of area per unit of hydraulic gradient. It may be measured in terms of the number of gallons of water a day, at 60° F., conducted laterally through each mile of the water-bearing bed under investigation (measured at right angles to the direction of flow), for each foot of thickness of the bed, and for each foot per mile of hydraulic gradient (Stearns, 1927, p. 148).
Specific yield--Not all the water in the interstices 01 saturated materials is available for recovery through wells--a fact of great practical importance in the development of ground-water supplies in places where the water comes largely from storage and must be replenished periodically from precipitation or stream flow. A part of the water in the interstices will drain into wells, and a part will be retained in the formation by capillary action. The part that will drain into wells is called the specific yield and the part that is retained is called the specific retention. The specific yield and specific retention are expressed in percentages of the total volume of material. The specific yield and the specific retention of a rock or soil are together equal to the porosity.
Lugn and Wenzel (1938, p. 90) reported that the Pleistocene sand and gravel deposit near Grand Island, Kearney, and Lexington has a specific yield of about 24 percent. Cady (in press) stated that the alluvium in the Republican River Valley in Nebraska has a specific yield of about 18 percent.
Determinations of the specific yield of the alluvium of the part of the valley considered in this report were not made. As shown in Plate 5 the saturated part of the alluvium is composed almost entirely of sand and gravel that is similar in texture and appearance to the material described by Lugn and Wenzel and by Cady. For purposes of indicating the importance of specific yield and the amount of water held in storage that is available for pumping, a specific yield of 18 percent is assumed for the sand and gravel in this area. This is the specific yield given by Cady for the sand and gravel in the Republican River Valley in Nebraska. It is less than the specific yield of the Pleistocene sand and gravel near Grand Island, Kearney, and Lexington, Nebraska. A cubic foot of saturated> material having a specific yield of 18 percent will lose by drainage 0.18 cubic foot of water. Conversely, if an area underlain by such material is covered with water to a depth of 0.18 foot, and all of the water percolates downward to the water table, the water level in a well situated within the area will rise 1 foot.
A column of saturated alluvium 1 mile square and 1 foot thick having a specific yield of 18 percent, if completely drained, would yield 37.5 million gallons of water (115 acre-feet). The saturated part of the alluvium in the Republican River Valley near Norway and Concordia has average thicknesses of about 42 and 57 feet, respectively. Thus, assuming a specific yield of 18 percent, a column of this alluvium 1 mile square, if completely drained, would yield an average of 1.6 billion gallons of water (4,670 acre-feet) at Norway and an average of 2.1 billion gallons of water (6,470 acre-feet) at Concordia. The large quantity of ground water held in storage is available in part for pumping during dry seasons provided that conditions are favorable so that it will be replenished by recharge from precipitation during successive seasons of abundant precipitation or by recharge from the river, or both. Although the above quantities of water may be available from storage, the rate at which the water could be pumped from storage would become progressively lower as the water table declined.
Laboratory determinations of permeability--Samples of material penetrated in test drilling were collected and dried in the field by James B. Cooper and Oscar S. Fent, who also prepared the logs given at the end of this report. When dry, the samples were sacked and taken to the laboratory of the U. S. Geological Survey at Lawrence, where mechanical analyses and determinations of the coefficients of permeability were made by Dwight C. Gilkison.
The samples collected from the test holes were washed to the surface by the drilling mud and therefore cannot be regarded as truly representative of the. materials as they occur. The water or light mud used in drilling may have removed some of the finer particles that occur naturally in the sands and gravels. Despite these difficulties in sampling, however, it is believed that the laboratory determinations of permeability gave values that are of the right order of magnitude for determining the underground movement of water. The coefficients of permeability given below were determined by means of an apparatus designed by C. V. Theis and described by me (Wenzel, 1942, p. 59). The laboratory determinations made on samples of material from the test holes are given in Table 12.
Table 12--Physical properties of water-bearing materials from test holes in the Republican River Valley between the Nebraska State line and Concordia, Kansas. (Collected by James B. Cooper and Oscar S. Fent; analyzed by Dwight C. Gilkison)
| Test hole number on Plate1 |
Depth of sample (feet) |
Mechanical analyses (percent by weight) | Coefficient of permeability2, gallons per day per sq. ft. |
||||||
|---|---|---|---|---|---|---|---|---|---|
| Medium and coarse gravel (larger than 2.0 mm) | Fine gravel (2.0-1.0 mm) | Coarse sand (1.0-0.50 mm) | Medium sand (0.50-0.25 mm) | Fine sand (0.25-0.125 mm) | Very fine sand (0.125-0.062 mm) | Silt and clay (less than .062 mm) | |||
| 25 | 20-33 | 7.2 | 16.8 | 28.2 | 29.4 | 7.0 | 5.8 | 5.2 | 15 |
| 50-60 | 13.6 | 33.1 | 33.0 | 17.1 | 2.2 | .5 | .5 | 2,250 | |
| 70-80 | 45.7 | 22.4 | 17.8 | 9.8 | 2.3 | .9 | 1.0 | 132 | |
| 34 | 10-18 | 30.5 | 22.5 | 23.6 | 19.1 | 2.7 | .5 | 1.1 | 300 |
| 18-30 | 20.5 | 26.2 | 29.8 | 20.6 | 2.2 | .3 | .4 | 1,450 | |
| 30-36 | 3.3 | 42.3 | 43.6 | 9.9 | .7 | .2 | .3 | 4,090 | |
| 35 | 7-10 | 2.7 | 4.0 | 18.1 | 61.8 | 7.9 | 3.0 | 2.6 | 140 |
| 10-16 | .7 | 5.3 | 34.3 | 48.0 | 7.2 | 2.6 | 1.8 | 430 | |
| 38 | 1 1/2-10 | 5.3 | 6.6 | 27.5 | 50.2 | 7.3 | 1.9 | 1.2 | 450 |
| 10-21 1/2 | 14.2 | 14.9 | 23.7 | 33.1 | 7.7 | 4.3 | 2.1 | 135 | |
| 43 | 30-40 | 12.7 | 13.6 | 22.9 | 35.8 | 4.6 | 6.7 | 3.8 | 56 |
| 40-44 | 8.3 | 25.4 | 44.0 | 18.5 | 1.2 | .8 | 1.7 | 820 | |
| 62 | 3-10 | 2.1 | 5.0 | 27.3 | 56.8 | 5.3 | 1.9 | 1.6 | .525 |
| 10-22 | 8.9 | 30.5 | 35.4 | 21.2 | 2.2 | .8 | 1.0 | 1,160 | |
| 65 | 0-10 | .6 | 1.7 | 10.0 | 57.0 | 18.1 | 7.3 | 5.3 | 147 |
| 10-20 | 62.8 | 25.5 | 5.6 | 3.7 | 1.4 | .5 | .5 | 6,200 | |
| 20-30 | 42.3 | 32.4 | 10.9 | 8.6 | 2.9 | 1.3 | 1.6 | 1,100 | |
| 30-40 | 24.5 | 37.0 | 17.5 | 13.7 | 4.2 | 1.5 | 1.6 | 350 | |
| 40-50 | 26.3 | 21.9 | 20.2 | 22.8 | 5.9 | 1.6 | 1.3 | 480 | |
| 50-61 | 38.1 | 28.7 | 12.2 | 13.4 | 4.5 | 1.5 | 1.6 | 193 | |
| 67 | 1-10 | 9.5 | 16.8 | 15.9 | 29.6 | 13.9 | 8.7 | 5.6 | |
| 10-20 | 34.2 | 26.6 | 16.3 | 15.6 | 3.7 | 2.0 | 1.6 | 800 | |
| 20-27 | 33.2 | 25.3 | 22.4 | 14.1 | 3.1 | 1.2 | .8 | 2,100 | |
| 66 | 1.5-7 | 5.3 | 3.8 | 4.9 | 77.2 | 7.6 | .1 | 1.1 | |
| 7-10 | 17.2 | 12.9 | 16.4 | 39.4 | 11.9 | .3 | 1.9 | ||
| 10-20 | 28.3 | 19.7 | 11.1 | 29.8 | 8.3 | 1.5 | 1.3 | ||
| 20-30 | 21.8 | 13.6 | 15.0 | 37.2 | 8.3 | 2.3 | 1.8 | ||
| 30-40 | 16.7 | 12.4 | 12.4 | 40.9 | 7.9 | 4.8 | 2.9 | 18 | |
| 40-50 | 10.2 | 16.6 | 23.4 | 35.0 | 7.8 | 3.9 | 3.1 | 42 | |
| 50-60 | 20.6 | 25.3 | 22.3 | 20.4 | 6.1 | 2.9 | 2.4 | 55 | |
| 60-71 | 9.2 | 26.0 | 24.6 | 26.6 | 7.1 | 3.6 | 2.9 | ||
| 74 | 8-12 | 1.0 | 3.9 | 23.0 | 54.5 | 10.2 | 5.1 | 2.3 | 260 |
| 12-20 | 8.7 | 15.0 | 35.6 | 33.3 | 5.0 | 1.4 | 1.0 | 730 | |
| 20-29 | 2.4 | 8.9 | 40.2 | 41.6 | 5.1 | 1.0 | .7 | 920 | |
| 29-30 | 15.8 | 23.1 | 36.5 | 20.5 | 2.5 | .8 | .8 | 915 | |
| 30-40 | 74.8 | 18.7 | 3.8 | 1.4 | .4 | .4 | .5 | 31,950 | |
| 40-50 | 58.8 | 26.0 | 10.0 | 3.1 | .6 | .6 | .9 | 9,850 | |
| 76 | 10-22 | 12.0 | 24.0 | 32.8 | 25.1 | 3.9 | 1.1 | 1.0 | 760 |
| 30-41 | 13.8 | 29.1 | 33.7 | 19.7 | 2.6 | .5 | .5 | 360 | |
| 78 | 20-26 | 33.6 | 33.3 | 15.6 | 11.9 | 3.6 | .9 | 1.1 | 205 |
| 50-60 | 28.0 | 45.4 | 19.0 | 4.7 | 1.3 | .7 | .9 | 650 | |
| 84-90 | 38.1 | 33.9 | 18.5 | 4.3 | 2.2 | 1.2 | 1.8 | 4,640 | |
| 82 | 40-50 | 19.5 | 58.4 | 9.3 | 3.7 | 1.5 | 2.7 | 5.0 | 400 |
| 64.5-70 | 16.4 | 55.9 | 12.2 | 4.5 | 2.0 | 3.8 | 5.2 | 280 | |
| 84 | 40-50 | 41.5 | 26.7 | 21.4 | 8.4 | .9 | .4 | .7 | 1,800 |
| 55-60 | 74.8 | 16.9 | 4.4 | 1.2 | .5 | .8 | 1.4 | 720 | |
| 97 | 10-18 | 6.1 | 14.4 | 34.0 | 38.1 | 5.3 | 1.4 | .7 | 480 |
| 40-50 | 7.6 | 26.1 | 48.4 | 14.6 | 1.3 | .8 | 1.3 | 710 | |
| 70-80 | 3.6 | 3.0 | 33.8 | 54.1 | 4.5 | .6 | .4 | 350 | |
| 90-100 | 68.0 | 12.9 | 7.1 | 4.4 | 2.1 | 2.0 | 3.5 | 13,100 | |
| 98 | 22-30 | 2.6 | 6.6 | 35.3 | 45.6 | 5.5 | 2.5 | 1.9 | 115 |
| 40-50 | 59.6 | 26.1 | 10.1 | 3.0 | .4 | .3 | .5 | 10,100 | |
| 60-70 | 23.1 | 40.0 | 26.3 | 8.5 | .9 | .5 | .7 | 1,900 | |
| 104 | 7-10 | 6.9 | 11.1 | 19.1 | 48.7 | 5.7 | 5.1 | 3.4 | 65 |
| 20-30 | 28.6 | 55.9 | 9.3 | 2.3 | .9 | 1.3 | 1.7 | 4,600 | |
| 54-60 | .5 | 6.1 | 27.2 | 57.2 | 6.8 | 1.4 | .7 | 420 | |
| 80-86 | 55.3 | 34.7 | 6.3 | 2.0 | .6 | .5 | .6 | 13,100 | |
| 106 | 9-22 | 36.5 | 50.8 | 4.8 | 2.7 | 2.5 | 1.5 | 1.2 | 1,650 |
| 30-38 | 54.1 | 32.6 | 6.9 | 2.6 | 1.8 | 1.1 | .9 | 7,000 | |
| 1. Test holes 25 to 84 were in Republic County; 97 to 106 were in Cloud County. 2. Corrected to standard temperature of 60° F. |
|||||||||
Permeability tests were made on a few samples from representative test holes and the resulting coefficients of permeability were weighted to obtain an average permeability of the alluvium along each cross section. These tests indicate that the permeability 01 the alluvium increases downstream. The coefficients of permeability obtained along cross section B-B' near the City of Republic ranged from an average of about 250 g.p.d. per sq. ft. in the middle of the valley to about 1,500 g.p.d. per sq. ft. in the sands and gravels at the edges of the valley. No permeability determinations were made for section H-H', as these test holes were drilled at a later date. The average coefficient of permeability was about 1,100 g.p.d. per sq. ft. for the Scandia section (J-J'), about 1,400 for the Norway section (K-K'), and about 4,900 for the Concordia section (L-L'). These values are considerably less than the coefficient of permeability obtained from a pumping test on a well east of Concordia, but may be too high because of the fact that they were obtained by tests on disturbed samples of material.
Pumping-test determinations of permeability--The permeability of the alluvium in the Republican River Valley was determined by two pumping tests, using the recovery method involving the formula developed by Theis (1935, p. 522) and also described by Wenzel (1942, p. 94) for computing the transmissibility of an aquifer. (The coefficient of transmissibility is equal to the coefficient of permeability, not corrected for temperature, multiplied by the thickness of the aquifer.)
T = (264 q log10 t/t') / s
in which T = coefficient of transmissibility, in gallons per day per foot,
q = pumping rate, in gallons per minute,
t = time since pumping began, in minutes,
t' = time since pumping stopped, in minutes,
s = residual drawdown at the pumped well, in feet, at time t'.
The residual drawdown (s) is computed by subtracting the static water level before pumping began from appropriate water levels taken from the recovery curve.
The proper ratio of (log10 t/t') to s is determined graphically by plotting (log10 t/t') against corresponding values of s. By plotting t/t' on the logarithmic coordinate. of semi-logarithmic pa.per this procedure is simplified. For any convenient value of (log10 t/t') the corresponding value of s may be obtained from the curve.
Adjustment for temperature in the following pumping tests was unnecessary as the temperature of the water was just slightly under 60° F.
Wright pumping test--A pumping test was made on well 245 (Pl. 10A) completed in May 1942 on the farm of W. T. Wright located 7 miles east of Concordia in the NW SW sec. 25, T. 5 S., R. 2 W. It is the only active irrigation well in the main part of the valley in the vicinity of Concordia and it is illustrative of the type of irrigation wells that could be developed in the valley between Scandia and Concordia. The well was pumped on August 27, 1942, at a rate of 730 gallons a minute from 8:28 a.m. to 2:40 p.m. At the end of the pumping period the drawdown was 12.27 feet, and the specific capacity was about 60 gallons a minute per foot. The water-level measurements made during and following the pumping period are given in Table 13.
Table 13--Water-level measurements in Wright irrigation well (245) made during the pumping test on August 27, 1942 (rate of pumping, 730 gallons a minute)
| Time | Depth to water level, feet |
Remarks |
|---|---|---|
| 8:20 a.m. | 18.43 | Static water level |
| 8:28 a.m. | Pumping started | |
| 8:40 a.m. | 30.32 | |
| 9:10 a.m. | 30.55 | |
| 9:40 a.m. | 30.59 | |
| 10:45 a.m. | 30.62 | |
| 11:40 a.m. | 30.55 | |
| 1:00 p.m. | 30.78 | |
| 2:30 p.m. | 30.70 | |
| 2:40 p.m. | Pumping stopped | |
| 2:40:15 p.m. | 24.13 | |
| 2:41 p.m. | 20.51 | |
| 2:42 p.m. | 19.64 | |
| 2:42:30 p.m. | 19.48 | |
| 2:43 p.m. | 19.38 | |
| 2:43:30 p.m. | 19.32 | |
| 2:44 p.m. | 19.25 | |
| 2:44:30 p.m. | 19.20 | |
| 2:45 p.m. | 19.16 | |
| 2:45:30 p.m. | 19.13 | |
| 2:46 p.m. | 19.10 | |
| 2:46:30 p.m. | 19.08 | |
| 2:47 p.m. | 19.06 | |
| 2:48 p.m. | 19.02 | |
| 2:49 p.m. | 18.99 | |
| 2:50 p.m. | 18.97 | |
| 2:52 p.m. | 18.92 | |
| 2:54 p.m. | 18.89 | |
| 2:56 p.m. | 18.86 | |
| 2:58 p.m. | 18.84 | |
| 3:00 p.m. | 18.82 | |
| 3:05 p.m. | 18.80 | |
| 3:10 p.m. | 18.77 | |
| 3:15 p.m. | 18.76 | |
| 3:20 p.m. | 18.75 | |
| 3:30 p.m. | 18.72 | |
| 3:40 p.m. | 18.68 | |
| 4:00 p.m. | 18.64 | |
| 4:20 p.m. | 18.62 | |
| 4:40 p.m. | 18.59 | |
| 5:00 p.m. | 18.59 | |
| 5:30 p.m. | 18.57 |
In applying the Theis recovery formula to the data given in Table 13, the value of T (coefficient of transmissibility) was found to be 449,000. The coefficient of transmissibility (449,000) divided by the thickness of saturated water-bearing material (47 feet) gives a coefficient of permeability of 9,500.
Ward pumping test--A pumping test was made on well 260 situated on the farm of Roy Ward in the SW NW sec. 31, T. 5 S., R. 3 W. This well was pumped on August 26, 1942, at a rate of 47 gallons a minute from 11:40 a.m. to 1:40 p.m. At the end of the pumping period the drawdown in this well was 24.32 feet, and the specific capacity was only 1.9 gallons a minute per foot of drawdown. This is a very low specific capacity, indicating a very poor well. The water-level measurements made during and following the pumping period are given in table 14.
Table 14--Water-level measurements in Ward irrigation well (260) during the pumping test on August 26, 1942 (rate of pumping, 47 gallons a minute)
| Time | Depth to water level, feet |
Remarks |
|---|---|---|
| 11:30 a.m. | 23.05 | Static water level |
| 11:40 a.m. | Pumping started | |
| 12:05 p.m. | 42.60 | |
| 12:35 p.m. | 47.08 | |
| 1:10 p.m. | 47.38 | |
| 1:40 p.m. | Pumping stopped | |
| 1:45 p.m. | 26.40 | |
| 1:48 p.m. | 24.89 | |
| 1:51 p.m. | 24.57 | |
| 1:53:30 p.m. | 24.49 | |
| 1:54:30 p.m. | 24.45 | |
| 1:56 p.m. | 24.35 | |
| 1:57 p.m. | 24.30 | |
| 11:58 p.m. | 24.24 | |
| 2:00:30 p.m. | 24.13 | |
| 2:02:30 p.m. | 24.13 | |
| 2:05 p.m. | 23.81 | |
| 2:06:30 p.m. | 23.77 | |
| 2:09 p.m. | 23.77 | |
| 2:10:30 p.m. | 23.72 | |
| 2:12:30 p.m. | 23.75 | |
| 2:14 p.m. | 23.72 | |
| 2:16:30 p.m. | 23.72 | |
| 2:20 p.m. | 23.68 | |
| 2:21 p.m. | 23.67 | |
| 2:22:30 p.m. | 23.66 | |
| 2:25 p.m. | 23.65 | |
| 2:35 p.m. | 23.58 | |
| 2:50 p.m. | 23.46 | |
| 2:57 p.m. | 23.42 | |
| 3:14 p.m. | 23.35 | |
| 3:30 p.m. | 23.30 | |
| 3:49 p.m. | 23.25 | |
| 4:01 p.m. | 23.22 | |
| 4:18 p.m. | 23.19 | |
| 4:34 p.m. | 23.18 |
In applying the Theis formula to the data given in Table 14, the coefficient of transmissibility was found to be 1,970. The coefficient of permeability is then equal to 1,970 divided by 28 (thickness of saturated water-bearing material), or 70. It is not known whether this low value for the coefficient of permeability is truly representative of the material, or whether this value and the low specific capacity may be attributed at least in part to the inability of the well to let the water in at a higher rate.
Pumping tests at Concordia Prisoner of War Camp--Pumping tests were made on wells 253 and 254 (Prison Camp wells 1 and 2) which, were drilled by the Layne-Western Company in the SE NW sec. 22, T. 5 S., R. 3 W. Well 253 is 500 feet north and 500 feet west of the center of the section; well 254 is 500 feet north and 1,000 feet west of the center of the section or 500 feet west of well 253. Both wells are finished with 18-inch concrete screens and are gravel packed. Well 253 is 95 feet deep and well 254 is 93 feet deep. During the tests the wells were equipped with turbine pumps driven by gasoline engines. They were to be equipped later with electric motors.
Well 253 was pumped on March 20 and 21, 1943, at a rate increasing from 200 gallons a minute at the beginning of the test to 560 gallons a minute at the end of the pumping period. The average pumping rate was about 400 gallons a minute. At the end of the pumping period the drawdown was 3.18 feet, and the specific capacity was 176 gallons a minute per foot of drawdown. The water-level measurements made during and following the pumping period are given in Table 15.
In applying the Theis formula to the data given in Table 15, the coefficient of transmissibility was found to be 158,000. The coefficient of permeability is then equal to 158,000 divided by 60 (thickness of saturated water-bearing material), or 2,600.
Well 254 was pumped on March 5 and 6, 1943, at a rate increasing from 156 gallons a minute at the beginning of the test to 548 gallons a minute at the end of the pumping period. The average pumping rate was about 350 gallons a minute. At the end of the pumping period the drawdown was 3.95 feet, and the specific capacity was 137 gallons a minute per foot of drawdown. The water-level measurements made during and following the pumping period are given in Table 16.
Table 15--Water-level measurements in well 253 at Concordia Prisoner of War Camp during the pumping test on March 20 and 21, 1943
| Date, 1943 |
Time | Discharge, gallons per minute |
Water level, feet above sea level |
Drawdown, feet† |
Remarks |
|---|---|---|---|---|---|
| March 20 | 9:30 a. m. | 200 | 1337.49 | 0.00 | Pumping started |
| 10:30 a.m. | 200 | 1336.57 | 0.92 | ||
| 11:30 a.m. | 200 | 1336.57 | 0.92 | ||
| 12:30 p.m. | 250 | 1336.05 | 1.44 | ||
| 1:45 p.m. | 250 | 1336.05 | 1.44 | ||
| 2:45 p.m. | 400 | 1335.40 | 2.09 | ||
| 3:30 p.m. | 400 | 1335.33 | 2.16 | ||
| 4:40 p.m. | 402 | 1335.32 | 2.17 | ||
| 5:45 p.m. | 402 | 1335.32 | 2.17 | ||
| 6:40 p.m. | 412 | 1335.29 | 2.20 | ||
| 7:30 p.m. | 412 | 1335.29 | 2.20 | ||
| 8:30 p.m. | 412 | 1335.29 | 2.20 | ||
| 9:30 p.m. | 412 | 1335.25 | 2.24 | ||
| 10:30 p.m. | 412 | 1335.25 | 2.24 | ||
| 11:45 p.m. | 412 | 1335.23 | 2.26 | ||
| March 21 | 12:45 a.m. | 480 | 1334.90 | 2.59 | |
| 1:45 a.m. | 480 | 1334.88 | 2.61 | ||
| 2:30 a.m. | 477 | 1334.88 | 2.61 | ||
| 3:30 a.m. | 477 | 1334.86 | 2.63 | ||
| 4:30 a.m. | 480 | 1334.83 | 2.66 | ||
| 5:30 a.m. | 480 | 1334.83 | 2.66 | ||
| 6:30 a.m. | 560 | 1334.39 | 3.10 | ||
| 7:25 a.m. | 563 | 1334.31 | 3.18 | ||
| 8:40 a.m. | 560 | 1334.31 | 3:18 | ||
| 9:30 a.m. | 560 | 1334.31 | 3.18 | Pumping stopped | |
| 9:30 a.m. | 1334.31 | 3.18 | |||
| 9:40 a.m. | 1336.82 | .67 | |||
| 9:50 a.m. | 1336.90 | .59 | |||
| 10:00 a.m. | 1336.98 | .51 | |||
| 10:10 a.m. | 1337.06 | .43 | |||
| 10:20 a.m. | 1337.10 | .39 | |||
| 10:30 a.m. | 1337.15 | .34 | |||
| 11:35 a.m. | 1337.25 | .24 | |||
| 1:50 p.m. | 1337.35 | .14 | |||
| 6:00 p.m. | 1337.45 | .04 | |||
| † No drawdown was apparent in Well 2 during this test. | |||||
Table 16--Water-level measurements in well 254 at Concordia Prisoner of War Camp during the pumping test on March 5 and 6, 1943
| Date, 1943 |
Time | Discharge, gallons per minute |
Water level, feet above sea level |
Drawdown, feet† |
Remarks |
|---|---|---|---|---|---|
| March 5 | 1:30 p.m. | 156 | 1337.45 | Pumping started | |
| 2:30 p.m. | 156 | 1336.53 | 0.92 | ||
| 3:30 p.m. | 156 | 1336.60 | 0.85 | ||
| 4:30 p.m. | 210 | 1336.20 | 1.25 | ||
| 5:30 p.m. | 227 | 1336.00 | 1.45 | ||
| 6:30 p.m. | 235 | 1336.00 | 1.45 | ||
| 7:30 p.m. | 277 | 1335.7 | 1.75 | ||
| 8:40 p.m. | 277 | 1335.7 | 1.75 | ||
| 9:45 p.m. | 275 | 1335.6 | 1.85 | ||
| 10:35 p.m. | 276 | 1335.6 | 1.85 | ||
| 11:30 p.m. | 238 | 1335.8 | 1.65 | ||
| March 6 | 12:40 a.m. | 305 | 1335.6 | 1.75 | |
| 1:35 a.m. | 350 | 1335.3 | 2.15 | ||
| 2:30 a.m. | 339 | 1335.2 | 2.25 | ||
| 3:40 a.m. | 293 | 1335.5 | 1.95 | ||
| 4:30 a.m. | 412 | 1334.7 | 2.75 | ||
| 5:30 a.m. | 448 | 1334.4 | 3.05 | ||
| 6:30 a.m. | 433 | 1334.4 | 3:05 | ||
| 7:30 a.m. | 448 | 1334.5 | 2.95 | ||
| 8:40 a.m. | 448 | 1334.2 | 3.25 | ||
| 9:45 a.m. | 536 | 1333.7 | 3.75 | ||
| 10:45 a.m. | 536 | 1333.6 | 3.85 | ||
| 11:40 a.m. | 548 | 1333.5 | 3.95 | ||
| 12:35 p.m. | 548 | 1333.5 | 3.95 | ||
| 2:00 p.m. | 548 | 1333.5 | 3.95 | Pumping stopped | |
| 2:00 p.m. | 1333.5 | 3.95 | |||
| 2:10 p.m. | 1336.76 | 0.69 | |||
| 2:20 p.m. | 1336.79 | 0.66 | |||
| 2:30 p.m. | 1336.88 | 0.57 | |||
| 2:40 p.m. | 1336.94 | 0.51 | |||
| 2:50 p.m. | 1336.95 | 0.50 | |||
| 3:00 p.m. | 1337.01 | 0.44 | |||
| 4:00 p.m. | 1337.08 | 0.37 | |||
| 5:00 p.m. | 1337.16 | 0.29 | |||
| 9:10 p.m. | 1337.30 | 0.15 | |||
| March 7 | 11:10 a.m. | 1337.40 | 0.05 |
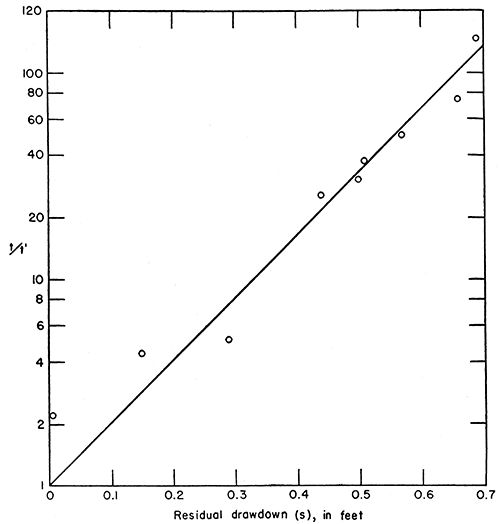
The ratio t/t' (time since pumping started, in minutes, divided by the time since pumping stopped, in minutes) is plotted against the drawdown in Figure 6. In applying the Theis formula to the data shown in Figure 6 it is found that when t/t' = 10, s = 0.33, and q = 350.
T = (264 X 350 X 1) / .33 = 280,000
The coefficient of permeability is then equal to 280,000 divided by 60 (thickness of saturated water-bearing material), or 4,600.
Figure 6--Pumping test on well 254 at the Concordia Prisoner of War Camp obtained by plotting s against t/t'.
Summary--The coefficients of permeability obtained by the four pumping tests are: Wright well, 9,500; Ward well, 70; Concordia Prisoner of War Camp, well 253, 2,600; Concordia Prisoner of War Camp, well 254, 4,600.
The average coefficient of permeability obtained in the four tests is 4,190. The average. coefficient of permeability obtained by omitting the Ward. well is 5,560. These values compare favorably with the coefficient of permeability (4,900) obtained by averaging the values from laboratory tests on drill cuttings. In submitting the results of the above permeability tests it is not intended to infer that the results are exact but pending additional permeability tests they do show that the water-bearing material in the Republican River Valley near Norway and Concordia is very permeable.
The laboratory tests were made on samples of sand and gravel collected from test holes put down by a hydraulic-rotary drill and hence cannot be expected to give exact results. The Ward pumping test was made on a well that was poorly constructed, was situated at the edge of the alluvium, and was outside the most permeable material. The pumping tests of the wells at the Concordia Prisoner of War Camp were not made by the Geological Survey and do not follow the standard procedure of the Geological Survey for making a pumping test in that the wells were pumped at a variable rate and hence the data thus obtained do not conform to the requirements of the Theis formula. The Theis formula was applied to the data from these wells, however, as it is believed that although the coefficients of permeability thus obtained are not exact they are probably .of the right order of magnitude and give additional evidence concerning the permeability of the water-bearing materials.
Yield of wells--Records of 143 wells in the Republican River Valley are given in Table 22 and the locations of the wells are. shown on Plate 1. Records of most of the wells were obtained for the preparation of the water-table contour map (Plate 8), and. generally do not indicate the quantity of water available. However, some of the wells are or have been irrigation or municipal wells that are equipped with large pumps and hence give a better idea of the potential yield of the alluvium. The yield of two wells (245 and 260) was measured in August 1942. The municipal well at Scandia (173) was tested by the Layne-Western Company in February 1932. The municipal well at Republic (40) is equipped with a pump having a capacity of 120 gallons a minute. The drawdown in well 40 was measured by Jacob King, water superintendent. The reported yields of six other irrigation wells were also obtained. Wells 253, 254, 255, and 256 at the Concordia Prisoner of War Camp were tested by the Layne-Western Company according to specifications outlined by the engineering firm of Howard, Tammen, Needles, and Bergendorf. The yields of the 14 wells are given in Table 17.
Table 17--Yield, drawdown, and specific capacity of wells in the Republican River Valley in Cloud and Republic counties, Kansas
| No. of well on Plate 1 |
Yield, gallons per minute |
Drawdown, feet |
Specific capacity1 |
Remarks | |
|---|---|---|---|---|---|
| Reported | Measured | ||||
| 40 | 120 | 3.0 | 40 | Municipal well | |
| 50 | 200 | Unused irrigation well | |||
| 52 | 150 | Irrigation well | |||
| 64 | 200 | Irrigation well | |||
| 67 | 100 | Unused irrigation well | |||
| 173 | 220 | 7.3 | 30 | Municipal well | |
| 230 | 1,200 | Unused irrigation well | |||
| 245 | 730 | 12.4 | 59 | Irrigation well | |
| 253 | 560 | 3.2 | 176 | Prisoner of War Camp well | |
| 2532 | 500 | 2.6 | 192 | Prisoner of War Camp well | |
| 254 | 548 | 4.9 | 137 | Prisoner of War Camp well | |
| 255 | 350 | 2.5 | 140 | Prisoner of War Camp well | |
| 256 | 350 | 2.0 | 175 | Prisoner of War Camp well | |
| .260 | 47 | 24.3 | 1.9 | Irrigation well | |
| 276 | 500 | Irrigation well | |||
| 1. The specific capacity of a well is the discharge in gallons a minute per foot of drawdown. 2. Test made after the lower 17 feet of the well was plugged with concrete in an attempt to eliminate salty water. |
|||||
Two tests were made on well 253 at the Concordia Prisoner of War Camp. One test was made on March 20 and 21, 1943, when the well was first completed at which time the well had a specific capacity of 176 gallons per minute per foot. The water was found to be too salty for use and the lower 17 feet of the well was plugged with concrete in an attempt to eliminate the salty water near the bottom of the alluvium. It was then tested on May 14, 1943, when the specific capacity was 192 gallons per minute per foot. The increase in specific capacity may have been caused by an increase in the yield of the well resulting from better development of the well by pumping or it may represent the limit of accuracy of the discharge measurements.
The information on the irrigation and municipal wells and the logs of the test holes indicate that, in general, wells located between the Nebraska State line and Scandia are likely to yield 200 gallons or less per minute. The alluvium in this area is not sufficiently thick or permeable to furnish adequate supplies of water for satisfactory irrigation wells. The one exception is this area is the municipal well at the City of Republic which yields 120 gallons a minute with a drawdown of only 3 feet.
Between Scandia and Concordia the records of wells and test holes indicate that yields of more than 1,000 gallons per minute might be expected from wells tapping the deeper parts of the old channel. Wells 254 and 262 are situated at the edge of the alluvium where the water-bearing materials are not sufficiently permeable and thick to supply large quantities of water to irrigation wells.
Underflow--The rate at which ground water is moving down the Republican River Valley, in gallons per day, can be computed by Darcy's law: Q = PIA, in which P is the coefficient of permeability in gallons per day per square foot, I is the hydraulic gradient in feet per mile, and A is the cross-sectional area of the valley below the water table, expressed as the product of the width in miles and the thickness in feet. The effective downstream component of the hydraulic gradient as determined from the water-table contour map is about 5 feet per mile. The cross-sectional area of the valley can be determined from the cross sections given in Plate 5. The coefficient of permeability is the most uncertain factor in computing underflow and is the most difficult to determine. The average coefficients of permeability as determined in the laboratory for the cross sections at Scandia (J-J') and Norway (K-K') have been used in computing the underflow at those points. A coefficient of permeability of 4,500 gallons per day per square foot has been used to compute the underflow at the Concordia cross section (L-L'). It is the approximate average of the average coefficient obtained by the four pumping tests (4,190) and the average coefficient as determined in the laboratory (4,900). The underflow of the Republican River Valley near Scandia, Norway, and Concordia is given in Table 18.
Table 18--Computation of underflow in the Republican River Valley near Scandia, Norway, and Concordia
| Cross section, Plate 5 |
Width, miles |
Average thickness of saturated material, feet |
Hydraulic gradient, feet per mile |
Assumed coefficient of permeability, gallons per day per sq. ft. |
Underflow, gallons per day |
|---|---|---|---|---|---|
| Scandia (J-J') | 1.4 | 28 | 5 | 1,100 | 210,000 |
| Norway (K-K') | 3.1 | 42 | 5 | 1,400 | 900,000 |
| Concordia (L-L') | 3.6 | 57 | 5 | 4,500 | 4,600,000 |
Salinity--Data collected on the domestic, municipal, and irrigation wells that receive their water supply from the alluvium in the Republican River Valley in Cloud and Republic counties indicate that the chloride content of the water is very low. The chloride content of samples of water from 8 wells ranged from 18 parts to 118 parts per million. Information obtained during the spring of 1943, however, showed that for certain areas in the Republican River Valley the ground water was too salty for most purposes. Two wells which were constructed near the Cen. sec. 22, T. 5 S., R. 3 W. by the Layne-Western Company for the Prisoner of War Camp near Concordia yielded water having a chloride content of 6,835 parts per million. Subsequent test drilling by the Layne-Western Company for the prison camp and by the Geological Survey showed that there is quite an extensive area where the water in the alluvium is contaminated by salt water.
In the outcrop area of the Dakota formation in northern Cloud County and southeastern Republic County the water is fresh. However, to the northwest in Republic and Jewell Counties, where the Dakota formation is overlain by several hundred feet of other Cretaceous rocks, the water in the Dakota formation is too salty for domestic use. The alluvium in the valley near Concordia has a known maximum thickness of about 120 feet, and the deepest part of the channel seemingly has been cut into a salty lens of the Dakota formation and as the water in the Dakota is under a greater head than the water in the overlying alluvium the salty water is moving upward into the alluvium. At the same time the alluvium is also receiving fresh water along its edges from shallower beds of the Dakota formation and from rainfall infiltration. The resultant salinity of the water varies with depth and its position in the alluvium. It depends on the presence and extent of clay lenses in the alluvium and on the relative amounts of water derived from the various sources.
Thirteen test holes were drilled by the Layne-Western Company and 20 by the Geological Survey in the vicinity of Concordia to determine the character of the alluvium, the salinity of the water, and the areal extent of the salty water. The locations of the test holes and the salinity of the samples of water that were collected are given in Table 19 and are shown on Plate 12. Test holes 1A to 13A were drilled by the Layne-Western Company, and 85 to 112 were drilled by the Geological Survey.
Table 19--Locations of test holes in the Republican River Valley in Cloud County, Kansas, and the chloride content of the water in parts per million. (Test holes 1A to 18A were drilled by the Layne-Western Company for the Prisoner of War Camp. Test holes 85 to 112 were drilled by the State and Federal Geological Surveys).
| Test hole no. |
Location | Depth, feet |
Chloride content, p.p.m. |
|---|---|---|---|
| 1A | SW cor. NW sec. 22, T. 5 S., R. 3 W. | 35-45 | 167 |
| 40-50 | 388 | ||
| 50-60 | 1,160 | ||
| 77-87 | 13,750 | ||
| 2A | Near cen. SE sec. 21, T. 5 S., R. 3 W. | 37-47 | 48 |
| 53-63 | 89 | ||
| 74-84 | 2,880 | ||
| 3A | SE NE NW sec. 28, T. 5 S., R. 3 W. | 35-45 | 26 |
| 56-66 | 74 | ||
| 76-86 | 630 | ||
| 4A | SW NW NW sec. 28, T. 5 S., R. 3 W. | 40-50 | 27 |
| 5A | SE NW NW sec. 28, T. 5 S., R. 3 W. | 63-73 | 79 |
| 6A | NE SE NW sec. 22, T. 5 S., R. 3 W. | 25-35 | 230 |
| 61-71 | 2,335 | ||
| 7A | SW NW SW sec. 21, T. 5 S., R. 3 W. | 40-50 | 59 |
| 61-71 | 880 | ||
| 8A | NW SW SE sec. 22, T. 5 S., R. 3 W. | 25-35 | 331 |
| 55-65 | 6,350 | ||
| 9A | SW cor. NW NW sec. 29, T. 5 S., R. 3 W. | 51-61 | 45 |
| 10A | SE NW NW sec. 28, T. 5 S., R. 3 W. | 41-51 | 33 |
| 11A | SW cor. sec. 21, T. 5 S., R. 3 W. | 50-60 | 34 |
| 12A | NW cor. SW sec. 21, T. 5 S., R. 3 W. | 35-45 | 25 |
| 68-78 | 168 | ||
| 13A | SE SW SW sec. 15, T. 5 S., R. 3 W. | 57-67 | 55 |
| 85 | NE cor. sec. 34, T. 5 S., R. 1 W. | 55-60 | 212 |
| 95-100 | 450 | ||
| 86 | SE SE NE sec. 34,. T. 5 S., R. 1 W. | 78-80.5 | (a) |
| 87 | NW cor. SE sec. 19, T. 5 S., R. 2 W. | 66-71 | 2,450 |
| 88 | SE cor. NE sec. 26, T. 5 S., R. 2 W. | 75-80 | 210 |
| 94-99 | 3,450 | ||
| 89 | NE cor. SE sec. 29, T. 5 S., R. 2 W. | 37-42 | 23 |
| 60-65 | 1,300 | ||
| 67-72 | 1,340 | ||
| 75-80 | 2,650 | ||
| 93 | NW cor. sec. 19, T. 5 S., R. 3 W. | 85-90 | 19 |
| 116-121 | 850 | ||
| 122-127 | 1,900 | ||
| 94 | SW cor. NW NW sec. 20, T. 5 S., R. 3 W. | 65-70 | 58 |
| 75-80 | 413 | ||
| 102-107 | 3,760 | ||
| 95 | SE cor. sec. 19, T. 5 S., R. 3 W. | 47-52 | 21 |
| 62-67 | 26 | ||
| 97 | NW cor. NW sec. 21, T. 5 S., R. 3 W. | 45-50 | 35 |
| 75-80 | 380 | ||
| 110-115 | 10,680 | ||
| 100 | SW NE NW sec. 28, T. 5 S., R. 3 W. (680 feet east of Concordia Prison Camp well 3) |
31-36 | 21 |
| 65-70 | 86 | ||
| 98-103 | 4,360 | ||
| 101 | SE NW NW sec. 28, T. 5 S., R. 3 W. (380 feet east of Concordia Prison Camp well 3) |
35-42 | 20 |
| 47-52 | 30 | ||
| 69-74 | 228 | ||
| 102-107 | 5,040 | ||
| 102 | SE NW NW sec. 28, T. 5 S., R. 3 W. (100 feet south of Concordia Prison Camp well 3) |
15-20 | 14 |
| 35-40 | 22 | ||
| 46-51 | 27 | ||
| 74-76 | 1,400 | ||
| 103 | NW NW NW sec. 28, T. 5 S., R. 3 W. | 45-50 | 22 |
| 108 | SW NE NE sec. 29, T. 5 S., R. 3 W. | 89-94 | 3,500 |
| 109 | SW SE sec. 33, T. 4 S., R. 4 W. | 119-124 | (a) |
| 110 | NW cor. NE sec. 14, T. 5 S., R. 4 W. | 51-56 | 47 |
| 111 | NW cor. sec. 13, T. 5 S., R. 4 W. | 34-39 | 25 |
| 39-44 | 43 | ||
| 112 | SE cor. sec. 15, T. 5 S., R. 4 W. | 60-65 | 450 |
| 112-117 | 1,240 | ||
| a. Water not salty to taste. | |||
The area of the greatest contamination as determined by the test holes is in sees, 21 and 22, T. 5 S., R. 3 W. A sample of water from depths of 77 to 87 feet in test hole 1A near the center of the west boundary of sec. 22 had 13,750 parts per million of chloride. The chloride content of the water from 35 to 45 feet was 167 parts per million. The highest chloride concentration occurs at the base of the alluvium and in the deepest part of the bedrock channel and it decreases with height above the base of the alluvium unless altered by impervious clay lenses.
The chloride concentration of the water in the alluvium decreases both upstream and downstream from secs. 21 and 22. The upstream boundary of the unpotable water is about at the Cloud-Republic county line. The chloride content of the water decreases from 3,760 parts per million in test hole 94 to 1,900 in test hole 93 and 1,240 in test hole 112. The Dakota formation dips below the impervious Graneros shat'e near the county line and from there to the Nebraska line there have been no reports of salty well water from the alluvium.
The logs of the wells and test holes in sec. 22, T. 5 S., R. 3 W. indicate no impervious clay lenses between the water table and the top of the Dakota formation. All other test holes penetrated at least one clay lens and it was below the bottom clay lens that the waters of the greatest salinity occurred. Well 255 at the Prisoner of War Camp was located at the site of test hole lOA. It was drilled down to a clay lens which apparently extends over a large area. The well yields water having a chloride content of less than 100 parts per million. Test hole 102, which is 100 feet south of this well, yielded water from above the clay lens that contained only 27 parts per million of chloride, but the water below the clay lens contained 1,400 parts. Test hole 101, which is about 400 feet from well 3, yielded water from below the clay lens that contained 5,040 parts per million of chloride. If the clay lens overlying the salty water in the vicinity of wells 3 and 4 is fairly continuous the water from these wells may remain fresh. Lenses of clay in alluvium are not generally continuous over a large area. If the latter conditions prevail near the wells it is likely that continuous pumping will result in the wells becoming contaminated.
Test hole 88 is less than one-quarter mile from a well that is used for irrigation. The water at the bottom of test hole 88 contains 3,450 parts per million of chloride. The chloride content was only 210 parts per million at depths of 75 to 80 feet. The water in the irrigation well is fresh and for intermittent pumping for irrigation it will probably remain fresh.
Well 253 at the Prisoner of War Camp was drilled by the LayneWestern Company in the SE NW sec. 22, T. 5 S., R. 3 W. It has the same location as test hole 4B whose log is given in the back of this report. The salinity of the water in this well is given in Table 20.
Table 20--Relation of the salinity of the water to depth in well 253 at the Prisoner of War Camp
| Depth, feet |
Chloride content, parts per million |
|---|---|
| 19-29 | 128 |
| 35-45 | 370 |
| 45-55 | 470 |
| 55-65 | 1,525 |
| 65-75 | 4,970 |
| 68-78 | 6,835 |
As shown in Table 20 the water at the bottom of the hole (78 feet) had a chloride content of 6,835 parts per million. The mixture of waters pumped from the well had a chloride content of 4,300 parts per million which was too high for any ordinary use. At a depth of 60 feet the chloride content was about 1,500 parts per million and a mixture of the waters above this depth probably would contain about 600 parts per million of chloride which would be about on the borderline as a satisfactory water supply. Upon the recommendation of the architect-engineer, the lower 17 feet of the well was plugged with concrete. A pumping test was then made on May 14, 1943, to determine the effect of the concrete plug on the salinity of the water. The test was started at 7: 15 a.m. and terminated at 5: 10 p.m. The rate of pumping, drawdown, and the chloride content of the water are given in Table 21.
The pumping test was made at a variable pumping rate to determine it there were a relation between the rate of pumping and the salinity of the water. The pumping rate was only 114 gallons a minute at the beginning and was gradually increased in about 7 hours to 500 gallons a minute. The chloride content of the water increased from 1,100 to 1,320 parts per million. The pumping rate was then reduced to 88 gallons a minute to see whether the chloride content of the water would also lower. The chloride content of the water rose 100 parts per million from 2:30 p.m. to 5:10 p.m. Under conditions of continuous heavy pumping the salinity of the water probably would continue to rise until it approached the salinity of the water obtained before the well was plugged. The opinion is based on the assumption that all water within the cone of depression is moving toward the well and must escape through the well. For a very small drawdown, however, the energy expended by pumping would not be sufficient to raise the denser water at the bottom of the formation to the top of the concrete plug.
Table 21--Discharge, drawdown, and chloride content of the water during pumping test on well 253 on May 14, 1943
| Time | Discharge, gallons per minute |
Drawdown, feet |
Chloride content, parts per million |
|---|---|---|---|
| 7:15 a.m. | 114 | 0.5 | 1,100 |
| 8:15 | 148 | .5 | 1,120 |
| 9:30 | 200 | .5 | 1,180 |
| 11:00 | 250 | 1.0 | 1,220 |
| 12:00 noon | 400 | 1.5 | 1,300 |
| 1:20 p.m. | 400 | 2.0 | |
| 2:30 | 500 | 2.6 | 1,320 |
| 3:30 | 88 | .5 | |
| 4:05 | 88 | .5 | |
| 5:10 | 88 | .4 | 1,420 |
Conclusions--Records of the wells and test drilling indicate that the saturated alluvium in the Republican Valley between the Nebraska State line and Scandia, Kansas, is too thin for the development of large quantities of ground water. Between Scandia and Concordia the alluvium is as much as 100 feet thick and contains thick saturated beds of coarse gravel and sand that are very permeable. The water table is generally within 20 feet of the surface. Properly constructed wells in favorable areas in this part of the valley should yield 1,000 gallons a minute or more with nominal drawdown.
It has been estimated that the amount of recharge from local precipitation is appreciable, and is believed to be the principal source of water that supplies existing wells in the valley. The amount of underflow has been estimated to be about 210,000 gallons per day at Scandia, about 900,000 at Norway, and about 4,600,000 gallons at Concordia. The amount of water derived as underflow thus may be regarded as negligible compared to that which is available from other sources. Much of the water computed as underflow at Concordia comes in from the sides of the valley rather than water moving down the river valley on a subterranean stream from points above.
Under existing conditions the aggregate amount of recharge from the several sources is approximately balanced by the total groundwater discharge, which takes place by evaporation and transpiration, effluent seepage into the river, underflow from the area, and by pumping from the existing wells. Because ground-water recharge and discharge are now approximately equal, it follows that any additional large quantity of water that might be pumped from wells for irrigation would tend to upset this balance and would have to be offset in like amount by (1) reduction in the amount of existing natural ground-water discharge, (2) increase in the present rate of recharge from local precipitation or underflow, (3) establishment of conditions favorable to more ground-water recharge from the river, or (4) a combination of part or all of these factors. The first three factors named will be taken up in the order named.
It has been estimated that ground-water discharge in the valley occurs largely through transpiration and evaporation. The water is transpired by trees that line the river and occupy smaller areas in the valley and by crops raised by "dry farming." As the greater part of the valley is being cultivated, the addition of new irrigation wells to the valley will not decrease total evaporation and transpiration; on the contrary, the total evaporation and transpiration will be increased, for the primary purpose of irrigation is to make available more water for crops.
Lowering of the water table by additional pumping from wells in swampy areas where the water table now stands close to the surface might increase somewhat the recharge from precipitation, for in such areas some recharge now is rejected because of a full ground-water reservoir. Such additional recharge would be small, however, because such areas represent only a small part of the entire valley.
At present the increment of ground water into the area from. underflow and by recharge from precipitation seems to be nearly all discharged by evaporation and transpiration, effluent seepage, and by pumping of existing wells. The present rate of pumpage will not be decreased. If it is increased the consumption of ground water by evaporation and transpiration may be reduced materially, but the reduction in the amount of transpiration by crops from the zone of saturation must be more than offset by the amount of pumping if irrigation is to be beneficial. It seems, therefore, that large groundwater supplies for irrigation must be derived largely by recharge from the river. Conditions seem to be favorable for influent seepage, and the amount of influent seepage that might be made available seems to depend more on the amount of stream flow available at times than on the infiltration capacity of the river bed. In considering the entire valley the" amount of induced influent seepage could not exceed in amount the average stream flow, a fact that must be recognized in the 'ultimate irrigation development of the valley. In any given area of the valley to be developed, advantage can be taken of stream flow that enters from upstream areas. Any large ground-water developments in Nebraska, however, will affect the amount of stream flow entering Kansas and will accordingly affect the potential ground-water supply in this part of' the valley.
If, in the future, large ground-water supplies are to be developed for industrial use rather than for irrigation, the relative importance of the several sources of recharge and reclaimed discharge would differ somewhat. Reduction of ground-water' discharge through transpiration and evaporation in the vicinity of pumped wells would then be more effective; hence the proportion of the supply that would have to come from the river would be smaller. Moreover, much of the water pumped for industrial use generally is discharged again into the river, thus making the water available again as a potential source of influent seepage in downstream areas.
Additional factors would also be presented if irrigation from wells were to be supplemented by irrigation from canals conveying river water from upstream impounding and diversion works. This might reduce the amount of stream flow available as influent seepage to irrigation wells, but in turn, seepage from the canals and tracts irrigated by river water would provide additional ground water recharge.
It is conceivable that heavy pumping from wells might dry up limited stretches of the river during periods of low stream flow. The vast quantity of ground water held in storage is available during such periods of heavy pumping, however, and would be replenished periodically by recharge from precipitation and from the river during periods of normal or greater stream flow. During the non-pumping season such recharge would be especially effective in replenishing the ground-water reservoir. Assuming a specific yield of 18 percent, it is calculated that a column of alluvium 1 mile square and 1 foot thick would contain 37,100,000 gallons of free ground water in storage. Between Norway and Concordia where the thickness of the alluvium averages about 50 feet the total quantity of water in storage, if the specific yield were 18 percent, would amount to about 2,000,000,000 gallons per square mile. Obviously not all this water is recoverable by wells, but the amount that is recoverable is believed to be more than ample as a reserve supply between periods of abundant precipitation and stream flow. It is believed that withdrawals from storage would be more than offset by recharge so that the net lowering of water levels would be very slight. Thus, it appears that between Scandia and Concordia, available ground water in the Republican Valley is adequate for the development of irrigation supplies from wells.
Between Scandia and the Cloud-Republic County line the quality of the water is believed to be suitable for irrigation. In Cloud County the chloride content of some of the ground water in the Republican River Valley is too high to be used for irrigation. The water of highest salinity occurs below a clay lens, hence it may be possible to develop satisfactory irrigation wells by terminating them above the clay lens. The performance of the wells at the Concordia Prisoner of War Camp will serve as an excellent index of the possibility of developing irrigation wells in that area. In any case the construction of an irrigation well should always be preceded by one or more test wells to determine the quality of the water.
Prev Page--Paleozoic rocks, Cretaceous System || Next Page--Well Records
Kansas Geological Survey, Geohydrology
Placed on web Nov. 8, 2016; originally published May 1948.
Comments to webadmin@kgs.ku.edu
The URL for this page is http://www.kgs.ku.edu/Publications/Bulletins/73/06_form.html