![]()
Prev Page--Start of Ground Water || Next Page--Formations
Ground Water, continued
Chemical Character of Water
The general chemical character of the ground waters in Republic County and northern Cloud County is indicated by the analyses of water from 58 wells distributed as uniformly as practicable within the area and among the principal water-bearing formations (Table 6). Table 6 includes analyses of water of the 8 public water supplies. The samples of water were analyzed by Howard A. Stoltenberg, Chemist, in the Water and Sewage Laboratory of the Kansas State Board of Health. The constituents given were determined by the methods used by the U. S. Geological Survey.
Table 6--Analyses of water from wells in Republic County and northern Cloud County, Kansas. Analyzed by H. A. Stoltenberg. Dissolved constituents given in parts per milliona, and (in italics) in equivalents per millionb.
| No. on Plate 1 |
Location | Depth (feet) |
Geologic subdivision |
Date of collection, 1942 |
Temp. (°F) |
Iron (Fe) |
Calcium (Ca) |
Magnesium (Mg) |
Sodium and potassium (Na+K) (c) |
Bicarbonate (HCO3) |
Sulfate (SO4) |
Chloride (Cl) |
Fluoride (F) |
Nitrate (NO3) |
Total dissolved solids |
Hardness (calculated aa CaCO3) |
||
|---|---|---|---|---|---|---|---|---|---|---|---|---|---|---|---|---|---|---|
| Total | Carbonate | Non- carbonate |
||||||||||||||||
| T. 1 S., R. 1 W. | ||||||||||||||||||
| 4 | NW NE sec. 11 | 40.5 | Carlile | Aug. 20 | 56 | 5.2 | 137 6.84 |
27 2.22 |
39 1.70 |
349 5.72 |
105 2.18 |
70 1.97 |
0.7 .04 |
53 .86 |
612 | 453 | 286 | 167 |
| 5 | SW SW sec. 16 | 253.0 | Dakota | Feb. 4 | 22 1.10 |
8 .66/ |
357 15.52 |
444 7.28 |
188 3.91 |
214 6.03 |
1.1 .06 |
0 0 |
1,031 | 88 | 88d | 0 | ||
| 8 | NW NW sec. 27 | 11.8 | Greenhorn | Aug. 20 | 60 | .96 | 482 24.05 |
48 3.94 |
195 8.49 |
473 7.76 |
1,060 22.05 |
210 5.92 |
.7 .04 |
44 .71 |
2,277 | 1,400 | 388 | 1,012 |
| 9 | NE NE sec. 28 | 244.0 | Dakota | Aug. 20 | 1.2 | 34 1.70 |
8.8 .72 |
223 9.69 |
434 7.12 |
169 3.52 |
46 1.30 |
1.1 .06 |
7.1 .11 |
707 | 121 | 121e | 0 | |
| 10 | SE SW sec. 33 | 39.1 | Greenhorn | Aug. 20 | .12 | 110 5.49 |
11 .90 |
50 2.18 |
345 5.66 |
53 1.10 |
47 1.32 |
.3 .02 |
29 .47 |
473 | 320 | 283 | 37 | |
| T. 1 S., R. 2 W. | ||||||||||||||||||
| 12 | SE NE sec. 5 | 78 | Belleville | Aug. 20 | 57 | .28 | 60 2.99 |
12 .99 |
30 1.30 |
144 2.36 |
16 .33 |
26 .73 |
.2 .01 |
115 1.85 |
332 | 199 | 118 | 81 |
| 19 | SW SE sec. 33 | 62 | Belleville | May 8 | 135 6.74 |
17 1.40 |
48 2.10 |
354 5.81 |
132 2.75 |
44 1.24 |
.2 .01 |
27 .43 |
636 | 407 | 290 | 117 | ||
| 21 | NW SW sec. 2 | 215 | Belleville | Feb. 17 | 83 4.14 |
9.0 .74 |
17 .73 |
290 4.76 |
13 .27 |
18 .51 |
.1 .01 |
3.8 .06 |
353 | 244 | 238 | 6 | ||
| T. 1 S., R. 3 W. | ||||||||||||||||||
| SE SE sec. 4 | 111.3 | Belleville | July 30 | 57 | 1.0 | 94 4.69 |
12 .99 |
12 .50 |
310 5.08 |
12 .25 |
26 .73 |
.1 .01 |
7.1 .11 |
319 | 284 | 254 | 30 | |
| 26 | SE SE sec.l0 | 80.5 | Belleville | July 30 | 57 | 12 | 95 4.74 |
14 1.15 |
7.8 .34 |
324 5.31 |
10 .21 |
18 .51 |
.1 .01 |
12 .19 |
331 | 294 | 266 | 28 |
| 27 | SW SW sec. 18 | 171.0 | Belleville | July 30 | 57 | 14 | 88 4.39 |
12 .99 |
6.9 .30 |
293 4.80 |
5.3 .11 |
14 .39 |
.2 .01 |
23 .37 |
310 | 269 | 240 | 29 |
| T. 1 S., R. 4 W. | ||||||||||||||||||
| 30 | NE NW sec. 4 | 160.2 | Belleville | July 31 | 56 | 1.2 | 85 4.24 |
13 1.07 |
21 .91 |
268 4.39 |
28 .58 |
34 .96 |
.2 .01 |
18 .29 |
334 | 266 | 220 | .46 |
| 33 | SW SE sec. 17 | 54.7 | Belleville | July 30 | 57 | 8.7 | 13 .65 |
5.4 .44 |
.69 .03 |
27 .44 |
8.0 .17 |
3 .08 |
.1 .01 |
26 .42 |
92 | 24 | 22 | 32 |
| 40 | SW NW sec. 31. | 63 | Belleville | Mar. 10 | 17 | 52 2.59 |
7.6 .62 |
165 2.71 |
19 .40 |
24 .68 |
.1 .01 |
8 .13 |
240 | 160 | 135 | 26 | ||
| 45 | SE NE sec. 34 | 115.2 | Belleville | July 30 | 57 | 40 | 89 4.44 |
9.8 .80 |
26 1.13 |
307 5.08 |
11 .23 |
23 .65 |
.1 .01 |
28 .45 |
380 | 262 | 252 | 10 |
| T. 1 S., R. 5 W. | ||||||||||||||||||
| 53 | NW NW sec. 6 | Alluvium | July 30 | 58 | 21 | 78 3.89 |
16 1.32 |
54 2.36 |
346 5.67 |
40 .83 |
18 .51 |
.5 .03 |
33 .53 |
434 | 260 | 260f | 0 | |
| 58 | SW SE sec. 14 | 60.7 | Alluvium | July 30 | 56 | 1.0 | 49 2.44 |
9.7 .80 |
22 .96 |
157 2.57 |
16 .31 |
20 .56 |
.3 .01 |
19 .31 |
228 | 162 | 150 | 12 |
| 63 | NW NW sec. 18 | 74.7 | Belleville | July 30 | 56 | 6.1 | 73 3.64 |
12 .99 |
16 .70 |
264 4.33 |
9.7 .20 |
25 .70 |
.2 .01 |
5.8 .09 |
280 | 232 | 216 | 16 |
| T. 2 S., R. 1 W. | ||||||||||||||||||
| 82 | NW NW sec. 10 | 7.4 | Greenhorn | Aug. 20 | 59 | .26 | 120 5.99 |
12 .99 |
34 1.47 |
369 5.89 |
56 1.16 |
25 .70 |
.4 .02 |
42 .68 |
469 | 349 | 294 | 55 |
| 86 | SW SW sec. 36 | 27.9 | Alluvium | Aug. 21 | 55 | 1.4 | 162 8.08 |
16 1.32 |
22 .97 |
422 6.92 |
114 2.37 |
9.5 .27 |
.3 .02 |
49 .79 |
585 | 470 | 346 | 124 |
| T. 2 S., R. 2 W. | ||||||||||||||||||
| 88 | NE NW sec. 16 | 21.6 | Belleville | Aug. 21 | 57 | .10 | 110 5.49 |
15 1.23 |
49 2.15 |
333 5.46 |
41 .85 |
40 1.13 |
.2 .01 |
88 1.42 |
510 | 336 | 273 | 63 |
| 90 | NE NE sec. 26 | 28.2 | Belleville | Aug. 21 | 57 | .52 | 115 5.74 |
11 .90 |
51 2.21 |
354 5.80 |
60 1.25 |
53 1.49 |
.3 .02 |
18 .29 |
486 | 332 | 290 | 42 |
| T. 2 S., R. 3 W. | ||||||||||||||||||
| 96 | NW NW sec. 19 | 33.4 | Belleville | July 30 | 59 | 12 | 98 4.89 |
13 1.07 |
49 2.13 |
249 4.08 |
46 .96 |
89 2.51 |
.3 .02 |
32 .51 |
464 | 298 | 204 | 94 |
| 97 | SW NW sec. 23 | 22.3 | Belleville | July 30 | 55 | 1.1 | 200 9.98 |
27 2.22 |
140 6.10 |
248 4.07 |
173 3.60 |
192 5.41 |
.4 .02 |
323 5.20 |
1,180 | 610 | 204 | 406 |
| 99 | SW SW sec. 27 | 157.5 | Dakota | July 30 | 3.1 | 52 2.59 |
47 3.86 |
2,927 127.34 |
527 8.64 |
543 11.29 |
4,020 113.36 |
2.8 .15 |
22 .35 |
7,880 | 322 | 322g | 0 | |
| T. 2 S., R. 4 W. | ||||||||||||||||||
| 107 | SE SE sec. 7 | 42.2 | Alluvium | July 31 | 57 | .34 | 95 4.74 |
18 1.48 |
25 1.10 |
359 5.89 |
24 .50 |
26 .73 |
.2 .01 |
12 .19 |
380 | 311 | 294 | 17 |
| T. 2 S., R. 5 W. | ||||||||||||||||||
| 118 | SE NW sec. 2 | 19.3 | Alluvium | July 30 | 56 | .16 | 363 18.11 |
71 5.84 |
66 2.88 |
559 9.17 |
792 16.47 |
39 1.10 |
.6 .03 |
4 .06 |
1,615 | 1,198 | 458 | 740 |
| T. 3 S., R. 1 W. | ||||||||||||||||||
| 138 | SW sec. 8 | 217 | Dakota | May 23 | 42 2.10 |
13 1.07 |
176 7.67 |
427 7.00 |
143 2.97 |
26 .73 |
.5 .03 |
7.1 .11 |
642 | 158 | 158h | 0 | ||
| T. 3 S., R. 2 W. | ||||||||||||||||||
| 143 | NW NE sec. 2 | 37.9 | Belleville | Aug. 21 | 56 | 6.4 | 108 5.39 |
11 .90 |
56 2.45 |
351 5.76 |
48 1.00 |
63 1.78 |
.3 .02 |
11 .18 |
479 | 314 | 288 | 26 |
| T. 3 S., R. 3 W. | ||||||||||||||||||
| 149 | SW SW sec. 7 | 25.8 | Carlile | July 31 | .14 | 632 31.55 |
46 3.78 |
50 2.17 |
339 5.56 |
1,186 24.70 |
165 4.65 |
1.0 .05 |
159 2.56 |
2,409 | 1,766 | 278 | 1,488 | |
| 151 | NE NE sec. 13 | 121.0 | Dakota | Aug. 22 | 56 | 30 | 31 1.55 |
13 1.07 |
802 34.91 |
747 12.25 |
229 4.76 |
685 19.32 |
1.4 .07 |
8.0 .13 |
2,203 | 131 | 131i | 0 |
| 155 | NE NE sec. 30 | 97.2 | Dakota | Aug. 24 | 57 | 32 | 116 5.79 |
13 1.07 |
132 5.76 |
411 6.74 |
152 3.16 |
50 1.41 |
.4 .02 |
80 1.29 |
781 | 343 | 337 | 6 |
| 157 | SE SE sec. 35 | 23.6 | Dakota | Aug. 22 | 56 | 5.3 | 139 6.94 |
11 .90 |
37 1.62 |
382 6.26 |
55 1.14 |
27 .76 |
.2 .01 |
80 1.29 |
546 | 392 | 313 | 79 |
| T. 3 S., R. 4 W. | ||||||||||||||||||
| 164 | SE SE sec. 9 | 69.2 | Greenhorn | July 31 | 57 | .26 | 116 5.79 |
15 1.23 |
65 2.84 |
371 6.08 |
99 2.06 |
54 1.52 |
.2 .01 |
12 .19 |
547 | 351 | 304 | 47 |
| 173 | NW SE sec. 17 | 43 | Alluvium | Apr. 17 | 3.6 | 106 5.29 |
13 1.07 |
46 2.01 |
299 4.90 |
102 2.12 |
46 1.30 |
.5 .03 |
1.3 .02 |
527 | 318 | 245 | 73 | |
| 176 | NE SE sec. 29 | 13.5 | Alluvium | July 31 | 1.8 | 108 5.39 |
21 1.73 |
88 3.85 |
390 6.40 |
54 1.12 |
118 3.33 |
.5 .03 |
5.8 .09 |
593 | 356 | 320 | 36 | |
| T. 3 S., R. 5 W. | ||||||||||||||||||
| 186 | SE SE sec. 13 | 56.2 | Greenhorn | July 31 | 57 | .48 | 130 6.49 |
20 1.64 |
150 6.52 |
368 6.04 |
296 6.16 |
78 2.20 |
.5 .03 |
14 .22 |
873 | 406 | 302 | 104 |
| 189 | SE SE sec. 16 | 67 | Carlile | Aug. 7, 1944 |
236 11.78 |
32 2.63 |
121 5.24 |
300 4.92 |
477 9.92 |
168 4.74 |
.7 .04 |
2.1 .03 |
1,202 | 720 | 246 | 474 | ||
| 191 | NW NW sec. 25 | 64.0 | Carlile | July 31 | 57 | 7.7 | 580 28.94 |
54 4.44 |
579 25.18 |
438 7.18 |
1,532 31.86 |
640 18.05 |
.9 .05 |
88 1.42 |
3,700 | 1,669 | 359 | 1,310 |
| 194 | NW NW sec. 32 | 116.3 | Dakota | July 31 | 56 | 32 | 775 38.87 |
98 8.06 |
532 23.13 |
223 3.66 |
1,029 21.40 |
1,320 37.22 |
.6 .03 |
469 7.55 |
4,367 | 2,336 | 183 | 2,153 |
| T. 4 S., R. 1 W. | ||||||||||||||||||
| 197 | NW NW sec. 13 | 38.0 | Dakota | Aug. 23 | 54 | 2.6 | 378 18.86 |
31 2.55 |
191 8.32 |
187 3.07 |
615 12.79 |
258 7.28 |
.7 .04 |
407 6.65 |
1,979 | 1,070 | 154 | 916 |
| 202 | SE NW sec. 36 | 38.4 | Dakota | Aug. 23 | 56 | .50 | 53 2.64 |
11 .90 |
23 1.02 |
90 1.48 |
68 1.41 |
34 .96 |
.3 .02 |
43 .69 |
278 | 177 | 74 | 103 |
| T. 4 S., R. 2 W. | ||||||||||||||||||
| 204 | SW SE sec. 9 | 52.3 | Dakota | Aug. 23 | 56 | .40 | 129 6.44 |
15 1.23 |
167 7.26 |
442 7.25 |
166 3.45 |
119 3.36 |
.4 .02 |
53 .85 |
871 | 384 | 362 | 22 |
| 207 | NW SW sec. 18 | 26.8 | Alluvium | Aug. 22 | 55 | 3.0 | 114 5.69 |
9.8 .80 |
12 .54 |
368 6.04 |
29 .60 |
9 .25 |
.2 .01 |
8 .13 |
370 | 324 | 302 | 22 |
| 208 | NW NW sec. 20 | 70 | Dakota | Aug. 22 | 59 | 1.6 | 68 3.39 |
17 1.40 |
47 2.03 |
166 2.72 |
32 .66 |
30 .85 |
.5 .03 |
159 2.56 |
438 | 240 | 136 | 104 |
| T. 4 S., R. 3 W. | ||||||||||||||||||
| 209 | SE NE sec. 1 | 42.9 | Pleistocene | Aug. 21 | 56 | .54 | 186 9.28 |
20 1.64 |
94 4.10 |
405 6.64 |
33 .69 |
134 3.78 |
0 0 |
243 3.91 |
913 | 546 | 332 | 214 |
| 215 | SE SE sec. 14 | 64.2 | Dakota | Aug. 22 | 57 | 5.0 | 129 6.44 |
21 1.73 |
166 7.21 |
249 4.08 |
206 4.28 |
233 6.57 |
.3 .02 |
27 .43 |
912 | 408 | 204 | 204 |
| 217 | SW NW sec. 15 | 25.8 | Dakota | Aug. 24 | 55 | .09 | 176 8.78 |
18 1.48 |
69 3.00 |
395 6.48 |
79 1.64 |
53 1.49 |
.1 .01 |
226 3.64 |
819 | 513 | 324 | 189 |
| T. 4 S., R. 4 W. | ||||||||||||||||||
| 227 | NW NW sec. 14 | 125.8 | Dakota | Aug. 24 | 58 | 2.6 | 39 1.95 |
17 1.40 |
1,184 51.48 |
565 9.27 |
172 3.58 |
1,440 40.61 |
3 .16 |
9.3 .15 |
3,181 | 168 | 168j | 0 |
| 237 | SW SW sec. 32 | 34.7 | Alluvium | July 31 | 56 | .46 | 97 4.84 |
13 1.07 |
35 1.52 |
371 6.08 |
33 .69 |
18 .51 |
.2 .01 |
8.4 .14 |
391 | 296 | 296k | 0 |
| 239 | NE SE sec. 36 | 74.7 | Dakota | Aug. 24 | 58 | .73 | 116 5.79 |
9.8 .80 |
34 1.47 |
404 6.62 |
51 1.06 |
10 .28 |
.4 .02 |
5.3 .08 |
429 | 330 | 330l | 0 |
| T. 4 S., R. 5 W. | ||||||||||||||||||
| 241 | NW SW sec. 7 | 41.6 | Greenhorn | July 31 | 55 | 2.0 | 208 10.38 |
16 1.32 |
79 3.45 |
399 6.54 |
228 4.74 |
96 2.71 |
.4 .02 |
71 1.14 |
900 | 585 | 327 | 258 |
| 243 | SW NW sec. 23 | 127.8 | Dakota | July 31 | 58 | 39 | 19 .95 |
15 1.23 |
1,526 66.36 |
920 15.09 |
258 5.37 |
1,655 46.67 |
5.5 .29 |
12 .19 |
4,018 | 109 | 109m | 0 |
| 244 | NW NW sec. 30 | 84.0 | Dakota | July 31 | 57 | 4.0 | 124 6.19 |
8.8 .72 |
30 1.29 |
296 4.86 |
39 .81 |
65 1.83 |
.3 .02 |
43 .69 |
462 | 346 | 242 | 104 |
| T. 5 S., R. 3 W. | ||||||||||||||||||
| 253 | SW NW sec. 22 | 78 | Alluvium | Apr. 15, 1943 |
107 5.34 |
59 4.85 |
1,646 67.26 |
415 6.81 |
468 9.73 |
2,150 60.63 |
.4 .02 |
16 .26 |
4,590 | 510 | 340 | 170 | ||
| 255 | NW NW sec. 28 | 51 | Alluvium | May 25, 1943 |
58 2.89 |
13 1.07 |
54 2.36 |
292 4.79 |
40 .83 |
23 .65 |
.5 .03 |
1.3 .02 |
383 | 198 | 198n | 0 | ||
| 262 | NE NE sec. 32 | 122 | Alluvium | Jan. 2, 1945 |
110 5.49 |
17 1.40 |
78 3.40 |
381 6.25 |
91 1.89 |
72 2.03 |
.5 .03 |
5.8 .09 |
589 | 344 | 312 | 32 | ||
| T. 6 S., R. 3 W. | ||||||||||||||||||
| 290 | SE SE sec. 6 | 305 | Dakota | Nov. 3 | 58 | 5.7 | 7.8 .39 |
2.8 .23 |
371 16.12 |
677 11.10 |
93 1.93 |
70 1.97 |
9 .47 |
4.1 .07 |
938 | 31 | 31o | 0 |
| T. 6 S., R. 4 W. | ||||||||||||||||||
| 291 | NW SW sec. 36 | 308 | Dakota | Nov. 3 | 56 | 7.6 | 7.6 .38 |
5.0 .41 |
681 29.68 |
733 12.02 |
151 3.14 |
490 13.82 |
5.5 .29 |
5.8 .09 |
1,752 | 40 | 40p | 0 |
| a. One part per million is equivalent to one pound of substance per million pounds of water or 8.33 pounds per million gallons of water. b. An equivalent per million is a unit chemical equivalent weight of solute per million unit weights of solution. Concentration in equivalents per million is calculated by dividing concentration in parts per million by the chemical combining weight of the substance or ion. c. Calculated. d. Total alkalinity, 370 parts per million; excess alkalinity, 282 parts per million. e. Total alkalinity, 356 parts per million; excess alkalinity, 235 parts per million. f. Total alkalinity, 284 parts per million; excess. alkalinity, 24 parts per million. g. Total alkalinity, 432 parts per million; excess alkalinity, 110 parts per million. h. Total alkalinity, 354 parts per million; excess alkalinity, 200 parts per million. i, Total alkalinity, 662 parts per million; excess alkalinity, 531 parts per million. j. Total alkalinity, 516 parts per million; excess alkalinity, 348 parts per million. k, Total alkalinity, 304 parts per million; excess alkalinity, 8 parts per million. j. Total alkalinity, 331 parts per million; excess alkalinity, 1 part per million. m. Total alkalinity, 801 parts per million; excess alkalinity, 692 parts per million. n. Total alkalinity, 242 parts per million; excess alkalinity, 38 parts per million. o. Total alkalinity, 613 parts per million; excess alkalinity, 584 parts per million. p. Total alkalinity, 654 parts per million; excess alkalinity, 614 parts per million. |
||||||||||||||||||
Chemical Constituents in Relation to Use
The following discussion of the chemical constituents of ground water in relation to use has been adapted from publications of the United States Geological Survey.
Dissolved Solids--When water is evaporated .the residue that is left consists mainly of the mineral constituents listed below and generally includes a small quantity of organic material and a little water of crystallization. Waters containing less than 500 parts per million of dissolved solids generally are entirely satisfactory for domestic use, except for difficulties resulting from their hardness or occasional excessive content of iron. Waters containing more than 1,000 parts per million are likely to include enough of certain constituents to produce a noticeable taste or to make the water unsuitable in some other respects.
The amount of dissolved solids in the samples of ground water collected in Republic and Cloud counties are indicated in Table 7.
Table 7--Dissolved solids in water samples from wells in Republic County and northern Cloud County
| Disolved Solids (parts per million) |
Number of samples |
|---|---|
| Less than 250 | 3 |
| 250-500 | 21 |
| 501-750 | 12 |
| 751-1,000 | 8 |
| 1,001-2,000 | 5 |
| 2,001-3,000 | 3 |
| 3,001-4,000 | 2 |
| 4,001-5,000 | 2 |
| More than 5,000 | 1 |
Hardness--The hardness of a water is commonly recognized by the increased amount of soap needed to produce a lather, and by the curdy precipitate that forms before a permanent lather is obtained. Calcium and magnesium are the constituents that cause practically all the hardness of ordinary waters and they are also the active agents in the formation of the greater part of all the scale formed in steam boilers and in other vessels in which water is heated or evaporated.
In addition to the total hardness the table of analyses shows the carbonate hardness and the noncarbonate hardness. The carbonate hardness is that caused by calcium and magnesium bicarbonates and can be almost entirely removed by boiling. In some reports this type of hardness is called temporary hardness. The noncarbonate hardness is due to calcium and magnesium sulfates or chlorides. It cannot be removed by boiling and has sometimes been called permanent hardness. With reference to use with soaps, there is no difference between the carbonate and noncarbonate hardness. In general, the noncarbonate hardness forms harder scale in steam boilers.
Water having a hardness of less than 50 parts per million is generally rated as soft, and its treatment for the removal of hardness is rarely justified. Hardness between 50 and 150 parts per million does not seriously interfere with the use of water for most purposes, but it does slightly increase the consumption of soap, and its removal by a softening process is profitable for laundries or other industries that use large quantities of soap. Treatment for the prevention of scale is necessary for the successful operation of steam boilers using water in the upper part of this range of hardness. Hardness of more than 150 parts per million can be noticed by anyone, and where the hardness is 200 or 300 parts per million it is common practice to soften water for household use or to install cisterns to collect soft-rain water. Where public supplies are softened, an attempt is generally made to reduce the hardness to 60 or 80 parts per million. The additional improvement from further softening of a whole public supply is not deemed worth the additional cost.
The hardness of the 58 samples of water that were analyzed is indicated in Table 8.
Table 8--Hardness of water samples from wells in Republic County and northern Cloud County
| Disolved Solids (parts per million) |
Number of samples |
|---|---|
| Less than 50 | 2 |
| 50-100 | 2 |
| 101-150 | 3 |
| 151-200 | 6 |
| 201-300 | 11 |
| 301-400 | 17 |
| 401-500 | 5 |
| 501-600 | 3 |
| 601-700 | 1 |
| 701-1,000 | 0 |
| 1,001-2,000 | 5 |
| More than 2,000 | 1 |
There are two processes in general use for softening water, the lime and soda process and the exchange silicate or so-called "zeolite" process. Both of these methods also effectively remove undesirable amounts of iron.
Iron--Next to hardness, iron is the constituent of natural waters that in general receives the most attention, The quantity of iron in ground waters may differ greatly from place to place, even in waters from the same formation. If a water contains much more than 0.1 part per million of iron the excess may separate out after exposure to the air and settle as a reddish sediment. Iron, which may be present in sufficient quantity to give a disagreeable taste and to stain cooking utensils, may be removed from most waters by simple aeration and filtration, but a few waters require the addition of lime or some other substance.
The iron content of the samples of ground water that were analyzed is indicated in Table 9.
Table 9--Iron content of water samples from wells in Republic County and northern Cloud County
| Iron (parts per million) |
Number of samples |
|---|---|
| Less than 0.1 | 1 |
| 0.1-0.5 | 10 |
| 0.6-1.0 | 5 |
| 1.1-2.0 | 9 |
| 2.1-5.0 | 7 |
| 51-10.0 | 9 |
| 10.1-15.0 | 4 |
| More than 15.0 | 7 |
Fluoride--Although determinable quantities of fluoride are not so common as fairly large quantities of the other constituents of natural waters, it is desirable to know the amount of fluoride present in waters that are likely to be used by children. Fluoride in water has been shown to be associated with the dental effect known as mottled enamel which may appear on the teeth of children who drink water containing appreciable fluoride during the period of formation of the permanent teeth. It has been stated that waters containing 1 part per million or more of fluoride are likely to produce mottled enamel, although the effect of 1 part per million is not usually very serious (Dean, 1936). If the water contains as much ss 4 parts per million of fluoride, 90 percent of the children exposed are likely to have mottled enamel and 35 percent or more of the cases will be classified as moderate or worse. Small quantities of fluoride, not sufficient to cause mottled enamel, are likely to be beneficial by decreasing dental caries (Dean, Arnold and Elvove, 1942).
The fluoride content of the samples of ground water that were analyzed is given in Table 10.
Table 10--Fluoride content of water samples from wells in Republic County and northern Cloud County
| Fluoride (parts per million) |
Number of samples |
|---|---|
| Less than 0.1 | 1 |
| 0.1-0.5 | 34 |
| 0.6-1.0 | 12 |
| 1.1-2.0 | 4 |
| 2.1-3.0 | 2 |
| 3.1-5.0 | 0 |
| 5.1-10.0 | 3 |
Water for Irrigation--The suitability of water for use in irrigation is commonly believed to depend mainly on the total quantity of soluble salts and on the ratio of the quantity of sodium to the total quantity of soluble salts and on the ratio of the quantity of sodium to the total quantity of sodium, calcium, and magnesium together. The quantity of chloride may be large enough to affect the use of the water and in some areas other constituents, such as boron, may be present in sufficient quantity to cause difficulty. In a discussion of the interpretation of analyses with reference to irrigation in southern California, Scofield (1933) states that if the total concentration of dissolved salts is less than 700 parts pet million there is not much probability of harmful effects in irrigation use. If it exceeds 2,100 parts per million there is a strong probability of damage to either the crops or the land or both. Water containing less than 50 percent sodium (the percentage being calculated as 100 times the ratio of the sodium to the total bases, in equivalents) is not likely to be injurious, but if it contains more than 60 percent its use is inadvisable. Similarly, a chloride content of less than 142 parts per million is not objectionable, but more than 355 parts per million is undesirable. It is recognized that the harmfulness of irrigation water is so dependent on the nature of the land, the crops, the manner of use, and the drainage that no hard and fast limits can be adopted.
All but one of the samples of water collected in the Republican River Valley in Republic County are within the limits suggested by Scofield for safe waters for use in irrigation. The sample of water from well 118 contained 1,615 parts per million of total dissolved solids, and this water may not be entirely suitable for irrigation. All the samples of water collected from the Belleville formation are well within the limits suggested by Scofield. Some of the ground water in the Republican River Valley in Cloud County contains sufficient chloride to be unsuitable for irrigation. The salinity of this water is discussed on pages 113-121.
Sanitary Considerations
The analyses of water given in Table 6 show only the amounts of dissolved mineral matter in the water and do not indicate the sanitary quality of the water.
Dug wells and springs are more likely to become contaminated than are properly constructed drilled wells, but great care should be taken to protect from pollution every well and spring used for domestic or public supply. It is important that the top of the casing be sealed in such a manner as to prevent surface water from enter-ing the wells, and, where pump pits are used, the top of the casing should extend above the floor of the pit so that surface water cannot drain into the well. In constructing wells equipped with ordinary lift or force pumps, it is a good plan to allow the casing to extend several inches above the platform so that the pump base will fit down over the top of the casing, thus effecting a tight seal. If the casing is left flush with the top of the platform opportunity is afforded for drainage into the well and for possible contamination. Wells should not be located where there are possible sources of contamination such as drainage from the vicinity of buildings, privies, or cesspools.
Quality in Relation to Water-bearing Formations
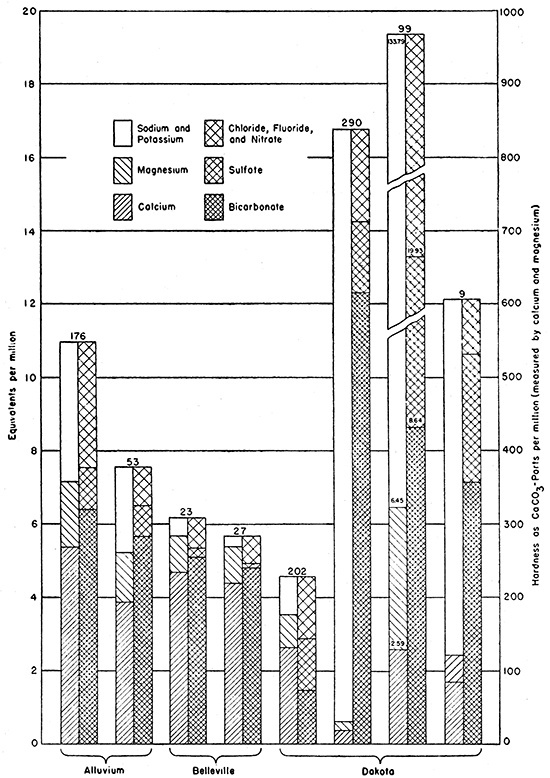
The Belleville formation, the alluvium in the Republican River Valley and in other smaller valleys, and the Dakota formation are the most important water-bearing formations in this area. Analyses of typical waters from each of these units are shown graphically in Figure 5. The graphic representation of analyses by the block diagram (Fig. 5) has been explained by Collins (1927, p. 256). Since one equivalent of calcium carbonate (CaCO3) is 50, the coordinates for equivalents represent hardness as CaCO3 in units of 50 parts per million. The total hardness is measured on the diagram to the top of the magnesium. The carbonate hardness is measured to the top of the bicarbonate if this is below the top of the magnesium (wells 176, 23, 27, and 202). In such a water the distance from the top of the bicarbonate to the top of the magnesium measures the noncarbonate hardness. If the bicarbonate extends above-the magnesium there is no noncarbonate hardness; the water has more alkalinity than hardness and is commonly said to contain sodium bicarbonate or carbonate (wells 53, 290, 99, and 9).
The Dakota formation in this area is characterized by at least 4 types of water as shown by the block diagrams in Figure 5. Samples from wells 202 and 208 are typical waters of the Dakota in the southeastern part of Republic County where the formation crops out. Samples from wells 9 and 141 are typical of the waters in deeper wells that are located a few miles west of the outcrop area. The water from well 9 has a total hardness of 121 parts per million. Samples of water were collected from wells 290 and 291 located southwest of Concordia. These samples had total solids amounting to 938 and 1,752 parts per million and had 31 and 40 parts of total hardness, respectively. They had 677 and 733 parts per million of bicarbonate and 9.0 and 5.5 parts of fluoride. A fourth type of water from the Dakota is represented by the sample from well 99. The City of Belleville originally obtained its water supply from similar wells in the Dakota formation, and most of the wells in the Dakota in the western part of Republic County and in Jewell County yield similar waters. The sample of water from well 99 contained 7,880 parts per million of total solids, 4,020 parts of chloride, 543 parts of sulfate, and 2,927 parts of sodium and potassium.
Figure 5--Analyses of typical waters from the principal water-bearing formations in Republic County and northern Cloud County.
The chemical character of the samples of water collected in Republic County and northern Cloud County is summarized in Table 11.
Table 11--Summary of the chemical characteristics of the samples of ground water collected in Republic County and northern Cloud County
| Range (parts per million) |
Number of samples | ||||
|---|---|---|---|---|---|
| Alluvium | Belleville formation |
Carlile shale |
Greenhorn limestone |
Dakota formation |
|
| Dissolved solids: | |||||
| Less than 250 | 1 | 1 | 0 | 0 | 0 |
| 250-500 | 4 | 10 | 0 | 2 | 4 |
| 501-750 | 1 | 1 | 1 | 1 | 2 |
| 751-1,000 | 0 | 0 | 0 | 2 | 5 |
| 1,001-2,000 | 1 | 1 | 0 | 0 | 2 |
| More than 2,000 | 0 | 0 | 2 | 1 | 5 |
| Hardness: | |||||
| Less than 100 | 0 | 1 | 0 | 0 | 2 |
| 100-200 | 1 | 1 | 0 | 0 | 5 |
| 201-300 | 2 | 7 | 0 | 0 | 1 |
| 301-400 | 3 | 3 | 0 | 3 | 6 |
| 401-500 | 0 | 0 | 1 | 1 | 1 |
| 501-600 | 0 | 0 | 0 | 1 | 1 |
| More than 600 | 1 | 1 | 2 | 1 | 2 |
| Iron: | |||||
| Less than 0.3 | 1 | 2 | 1 | 3 | 1 |
| 0.3-0.5 | 2 | 0 | 0 | 1 | 1 |
| 0.6-1.0 | 0 | 2 | 0 | 1 | 2 |
| 1.1-2.0 | 2 | 3 | 0 | 0 | 2 |
| 2.1-5.0 | 1 | 0 | 0 | 1 | 4 |
| 5.1-10.0 | 0 | 2 | 2 | 0 | 4 |
| More than 10.0 | 1 | 4 | 0 | 0 | 4 |
| Fluoride: | |||||
| Less than 0.3 | 3 | 9 | 0 | 1 | 2 |
| 0.3-0.5 | 1 | 4 | 0 | 3 | 6 |
| 0.6-1.0 | 3 | 0 | 2 | 2 | 3 |
| 1.1-2.0 | 0 | 0 | 1 | 0 | 2 |
| 2.1-5.0 | 0 | 0 | 0 | 0 | 2 |
| 5.1-10.0 | 0 | 0 | 0 | 0 | 3 |
Prev Page--Start of Ground Water || Next Page--Formations
Kansas Geological Survey, Geohydrology
Placed on web Nov. 8, 2016; originally published May 1948.
Comments to webadmin@kgs.ku.edu
The URL for this page is http://www.kgs.ku.edu/Publications/Bulletins/73/05_gw2.html