![]()
Prev Page--Water Use || Next Page--Development
Groundwater Geochemistry
Data about and interpretation of the geochemistry of groundwater in the Dakota aquifer is valuable for 1) determining and predicting where (including areal and vertical dimensions) water resources suitable for different uses are located, 2) understanding the origin of and factors that control individual constituents of concern for various water uses, and 3) differentiating between natural and contamination sources of constituents. During the Dakota Aquifer Program, the KGS assembled and reviewed existing water chemistry data for the Dakota aquifer. The KGS added substantial amounts of new data by sampling and analysis of groundwaters from observation and supply wells across the aquifer and by interpreting geophysical (resistivity) logs to estimate dissolved solids concentration. This section describes these data, factors that control the natural groundwater geochemistry in the aquifer, aquifer contaminants, and spatial variations (both regional patterns and vertical changes) in the groundwater chemistry. Coupled flow and geochemical modeling of freshwater to saltwater transition zones was used to help understand the evolution of chemical changes in the aquifer. Additional information about the geochemistry of groundwater in the Dakota aquifer is in the appendix for this bulletin (http://www.kgs.ku.edu/Publications/Bulletins/260/appendix.html).
Chemical Data for Groundwaters
Data for Water Samples
Water-quality data were assembled from several existing sources, including the USGS, the National Uranium Resource Evaluation program, the KDHE, and the KGS. Electronic data sets were found to contain many problems and errors. These were corrected to the extent possible by examining the original printed version of the data in KGS and USGS publications and by determining the consistency in terms of chemical characteristics such as charge balance. Missing values of major constituent concentrations for existing records in the data base were filled by referring to original data publications. Aquifer codes were assigned or revised based on examination of the well location and depth relative to the surface elevation and contour maps of stratigraphic tops and thicknesses. Records with substantial errors that could not be corrected were deleted.
The KGS collected and analyzed groundwater samples from domestic, stock, municipal, and observation wells during 1987-1988 as part of a Dakota aquifer study in central Kansas for the Kansas Corporation Commission (Macfarlane et al., 1988). The KGS collected and analyzed samples from domestic, municipal, stock, irrigation, and observation wells across most of the Dakota aquifer in Kansas during 1990-1997 as a part of the Dakota Aquifer Program. Sampling in 1992 included supply wells in southeast Colorado as part of a traverse from Colorado to central Kansas conducted in cooperation with the Lawrence Livermore National Laboratories. The KGS also cooperated with consulting companies investigating the water-supply potential of the Dakota aquifer in Ellis and Russell counties to obtain water samples that the KGS analyzed.
The KGS determined concentrations of dissolved major, minor, and selected trace inorganic constituents in 233 groundwater samples collected as part of the Dakota Aquifer Program. Selected samples were sent to USGS laboratories for determination of radionuclides. Kansas State University collected and analyzed 80 samples as part of a cooperative study for the Dakota program.
The chemical data were entered into a water-quality data base that is available on the KGS website for the Dakota Aquifer Program (http://www.kgs.ku.edu/Dakota/vol2/qualDB/quality.htm). As of late 2013, the data base contained 1,594 records for samples from wells that yielded water entirely or partly from the Dakota aquifer, 10 of which are in southeast Colorado and the rest of which are in Kansas. The data base also includes 10 records for wells in the Morrison Formation or Upper Jurassic Series. A total of 1,123 wells sampled only the Dakota aquifer (1,002 wells for samples entirely from the Dakota Formation or Lower Cretaceous Series, 81 wells for the Kiowa Formation, 38 for the Cheyenne Sandstone, and 2 for a combination of Dakota and Cheyenne or Kiowa and Cheyenne). The data base includes records for multiple samples (collected at different dates or times) from 121 of the wells completed entirely or partly in the Dakota aquifer.
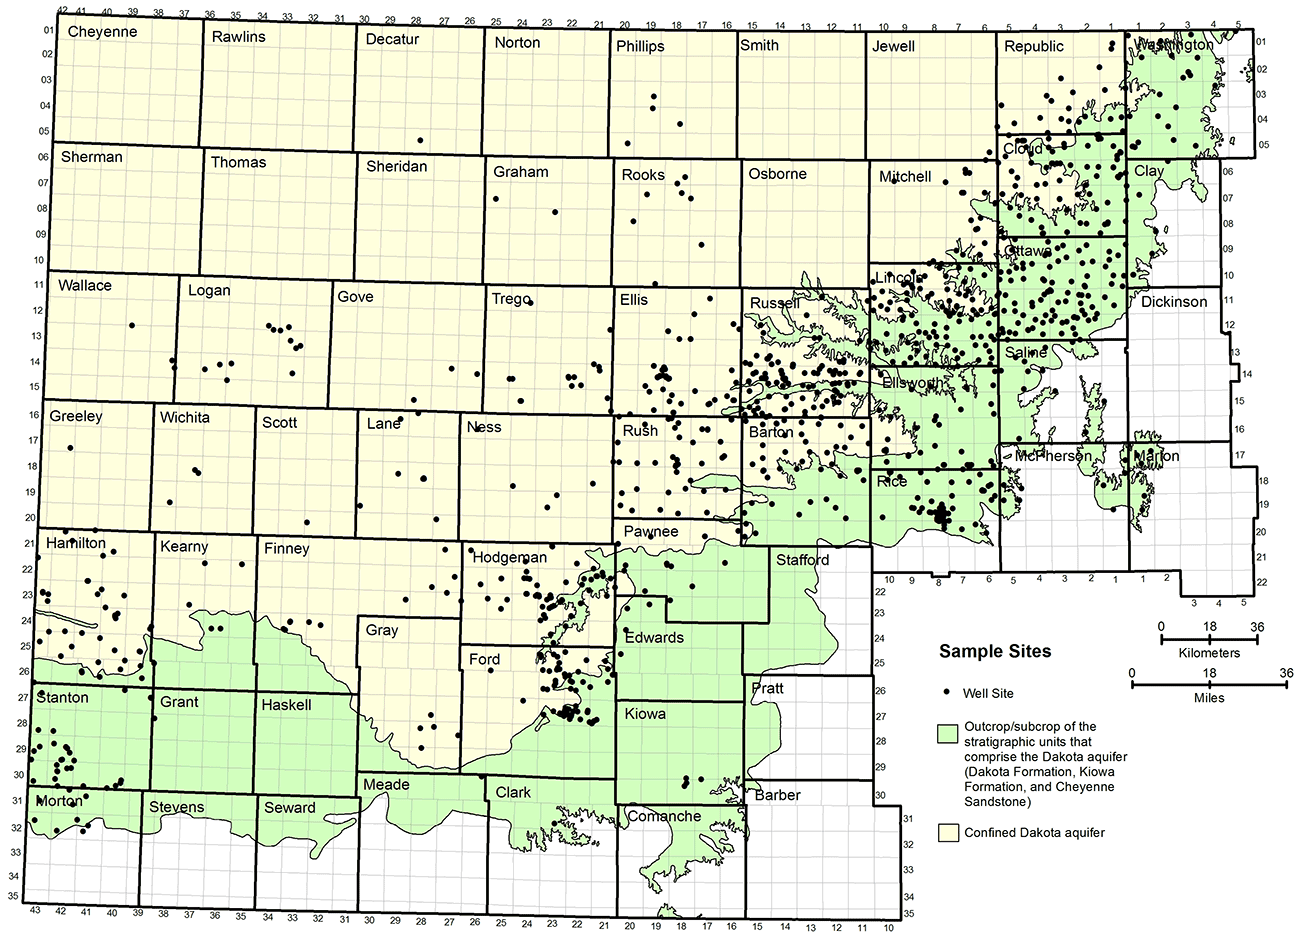
Figure 14 displays the distribution of wells in Kansas from which groundwaters were analyzed and that obtained their water solely from the Dakota aquifer. Most of the sites are located where the water in the aquifer is of good enough quality to be used for water supply. The densest distribution of points is in a band along the eastern outcrop and subcrop of the Dakota Formation, with smaller numbers of points in southwest Kansas.
Figure 14--Distribution of water wells from which groundwater samples were collected from the Dakota aquifer.
Water Quality from Geophysical Logs
Little water sample data are available for the Dakota aquifer in northwest Kansas. However, many oil and gas boreholes for which geophysical logs exist pass through Dakota strata in northwest Kansas. Water resistivities were estimated for groundwaters in Dakota strata from 977 geophysical logs that included spontaneous potential (SP) records in 11 counties in northwest Kansas. These values were used to estimate the TDS concentration using the relationship between conductivity (the inverse of resistivity) and TDS for Dakota aquifer samples within and surrounding northwest Kansas. Locations of logs, methodology, and results of the log analyses are in Boeken (1995). A general description of SP logs and the procedure for estimating water resistivities for the Dakota aquifer is in Macfarlane, Doveton, and Whittemore (1998).
Factors that Control Groundwater Chemistry
The chemistry of groundwater primarily refers to the type and concentration of dissolved substances in the water and properties such as specific conductance, pH, and hardness. The dissolved substances include gases and inorganic and organic constituents. An understanding of the water geochemistry coupled with information about the hydrogeologic properties of the aquifer aids in the delineation of regional and local flow systems.
Table 6 lists the chemical properties and major, minor, and trace constituents that are of value for determining the geochemical characteristics of waters in the Dakota aquifer system. The table also lists general ranges for the properties and constituent concentrations along with water-use criteria for public drinking water, livestock, and irrigation.
The most common substances dissolved in groundwaters in the Dakota aquifer are the inorganic constituents calcium, magnesium, and sodium (positively charged cations) and bicarbonate, chloride, and sulfate (negatively charged anions). Bicarbonate may also be represented as alkalinity in water analyses. Inorganic constituents that commonly contribute minor amounts to the dissolved solids in Dakota groundwater are silica (uncharged) and potassium (a cation), and nitrate and fluoride (anions). Trace to minor amounts of ammonium ion and strontium (cations) and bromide (an anion) in groundwaters are also of value for describing the geochemistry of groundwaters.
Table 6--Chemical properties, general concentration ranges, and water-quality criteria for dissolved inorganic substances and selected metals naturally occurring in Dakota aquifer waters. Natural values can be less than or greater than listed in the table but are typically within the general range.
| Name | Chemical symbol or representation |
General range in the Dakota aquifer, mg/L |
Public drinking water criterion, mg/La |
Livestock water criterion, mg/Lb |
Irrigation water criterion, mg/Lbc |
|---|---|---|---|---|---|
| Properties | |||||
| Total dissolved solids | TDSd | 100-60,000 | R 500 | 5,000e | |
| Alkalinityf | Represented as CaCO3 | 10-1,500 | S 300 | ||
| Total hardnessg | Represented as CaCO3 | 10-9,000 | S 400 | ||
| pH | 6.3-8.8 | R 6.5-8.5 unitsh | |||
| Major constituents (usually or often greater than 5 mg/L) | |||||
| Calcium | Ca | 2-2,000 | S 200 | ||
| Magnesium | Mg | 1-1,000 | S 150 | ||
| Sodium | Na | 3-22,000 | S 100 | ||
| Bicarbonatef | HCO3 | 12-1,800 | S 120i | ||
| Chloride | CI | 2-35,000 | R 50 | ||
| Sulfate | SO4 | 1-6,000 | R 250 | 1,000j | |
| Silica | SiO2 | 4-50 | S 50 | ||
| Minor constituents (usually or often greater than 0.5 mg/L) | |||||
| Potassium | K | 1-150 | S 100 | ||
| Fluoride | F | 0.2-8 | R 2, M 4 | 2 | 1 |
| Nitrate | NO3 | <0.01-3k | M 10 | 100 | |
| Boron | B | 0.03-2 | H 0.6 | 5 | 1 |
| Iron | Fe | <0.001-30 | R 0.3 | 5 | |
| Trace constituents (usually or always less than 0.5 mg/L) | |||||
| Ammonial | NH4 | <0.01-5m | S 0.1 | ||
| Arsenic | As | <0.001-0.05 | M 0.01 | 0.2 | 0.1 |
| Barium | Ba | 0.005-0.5 | M 2 | ||
| Cadmium | Cd | <0.0001-0.005 | M 0.005 | 0.02 | 0.01 |
| Chromium | Cr | <0.0001-0.002 | M 0.1 | 1 | 0.1 |
| Copper | Cu | <0.0001-0.02 | T 1.3 | 0.5 | 0.2 |
| Lead | Pb | <0.0001-0.01n | T 0.015 | 0.1 | 5 |
| Manganese | Mn | <0.001-1 | R 0.05 | 0.2 | |
| Mercury | Hg | <0.0001-0.002 | M 0.002 | 0.01 | |
| Selenium | Se | <0.001-0.05 | M 0.05 | 0.05 | 0.02 |
| Silver | Si | <0.0001-0.001 | R 0.1 | ||
| Zinc | Zn | 0.001-2 | R 5 | 25 | 2 |
- Criteria from the KDHE. R = recommended (Federal Secondary Drinking Water Standard); S = suggested by KDHE; M = maximum contaminant level of U.S. EPA and KDHE; T = must be treated to below level for public supply; H = U.S. EPA health advisory.
- Values recommended by the National Academy of Sciences/National Academy of Engineering or U.S. EPA except for sulfate, which is recommended by Environment Canada.
- TDS and major constituent concentration limits vary depending on salinity tolerance of plants and sensitivity of soil to sodium hazard of water. TDS concentration greater than 500 mg/L can be detrimental to sensitive crops, whereas water with up to 5,000 mg/L TDS can be used for tolerant plants on permeable soils with careful management practices.
- TDS can be a measured value for evaporation to dryness or a sum of constituents in which bicarbonate is multiplied by 0.4917.
- A TDS of greater than 3,000 mg/L is not recommended for poultry. Adult cattle, sheep, swine, and horses can tolerate up to 7,000 mg/L if accustomed to elevated TDS.
- Nearly all alkalinity in groundwater is bicarbonate. Bicarbonate can be calculated from alkalinity by multiplying by l.219.
- Total hardness is the sum of calcium and magnesium concentrations multiplied by 2.497 and 4.116, respectively, to represent conversion to CaCO).
- The unit of pH is dimensionless and represents the negative log of the activity of the hydrogen (hydronium) ion in water.
- The recommended limit for drinking water is based on conversion of the alkalinity value.
- Very young livestock are sensitive to sulfate and may not be able to tolerate above 400 mg/L.
- Concentration as nitrate-nitrogen. Values greater than 3 mg/L are nearly always the result of human activities.
- Ammonia is present in natural water primarily as ammonium ion (NH/).
- Concentration as ammonia-nitrogen.
- Lead concentrations >0.01 that are observed in well waters are often related to lead in a piping system.
Major Dissolved Constituents and Chemical Water Types
Freshwater is often defined as water that contains less than 1,000 mg/L TDS concentration. The TDS of shallow groundwater in the Dakota aquifer can be as low as 100 mg/L. Saltwater sampled from the confined aquifer in parts of north-central Kansas where the Cedar Hills Sandstone directly underlies Dakota strata (fig. 2) can exceed a TDS of 50,000 mg/L. Freshwaters in the outcrop and subcrop portions of the Dakota aquifer in north-central and central Kansas are usually calcium-bicarbonate type waters. Most soils and near-surface rocks in Kansas, including the Dakota aquifer, contain at least small amounts of calcium carbonate present as calcite (CaCO3), which also contains small amounts of magnesium. The mineral dolomite (CaMg(CO3)2) can also be present in the rocks. During infiltration of rainfall, the carbonate minerals dissolve and add calcium, magnesium, and bicarbonate to the water. Table 7 lists the typical ranges of major constituent concentrations in calcium-bicarbonate type waters in the Dakota aquifer.
The weathering of pyrite in Upper Cretaceous shale has sometimes produced a high enough sulfate concentration and an acidic solution that dissolved enough calcium from calcite and dolomite that gypsum has precipitated in the shale. The Graneros Shale overlying the Dakota Formation often contains such secondary gypsum that occurs in the crystalline form selenite. Recharge infiltrating through Cretaceous strata that contains secondary gypsum can dissolve the gypsum, which, along with additional weathering of pyrite and dissolution of calcite, can produce relatively high concentrations of calcium and sulfate. Flow of this water into underlying Dakota strata or the weathering of pyrite and concomitant calcite dissolution within Dakota sediments can substantially increase the calcium and sulfate contents of groundwaters in the upper Dakota aquifer. In some cases, calcium-sulfate waters may result (table 7), although this water type is not as common as the other common types of Dakota groundwaters.
Table 7--Typical ranges of major constituent andjluoride concentrations in the most common types of groundwater in the Dakota aquifer. The water types are listed in order of generally increasing TDS concentration.
| Constituent | Typical range, mg/L |
|---|---|
| Calcium-bicarbonate type | |
| Calcium | 30-150 |
| Magnesium | 10-40 |
| Sodium | 10-60 |
| Bicarbonate | 150-400 |
| Chloride | 5-80 |
| Sulfate | 10-130 |
| Fluoride | 0.5-1.5 |
| Sodium-bicarbonate type | |
| Calcium | 3-50 |
| Magnesium | 1-20 |
| Sodium | 100-350 |
| Bicarbonate | 250-600 |
| Chloride | 20-200 |
| Sulfate | 20-200 |
| Fluoride | 1.5-5 |
| Calcium-sulfate type | |
| Calcium | 80--600 |
| Magnesium | 15-90 |
| Sodium | 30-400 |
| Bicarbonate | 200-400 |
| Chloride | 20-500 |
| Sulfate | 200-1,800 |
| Fluoride | 0.4-1.5 |
| Sodium-chloride type | |
| Calcium | 10-800 |
| Magnesium | 5-800 |
| Sodium | 300-15,000 |
| Bicarbonate | 200-1,300 |
| Chloride | 300-20,000 |
| Sulfate | 100-5,000 |
| Fluoride | 0.5-4 |
Large areas of the Dakota aquifer contain saltwater (sodium-chloride type water) in which the TDS concentration can exceed 10,000 mg/L (table 7). No known evaporite deposits occur in the Dakota aquifer in Kansas. Therefore, the saltwater could either have been derived from past seawater trapped in the Dakota sediments or saltwater that has flowed from other formations into the aquifer. Bromide and chloride relationships in Dakota groundwaters indicate that the main source of this saltwater is dissolution of rock salt in Permian rocks underlying Dakota strata. Although most of the Dakota sediments probably contained seawater either during their deposition or after deposition when the sea covered Dakota sediments, bromide/chloride ratios indicate that nearly all of the seawater in most of the Dakota aquifer in Kansas has been flushed out by freshwater recharge (see online appendix, http://www.kgs.ku.edu/Publications/Bulletins/260/appendix.html). However, saltwater from underlying Permian rocks has been slowly intruding into Dakota strata for millions of years. The salt-dissolution brine replaced the seawater source of salinity long ago. During more recent geologic time, freshwater recharge has been slowly flushing saltwater from the Dakota aquifer to reduce the constituent concentrations in sodium-chloride type waters.
The past occurrence of saline water in Dakota strata resulted in the adsorption of large amounts of sodium on the clays in the sediments. As freshwater of calcium-bicarbonate or calcium-sulfate type slowly flushed the saline water from the aquifer, natural softening of the water occurred as dissolved calcium and magnesium adsorbed on clays and adsorbed sodium desorbed and became dissolved in the water. The decrease in calcium and magnesium concentrations caused some calcite and dolomite in the aquifer strata to dissolve, thereby supplying additional calcium and magnesium to the pore water. Carbonate ions released during carbonate dissolution combined with hydrogen ions to form bicarbonate ions, thereby increasing the pH of the water. The added calcium and magnesium were then available for more cation exchange with sodium.
Some additional bicarbonate may have been generated from slow oxidation of organic matter trapped in Dakota sediments. The combined effect of this and the cation exchange process increased dissolved sodium and bicarbonate concentrations while decreasing dissolved calcium, magnesium, and chloride concentrations in confined parts of the Dakota aquifer. The water types created are, in order of increasing salinity, sodium-bicarbonate type; sodium-chloride, bicarbonate type; and sodium-chloride type with excess sodium. The bicarbonate and chloride-bicarbonate type waters are typically soft because the calcium and magnesium concentrations are relatively low and have alkaline pH as high as 9 units. Table 7 lists the typical ranges of major dissolved constituents in sodium-bicarbonate waters in the Dakota aquifer.
Chemical data for groundwater samples indicate that distinct water types occur in different regions of the Dakota aquifer system. These water types have been generated by a combination of the mixing of groundwaters of different types and the chemical reactions that occur in response to rock-water interactions. As described above, cation exchange and concomitant mineral dissolution and precipitation are the main reactions that affect water chemistry. Mixing of fresh groundwater (from surface recharge) and saline groundwater (from the intrusion of saltwater from underlying Permian strata) in the Dakota aquifer is the main factor setting up conditions for substantial chemical changes in the aquifer.
The primary geochemical and mixing processes described above were simulated by numerical modeling to better understand the evolution of groundwater in the Dakota aquifer in central and north-central Kansas (Chu, 1995; see also online appendix, http://www.kgs.ku.edu/Publications/Bulletins/260/appendix.html). A model of one-dimensional (1-D) flow coupled with chemical reactions was developed to simulate the hydrogeochemical processes involved in cation exchange and calcite precipitation/dissolution along a hypothetical west-east flow path in the aquifer. A model of two-dimensional (2-D) flow coupled with chemical reactions was designed to simulate a chemical transition zone along a subregional lateral profile that incorporated geohydrologic complexities of the Dakota aquifer. Both the 1-D and 2-D models indicate that it takes much longer for the cation and bicarbonate chemistry of the water in the confined aquifer to become similar to that of the inflowing lateral recharge than it takes to flush the salinity (represented by the TDS and chloride concentrations) because of the large exchange capacity of the clays in the sediment. The results of the simulations improved the understanding of the spatial and temporal characteristics of the chemical transitions in the Dakota aquifer.
Table 6 lists recommended and suggested water-quality criteria for major dissolved constituents and properties of water for drinking, livestock, and irrigation use. Much of the groundwater in the Dakota aquifer has high concentrations of TDS and major dissolved constituents. Thus, depending largely on the salinity of the water, groundwater in the Dakota aquifer in many locations exceeds several of the recommended standards listed in table 6. Based on the water-quality data base assembled for the Dakota Program, TDS is the parameter that most often exceeds recommended or suggested public-drinking criteria, followed, in order of decreasing percentage of exceedance, by alkalinity, sodium, sulfate, chloride, calcium, and magnesium.
Relationships among Conductance and Major Dissolved Constituents
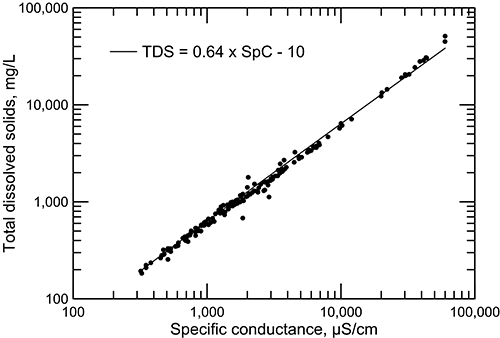
The electrical conductivity of water is a chemical property that is valuable for estimating the concentrations of TDS and most major and some minor dissolved constituents in water. Conductivity is one of the easiest measurements to make in the field or laboratory. The TDS concentration for Dakota groundwater is well correlated with specific conductance (fig. 15). The scatter of points in fig. 15 is usually somewhat greater at low conductances because the larger diversity of water types at lower TDS concentrations results in different relationships between TDS and major dissolved constituents and conductance. At high TDS concentration, the water type is sodium-chloride and the contributions of constituents other than sodium and chloride are relatively small.
Figure 15--Total dissolved solids concentration versus specific conductance measured in the laboratory for Dakota aquifer waters.
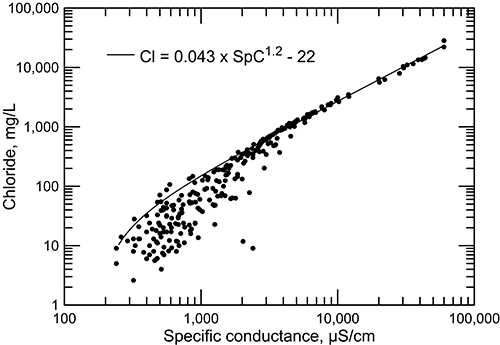
Specific conductance also correlates well with concentrations of chloride (fig. 16) and other major constituents such as sodium. The correlation is much better at high than at low conductance values. In saline waters, the contribution of chloride to the total anion content is large and, along with sodium, predominantly controls the conductance value. As the conductance decreases below 4,000 µS/cm, the contributions of other major constituents (calcium, magnesium, sulfate, and bicarbonate), which have different concentration-conductance relationships, become an increasingly greater proportion of the TDS.
Figure 16--Chloride concentration versus laboratory specific conductance for Dakota aquifer waters.
The correlation between sulfate and conductance is also high, although not as high as for sodium and chloride with conductance. Correlations between the other major constituents, calcium, magnesium, and bicarbonate, are statistically significant but not nearly as high as for sodium, chloride, and sulfate. Plots of major and minor constituent concentrations with conductance and TDS content are shown and described in the online appendix for this bulletin (http://www.kgs.ku.edu/Publications/Bulletins/260/appendix.html).
Minor and Trace Dissolved Constituents
Water in soils and the Dakota aquifer dissolves small amounts of minor and trace inorganic constituents. These substances are present in carbonate and clay minerals, coatings on quartz and other mineral grains, minor mineral grains, salts precipitated in soils during dry periods, and decomposing organic matter or are adsorbed on clays and other mineral surfaces. Infiltration of contaminants derived from anthropogenic activities can increase the concentrations of natural dissolved constituents (particularly nitrate) or add synthetic chemicals, such as pesticides and other dissolved organic compounds, to shallow Dakota waters. Table 6 lists typical ranges of minor and trace inorganic constituent concentrations in Dakota waters, and table 7 lists fluoride contents for different chemical water types.
Nitrate is a minor constituent in Dakota groundwaters free of significant anthropogenic contamination, although it can be a major constituent in some contaminated fresh groundwaters. Most Dakota groundwaters have a nitrate-nitrogen concentration between 0.1 and 100 mg/L. The primary standard for public drinking water, the maximum contaminant level (MCL), for nitrate-nitrogen (NO3-N) is 10 mg/L. High nitrate contents (greater than 10 mg/L as nitrate-nitrogen) typically occur in Dakota groundwaters with a TDS content between 250 and 3,000 mg/L. These are usually from surface contamination and are commonly related to flow down poorly constructed wells. Nitrate is the dissolved constituent for which the largest number and percentage of Dakota aquifer water samples exceeded the MCL in the water-quality data base of the Dakota program. Of the 602 wells for which sample data include nitrate concentration, nearly 15% of the samples contained greater than 10 mg/L nitrate-nitrogen.
Fluoride concentrations range between 0.1 and 10 mg/L in Dakota groundwaters. Low fluoride concentrations (less than 1 mg/L) usually occur in freshwaters of calcium-bicarbonate chemical type. The greatest concentrations of fluoride occur in waters with a TDS content between 600 and 4,000 mg/L. Elevated concentrations of dissolved fluoride (greater than 1 mg/L) are usually associated with sodium-bicarbonate and mixed cation-anion type waters. The high fluoride concentration is primarily derived from the dissolution of calcium minerals that contain fluoride. The cation exchange process that decreases dissolved calcium concentration during the generation of sodium-bicarbonate type water allows these fluoride-containing minerals to dissolve. After nitrate, fluoride is the dissolved constituent with an MCL that is most frequently exceeded in groundwaters in the Dakota aquifer. The MCL for fluoride content in drinking water is 4 mg/L. In addition, a secondary MCL (SMCL) for fluoride of 2 mg/L requires public notification of customers who receive the public water supply. About 8% of the samples from the 768 wells for which fluoride data are available for the Dakota aquifer contain greater than 4 mg/L.
Chemically reducing environments occur where reactions of dissolved constituents and gases with other constituents and with the sediments have essentially completely consumed dissolved oxygen. This commonly occurs in the confined portion of the Dakota aquifer because the water is old and no recent recharge of water with significant oxygen has occurred. The reducing environment allows iron, manganese, and some other heavy metals to dissolve from the sediments. These waters can sometimes have a high enough hydrogen sulfide (H2S) content to give a "rotten egg" odor. Ammonium ion (NH4+) levels can exceed 1 mg/L as ammonia-nitrogen in the reducing environment. Waters in the confined Dakota aquifer tend to have higher dissolved solids than in the unconfined, shallow portions of the aquifer. Thus, groundwater in which ammonium ion exceeds 1 mg/L tends to be slightly saline to saline. When ammonium ion concentration is definitely detectable (ammonia-nitrogen generally greater than 0.1 mg/L) in natural groundwaters with low oxidation-reduction potential, nitrate concentration is typically very low (nitrate-nitrogen less than 0.1 mg/L). Ammonia-nitrogen concentrations often exceed the suggested maximum of 0.1 mg/L for public drinking water in Dakota aquifer water.
Dissolved concentrations of iron range from less than a few µg/L to more than 10 mg/L and of manganese range from less than 1 µg/L to nearly 1 mg/L. The greater concentrations occur in two types of environments. One occurrence is the chemically reducing environment described above. The other environment is in the outcrop or subcrop area of the Dakota aquifer where recharge with dissolved oxygen reaches strata containing pyrite. Oxidation of pyrite and other sulfides, which was discussed earlier as a source of sulfate, is also a source of dissolved iron and manganese in groundwaters. The dissolved iron and manganese released from sulfide weathering oxidizes and precipitates as oxides and oxyhydroxides that produce the red to orange to brown coloration that commonly occurs in Dakota strata. Dissolved iron and manganese in Dakota groundwaters often exceed the recommended criteria of 0.3 mg/L and 0.05 mg/L, respectively, for public drinking use; 59% of the samples from the 691 wells with iron data and 45% of the samples from the 295 wells with manganese data exceeded these criteria. These percentages are substantially greater than for the HPA; only a little more than 1% of about 450 samples from HPA irrigation wells in west-central and southwest Kansas exceeded the iron and manganese criteria (based on data in Hathaway et al., 1977, 1978).
Although trace metals are contained in a variety of minerals, the main substances that control the concentrations of heavy metals (e.g., cadmium, chromium, copper, lead, mercury, nickel, and zinc) and semimetals (e.g., arsenic and selenium) in Dakota groundwaters are probably sulfides, oxides, and oxyhydroxides. Oxidation of sulfides and reduction of oxides and oxyhydroxides can release metals and semimetals within the minerals to the groundwater. Precipitation of these minerals and adsorption on their surfaces, especially on oxides and oxyhydroxides, remove trace and semimetals from solution. Adsorption on clays also can control the amount of trace ionic species in solution. Table 6 lists the general concentration ranges in Dakota groundwaters and the criteria for public drinking water for selected heavy metals and semimetals. Nearly 10% of the Dakota wells for which sample data exist yielded water that exceeded the MCL for arsenic of 0.01 mg/L and the action level for lead of 0.015 mg/L in public drinking water. Some of the lead values could be related to lead in the plumbing system from which the sample was collected. A few to several percent of the sample records exceed the MCLs for cadmium and mercury of 0.005 mg/L and 0.002 mg/L, respectively. No samples were found to have exceeded the MCLs or recommended criteria for public drinking water for chromium, copper, selenium, silver, or zinc.
Uranium and Radionuclides
Uranium occurs naturally in a wide range of rocks and sediments and is weakly radioactive. The three natural uranium isotopes found in the environment undergo radioactive decay by emission of an alpha particle accompanied by weak gamma radiation. Radium is a naturally occurring radioactive constituent that is dissolved in water as a doubly charged cation. It is a radionuclide formed by the decay of uranium and thorium in the environment. Its most common isotopes are radium-226, radium-224, and radium-228. The radioactive decay of radium-226 emits alpha particles and gamma radiation, whereas the decay of radium-228 emits primarily beta particles. Radon is a naturally occurring radioactive gas that has no color, odor, or taste. It is soluble in water and easily leaves water that is exposed to the atmosphere, especially if the water is agitated. Radon has numerous different isotopes; radon-220 and -222 are the most common and are produced by the radioactive decay of radium and thorium, respectively. Table 8 lists the current MCL values for uranium and radionuclides in drinking water. The MCL for uranium is based on the toxicity of the element and not its radioactivity. The MCLs for the other parameters in table 8 are based on radioactivity.
Uranium concentrations are generally low in groundwaters in the Dakota aquifer (table 8). However, a few percent of the well waters sampled exceeded the MCL for drinking water. A few percent of the sampled well waters also exceeded the MCL for gross alpha radioactivity, whereas none of the samples collected from the Dakota aquifer had gross beta radioactivity greater than the MCL. Several percent of the sampled Dakota waters contained combined radium-226 and -228 radioactivity greater than the MCL. Nearly half of the groundwaters sampled for radon-222 radioactivity exceeded the proposed MCL. However, the MCL of 300 pCi/L for dissolved radon proposed by the federal government is quite low and corresponds to less than 10% of the natural radon content in outdoor air. None of the Dakota waters sampled for radon contained close to the alternate MCL (table 8).
Table 8--Assessment of water-quality data for the Dakota aquifer based on public-drinking-water limits for uranium and radiochemical constituents and properties. Criteria are maximum contaminant levels used by the KDHE and the U.S. EPA.
| Property or constituent |
Number of sites |
Range | Drinking-water criterion |
Percent exceeding criterion |
Limit of detection |
Number of < valuesa |
|---|---|---|---|---|---|---|
| Uranium, µg/L | 77 | <0.01-41 | 30 | 2.6 | 0.01-0.2 | 15 |
| Gross alpha radioactivity (minus uranium), pCi/L |
40 | 0-29 | 15 | 5.1 | 0.4-1 | 6 |
| Gross beta radioactivity, pCi/L | 40 | 2.4-29.9 | 50 | 0 | 1 | 0 |
| Radium-226/228 (combined), pCi/L | 40 | 0.1-10.8 | 5 | 7.5 | 0.1 | 0 |
| Radon-222, pCi/L | 29 | <40-1,200 | 300b 4,000c |
48.3 0 |
40 | 2 |
| a. Number of values reported as less than the detection limit of the analytical method used. b. Maximum contaminant level proposed by U.S. EPA if a state chooses not to develop a Multimedia Mitigation program. c. Alternative maximum contaminant level proposed by U.S. EPA if a state chooses to develop a Multimedia Mitigation program. |
||||||
Characteristics of Contaminated Groundwater
The main constituent in Dakota groundwater that has been increased substantially in concentration by human activities is nitrate. Nitrate-nitrogen concentration greater than 3 mg/L is generally considered to be above that originally present in uncontaminated Kansas groundwater. Human sources of nitrate include fertilizer and animal and human waste. Dissolved species of nitrogen from these sources can enter groundwaters by infiltration of water through the unsaturated zone to the water table or by water flowing down the boreholes of wells, especially if the annular space between the well casing and borehole is poorly sealed or not sealed. If the contaminated water that reaches the water table contains a high concentration of dissolved nitrogen species in the form of ammonium ion or nitrogen-containing organic compounds, oxidation to nitrate in the groundwater system could occur if there were enough dissolved oxygen or other dissolved species that could oxidize the nitrogen.
The occurrence of most high-nitrate waters (greater than several mg/L nitrate-nitrogen) at shallow depths in the unconfined portion of the Dakota aquifer is consistent with a surface source of nitrate contamination. All waters with records in the Dakota water-quality data base that were sampled from wells with depths greater than 300 ft (91 m) in the unconfined aquifer contained nitrate-nitrogen less than several mg/L. Several samples of groundwaters from the confined aquifer contained high nitrate content. It is probable, especially for wells with depths greater than 100 ft (30 m), that some water from the surface or shallow depths entered the aquifer through poorly constructed wells, because the confining stratum immediately above the Dakota aquifer (Graneros Shale) should have a low enough permeability to substantially retard downward movement of contaminated water.
Another constituent elevated in some Kansas groundwater by human activities is chloride. The determination of the amount of chloride from anthropogenic sources in Dakota aquifer water is often difficult due to the large concentration that can come from natural sources. Use of bromide, chloride, and sulfate concentration relationships is generally the best approach for geochemical differentiation of anthropogenic sources of chloride contamination, such as oil-field brine, from natural salinity. Evaluation of chemical data for the Dakota aquifer indicates that substantial contamination of the Dakota aquifer by oil-brine contamination occurs only at a few locations. In comparison, nitrate contamination of the aquifer is much more common.
Regional Groundwater Geochemistry
Areal Geochemical Patterns
The TDS and chloride concentrations of Dakota groundwaters are the most useful parameters for characterization of the salinity. The regional distributions of TDS and chloride concentrations in groundwaters in the upper Dakota aquifer are shown in figs. 17 and 18. The maps represent only the upper part of the Dakota aquifer in each region because the shallower portion of the aquifer at a given location generally contains the least saline water, which would be the most usable in that area. In most regions, the maps represent the quality of water in the Dakota Formation, but in the outcrop and subcrop areas where the Dakota Formation has been removed by erosion, the upper Dakota aquifer in the maps can be the Kiowa Formation or Cheyenne Sandstone. The TDS and chloride maps are based on chemical analyses of samples from supply wells in the area where water is used, analyses of samples from observation wells, and interpretation of geophysical logs from many oil and gas boreholes in the area of saline water without supply wells in northwest Kansas.
Figure 17--Distribution of total dissolved solids concentration in groundwaters in the upper Dakota aquifer.
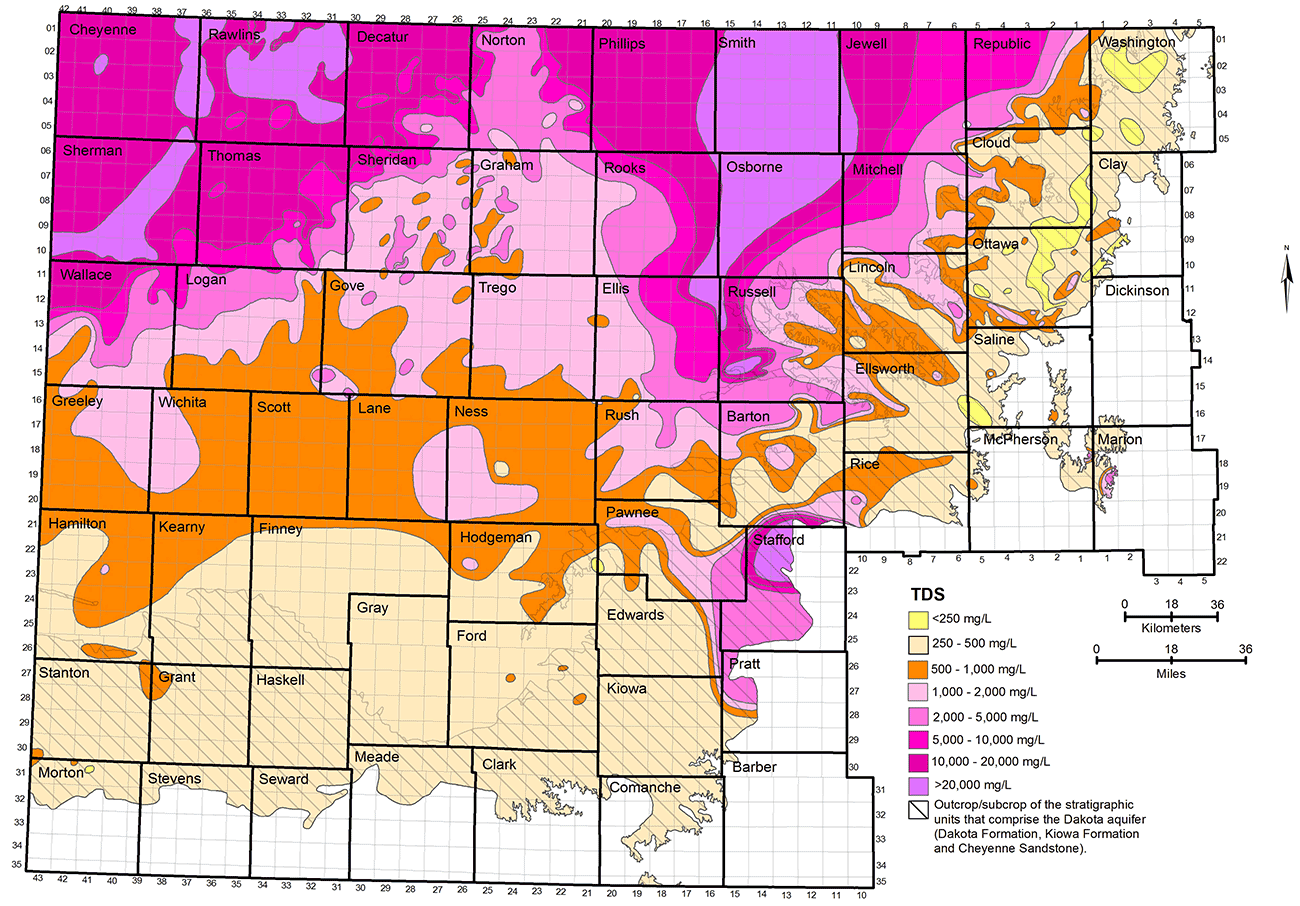
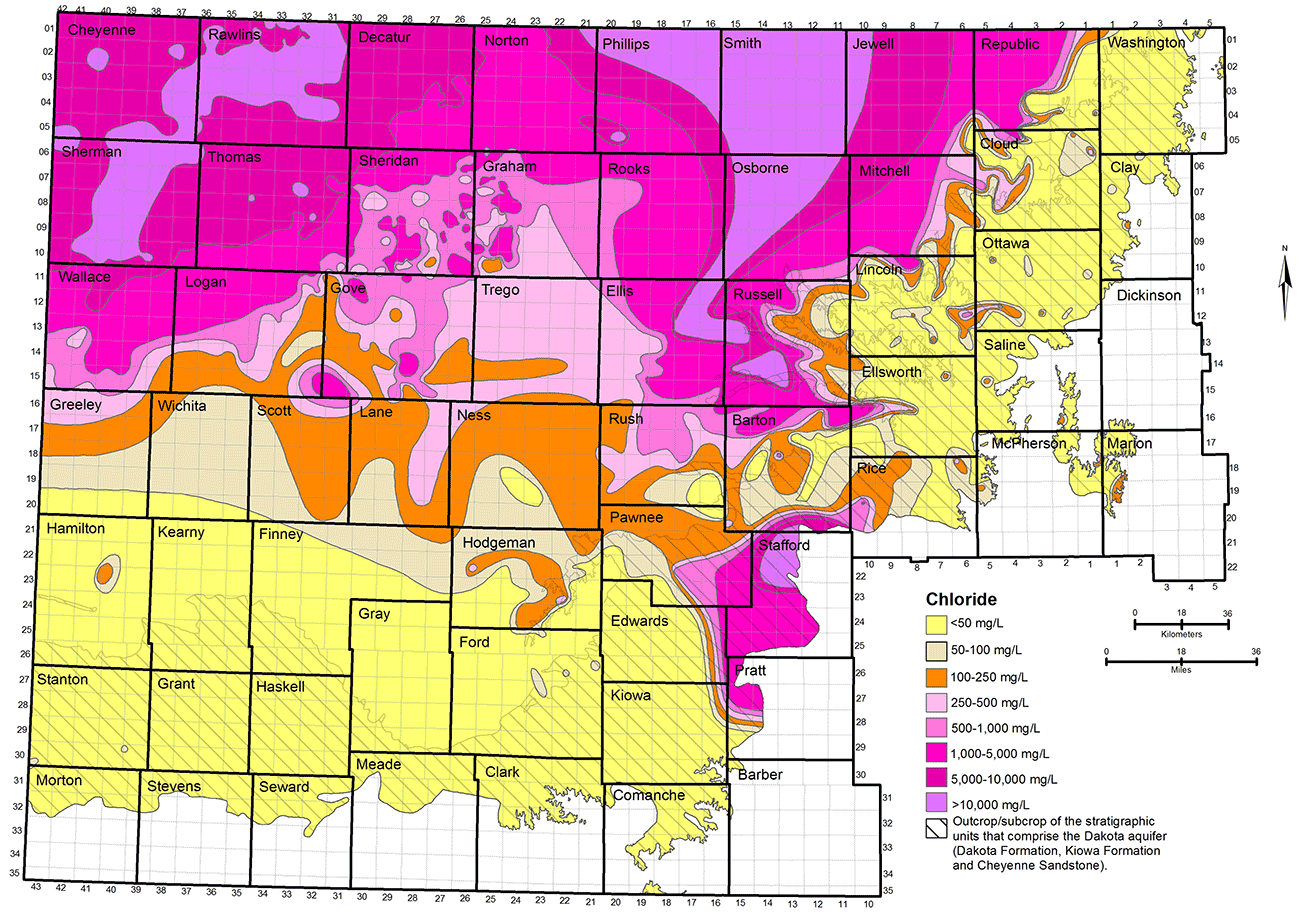
Figure 18--Distribution of chloride concentration in groundwaters in the upper Dakota aquifer.
Groundwater in the Dakota aquifer is usually fresh (TDS content less than 1,000 mg/L) in the outcrop area and where the aquifer subcrops beneath unconsolidated deposits of alluvium in central and north-central Kansas and the HPA in south-central and southwest Kansas (fig. 17). The freshest water (TDS content less than 250 mg/L) occurs in parts of Washington, Cloud, Clay, Ottawa, Ellsworth, and Saline counties in the central to eastern part of the outcrop belt from central to north-central Kansas. The less than 250 mg/L TDS water typically contains less than 50 mg/L chloride (fig. 18) and less than 50 mg/L sulfate concentrations. Groundwater with 250-1,000 mg/L TDS content in the outcrop and subcrop belt in central and north-central Kansas usually has a greater sulfate than chloride level.
Freshwater occurs in the subcrop area of the Dakota aquifer underlying the HPA in south-central and southwest Kansas. However, Dakota strata in western Stafford County, the southernmost part of Barton County south of the Arkansas River, southeast Pawnee County, easternmost Edwards County, and northwest Pratt County where the Dakota occurs are expected to contain saline water even though no sample data are available. Saltwater intrudes upwards from the Cedar Hills Sandstone and other Permian units underlying Dakota strata to affect the HPA in that area. The TDS, chloride, and sulfate concentration isolines for that area in figs. 17-19 are estimates based on data from observation wells screened at the base of the HPA and in the Permian bedrock (Whittemore, 1993). The salinity could range substantially with depth in the Dakota in parts of this area, from higher concentrations just above the Permian to lower values just below the HPA.
Almost no chemical data exist for groundwater in the unconfined part of the Dakota aquifer in Grant, Haskell, southern Kearny, southern Finney, northern Stevens, northern Seward, northern Meade, and southwestern Gray counties. In October 2013, the KGS analyzed a sample of water pumped from 700-780 ft in a test well in the Cheyenne Sandstone in northwest Haskell County. The water was fresh, with TDS, chloride, and sulfate concentrations of 520 mg/L, 9 mg/L, and 219 mg/L, respectively. These data suggest that not only can freshwater be obtained from the upper Dakota aquifer in the unconfined region of southwest Kansas but also from the lower Dakota aquifer.
Freshwater extends into the confined portions of the aquifer in southwest Kansas and parts of south-central and west-central Kansas (fig. 17). Data from the interpretation of geophysical logs suggests that there could be fingers of fresh to nearly fresh water (near 1,000 mg/L TDS) in the confined aquifer as far north as southeast Sheridan and southwest Graham counties. As is the case in the outcrop area, the sulfate concentration is usually greater than the chloride content for these freshwaters.
The transition of freshwater to saline water (TDS content greater than 1,000 mg/L) in the Dakota aquifer in central and north-central Kansas generally occurs near the outcrop/subcrop boundary (fig. 17). The shape of the transition near this boundary is irregular because of the convolutions in the boundary caused by the erosion of major valleys into the confining layer. The salinity of the groundwater increases substantially in a westerly direction from the outcrop/subcrop belt to a TDS level that exceeds 20,000 mg/L in most of Smith County, more than half of Osborne County, and parts of eastern Phillips, western Jewell, northwest Mitchell, eastern Rooks, northeast Ellis, and western Russell counties. The chloride concentration in these areas is close to or greater than 10,000 mg/L (fig. 18). West of this saltwater zone is a well-defined wedge of slightly to moderately saline groundwater (1,000-5,000 mg/L TDS) that points northward to the Nebraska border. The southern part of the wedge extends from Logan County on the west through Gove and Trego counties to Ellis County on the east. The center of the wedge occurs from southeast Thomas County through Sheridan and Graham counties to western Rooks County. The top of the wedge is located in southeast Decatur County and much of Norton County. Groundwater in the confined Dakota aquifer increases in salinity into northwest Kansas. In parts of northwest Kansas, primarily parts of Cheyenne, Rawlins, and Sherman counties, the TDS concentration of the groundwater exceeds 20,000 mg/L.
The regional salinity pattern of Dakota groundwaters is mainly dependent on the rate at which freshwater is able to enter from above and along the long flow paths in the aquifer in comparison with the rate of saltwater intrusion from underlying Permian rocks. In some regions, the saltwater is able to more rapidly intrude into the bottom of the Dakota, such as in parts of central to north-central Kansas where the Dakota directly overlies the Cedar Hills Sandstone (fig. 2). In northwest Kansas, the thickness of the confining units is great and the rate at which freshwater flows through is low. The Dakota rocks contain saltwater in both of these regions.
Surface recharge along the outcrop belt of the Dakota aquifer in southeast Colorado and central Kansas occurs at a much greater rate than underlying saltwater intrusion, resulting in essentially complete flushing of any previous saltwater. Fresh recharge flowing through the Dakota sandstones in southwest Kansas also has removed nearly all salinity. The freshwater flowing through sandstones in the confined aquifer between northwest and central Kansas has removed much of the saltwater, but enough dissolved salt remains to make much of the water slightly to moderately saline. The western side of the wedge of Dakota groundwater with TDS less than 5,000 mg/L between northwest and north-central Kansas reflects where the flushing rate has been greater than the saltwater intrusion rate; on the eastern side, the transition is to where the saltwater intrusion rate is greater than that of the flushing. The rate of any flushing is slow, such that substantial changes over regional distances take many thousands of years. In general, the greater the distance from the edge of the confining zone, the greater the salinity.
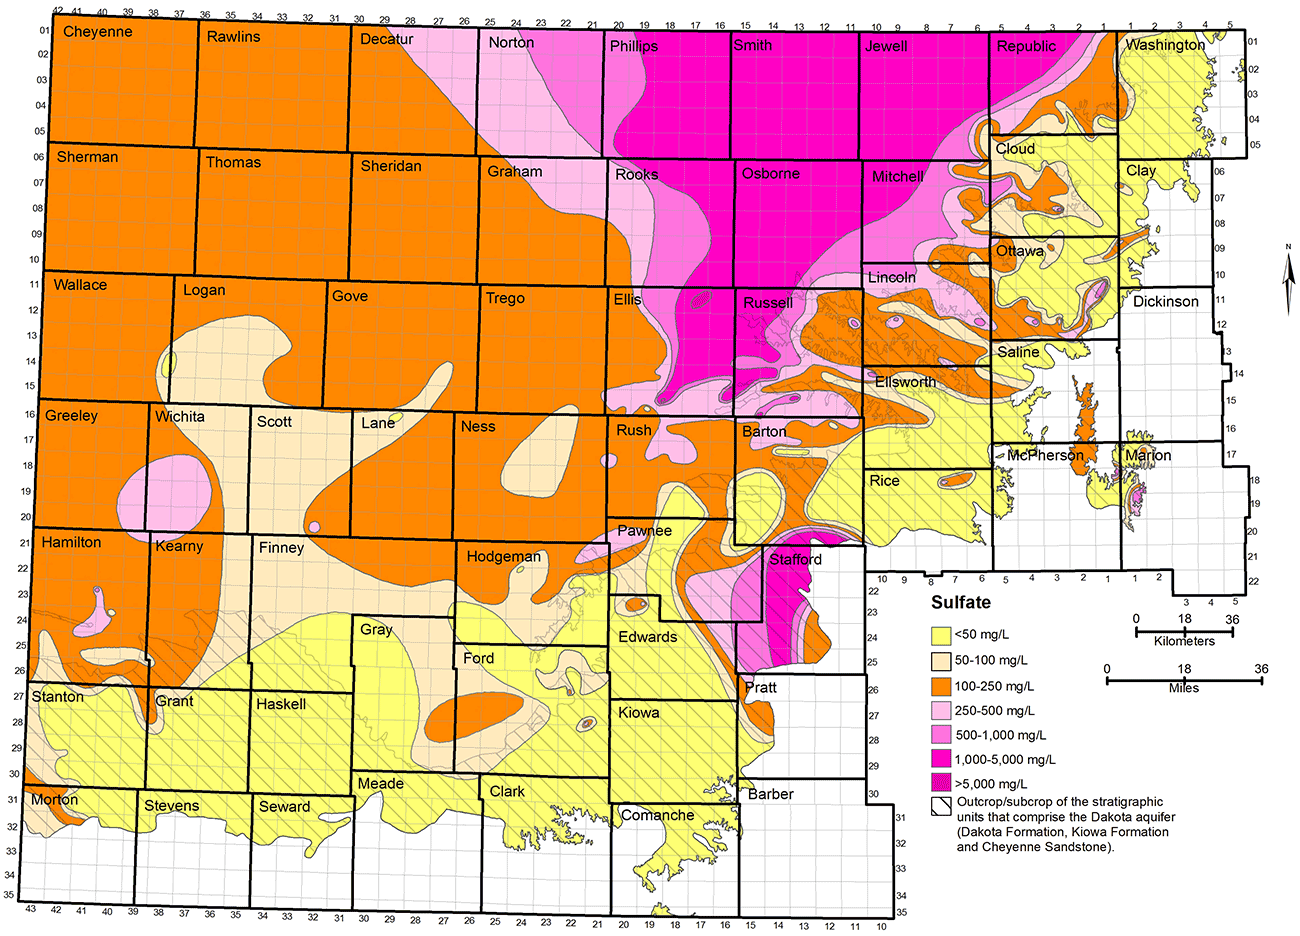
Although sulfate concentration generally increases along with chloride concentration in the saline waters in the Dakota aquifer that intrude from underlying Permian strata, sulfate can also independently vary spatially (fig. 19). For example, fig. 19 indicates that sulfate concentration can be greater than 250 mg/L (the recommended limit for drinking water) in areas where the chloride concentration is less than 50 mg/L. In this case, the sulfate is either derived internally in Dakota strata from the oxidation of pyrite or introduced by high-sulfate recharge into the aquifer from overlying Upper Cretaceous rocks. In both cases, the continual introduction of sulfate can be at a rate that negates the flushing by local and regional flow that dilutes the chloride concentration. Although sulfate contours in most of the map area of fig. 19 are based on sample data for the Dakota aquifer, the area of high sulfate concentration centered on western Stafford County was inferred from observation wells in underlying Permian strata and at the base of the overlying HPA (as was the case for the distribution of TDS and chloride shown in figs. 17 and 18, too).
Figure 19--Distribution of sulfate concentration in groundwaters in the upper Dakota aquifer.
Groundwater in the areas of the upper Dakota aquifer with high TDS content (greater than 5,000 mg/L) shown in fig. 17 is of sodium-chloride chemical type. Water in the area of the confined aquifer in fig. 17 with 500-2,000 mg/L TDS is generally soft (low calcium and magnesium content) and sodium-bicarbonate in chemical type. Groundwater with 2,000-5,000 mg/L TDS in the confined area is typically transitional between sodium-bicarbonate and sodium-chloride type. Groundwater in the outcrop and subcrop areas with less than 500 mg/L TDS content is usually of calcium bicarbonate type. Concentrations of TDS between 500 and 2,000 mg/L in water in the outcrop/subcrop areas are often due primarily to dissolved calcium and sulfate contents that make the waters calcium-sulfate in type. Elevated sulfate concentration with substantially lower chloride content can produce sulfate-type water in less saline portions of the confined aquifer.
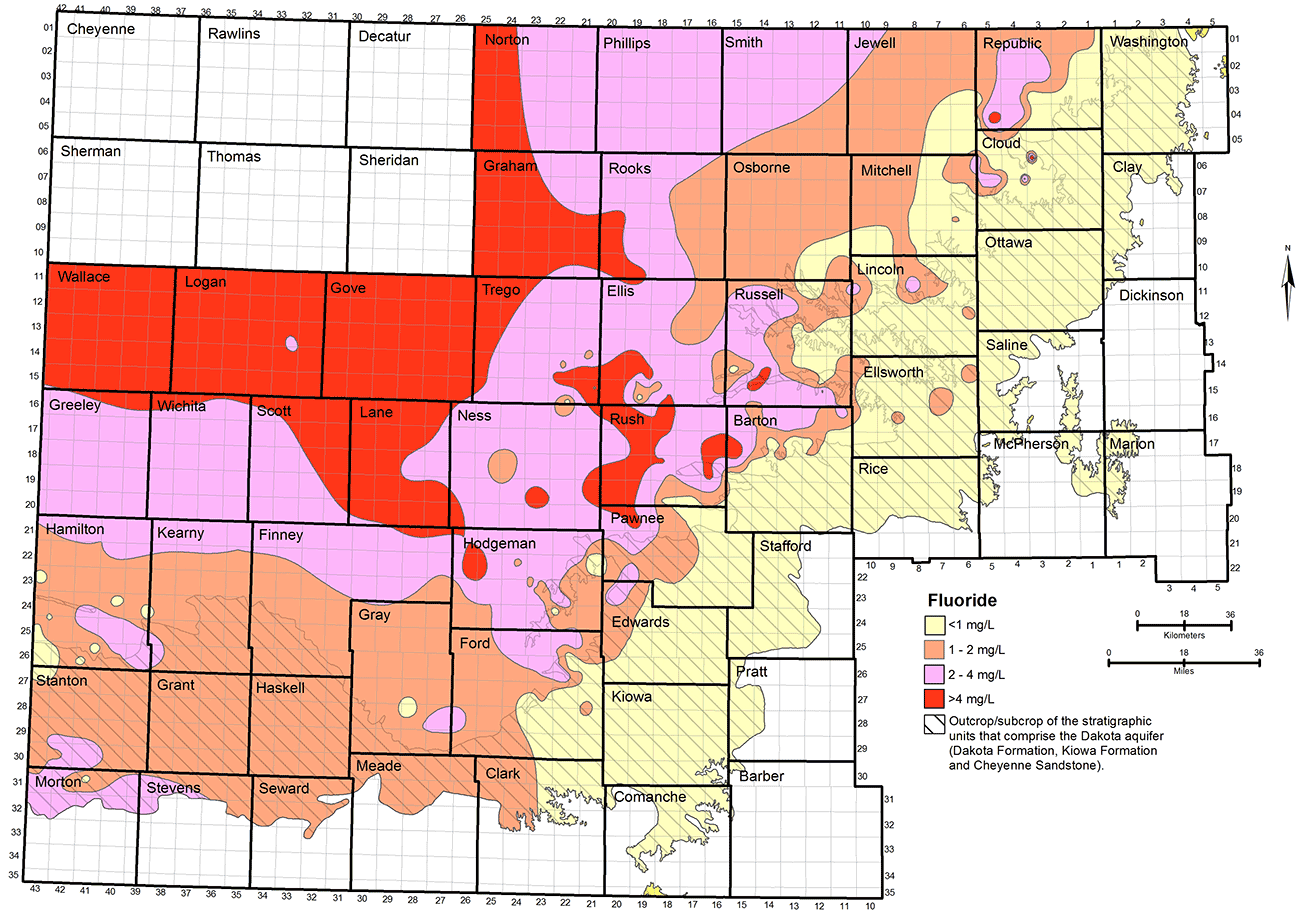
Groundwater in the Dakota aquifer typically contains a low fluoride concentration (less than 1 mg/L) in the outcrop and subcrop areas where calcium-bicarbonate type water is the common chemical type (fig. 20). Low fluoride water also occurs in parts of the confined aquifer near the outcrop/subcrop boundary. Fluoride concentrations are usually 1-3 mg/L in the Dakota aquifer in most of the region where the Dakota directly underlies the HPA in southwest Kansas. Fluoride levels generally increase from about 1 mg/L near the outcrop/subcrop boundary to greater than 4 mg/L where greater thicknesses of Upper Cretaceous rocks confine the Dakota aquifer. Higher fluoride concentration is generally associated with sodium-bicarbonate or mixed cation-anion type waters in the confined aquifer. Water in the area of the confined aquifer with a TDS content in the range of 500-2,000 mg/L that is soft (low calcium and magnesium content) often has relatively high fluoride concentration (greater than 4 mg/L). This type water occurs in the confined aquifer from west-central Kansas toward central Kansas. It is unknown as to whether the fluoride content of the highly saline water in northwest Kansas also exceeds 4 mg/L. However, the high calcium concentration in the saline water is generally expected to limit the fluoride content to below a few to several mg/L.
Figure 20--Distribution of fluoride concentration in groundwaters in the upper Dakota aquifer.
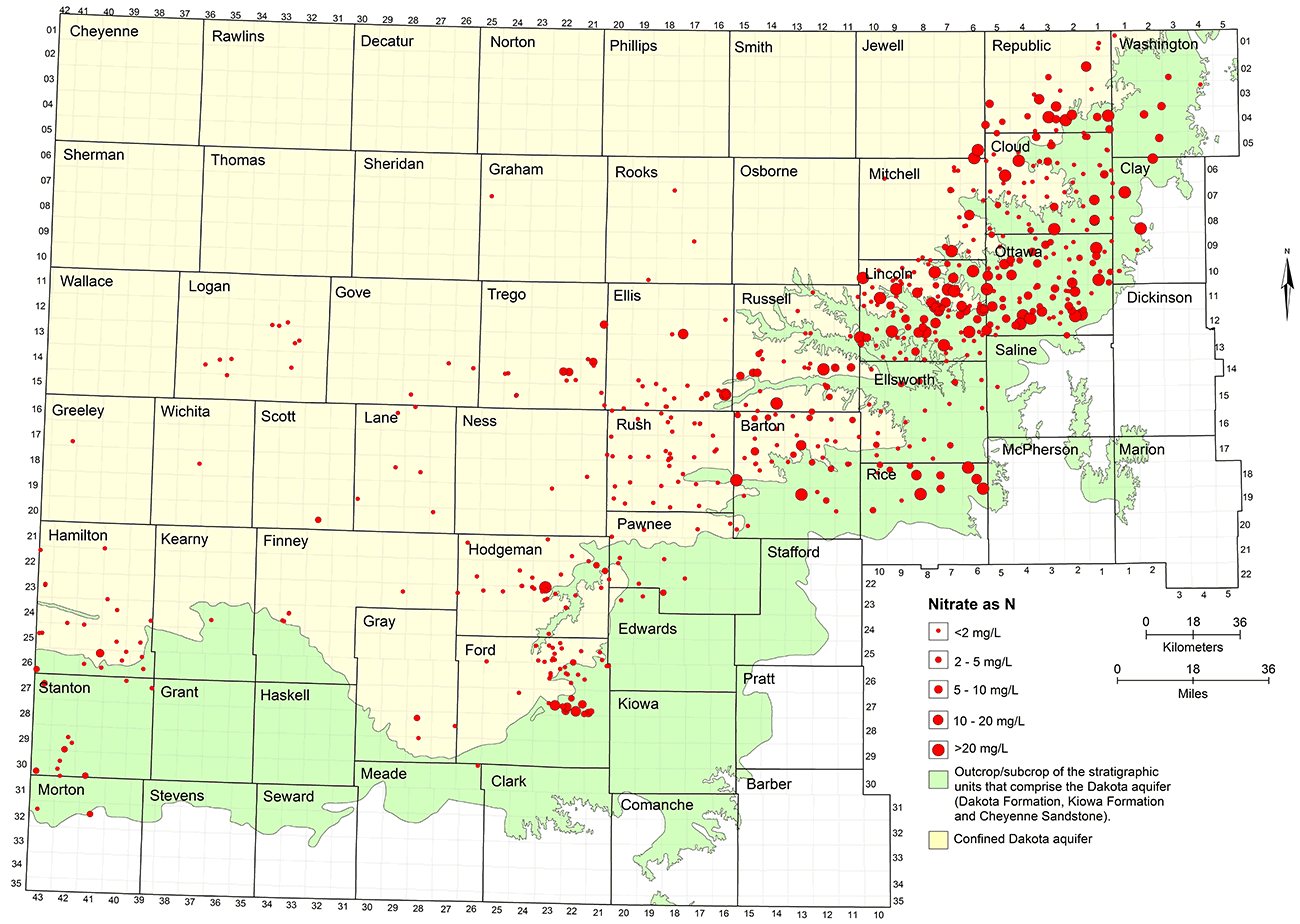
Natural nitrate concentration in Dakota groundwater is usually less than 2 mg/L as nitrate-nitrogen. The low nitrate water occurs both in the unconfined and confined portions of the aquifer (fig. 21). Contaminated groundwaters are mainly distributed in the area of the unconfined aquifer but also occur in the confined aquifer, especially near the confined-unconfined boundary in central and north-central Kansas. Many of the wells in north-central and central Kansas have yielded water with greater than the MCL for nitrate-nitrogen of 10 mg/L; most of these are for domestic and stock wells. As described in the previous section on contamination characterization, nitrate contamination of the confined aquifer probably occurs mainly from the flow of water from the surface or near surface down an unsealed or poorly sealed annulus in a well borehole. Most of the water produced from wells in the confined aquifer in western Kansas has not been contaminated by nitrate, indicating protection by the confining zone as well as implying better well construction. Data for all well locations in the chemical data base for the Dakota aquifer were used to prepare fig. 21. Some of the older wells with contamination in north-central and central Kansas are probably no longer used. Thus, dilution of past contamination and better well construction could result in a map with fewer locations showing greater than 10 mg/L nitrate-nitrogen if only more recent data were used.
Figure 21--Nitrate concentration in groundwaters at well locations in the upper Dakota aquifer
Geochemical Profiles across an Aquifer Flow Path
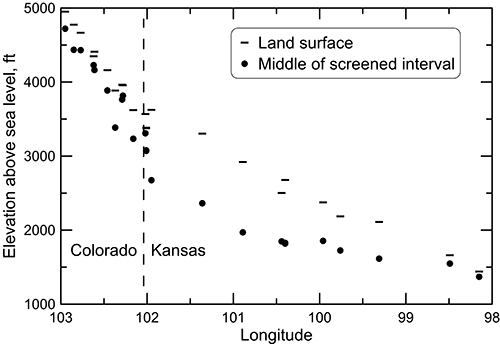
A cross section of the chemical characteristics in the Dakota aquifer from southeast Colorado to central Kansas illustrates the chemical transitions along a major regional path of groundwater flow in the aquifer (see fig. 2 for generalized regional flow patterns). The geochemical profiles are based on data collected during the Dakota Aquifer Program. Figure 22 is a cross section depicting the elevations of the land surface and of the middle of the screened interval of the wells sampled. A general decrease in land surface slope is apparent near the boundary between Colorado and Kansas. The groundwater flow in the Colorado subregion of the cross section is primarily within a local flow system. The flow path in Kansas is confined until the farthest eastern well, although the confining strata are thin enough at the next to most eastern well that vertical recharge through the confining unit is sufficient to appreciably change the water chemistry. The most eastern well is in the local recharge and discharge flow system of the outcropping Dakota aquifer. The cross section graphically illustrates that the wells in the Dakota aquifer are generally shallower in the western and eastern local flow areas and deeper in the confined portion of the aquifer in western Kansas.
Figure 22--Elevation of the land surface and the middle of the screened interval for wells sampled along a regional flow path of the Dakota aquifer from southeast Colorado to central Kansas.
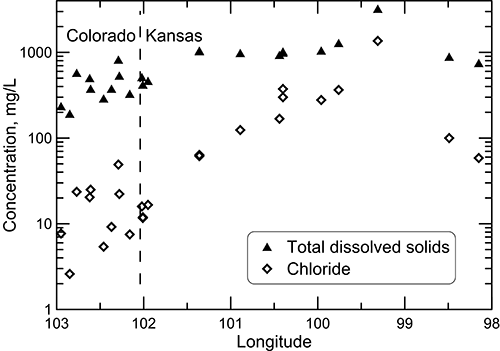
Groundwater in the Dakota aquifer is fresh and the chloride concentration generally less than 50 mg/L in the recharge and local flow area of southeast Colorado (fig. 23). The TDS concentration increases to about 1,000 mg/L in water in the confined aquifer in western Kansas and then increases substantially in the zone of Permian saltwater intrusion in the confined aquifer in central Kansas. The chloride concentration increases steadily in the confined part of the profile and becomes a greater percentage of the TDS content. The TDS and chloride concentrations then decrease farther to the east in the discharge and local flow system of the outcrop/subcrop belt where freshwater recharge flushes and dilutes saline water in the Dakota aquifer. Sulfate concentration ranges relatively widely across the profile; the ranges for the samples collected in Colorado at the well locations displayed in fig. 22 and for samples collected farther down the flow path substantially overlap (17-358 mg/L for the western recharge zone and 113-457 mg/L for the confined zone). The easternmost groundwater at the discharge end of the profile contained 128 mg/L of dissolved sulfate. Bicarbonate concentration generally increases from west to east along the profile, from the range 136-269 mg/L in the western recharge zone, to 268-442 mg/L in the central part of the confined zone, to 379-547 mg/L in the easternmost two wells.
Figure 23--Total dissolved solids and chloride concentrations for wells sampled along a regional flow path of the Dakota aquifer from southeast Colorado to central Kansas.
The patterns for sodium and calcium concentrations along the profile differ substantially (fig. 24). The change in sodium is somewhat similar to that for chloride. Although the concentration increase from the recharge zone to the location with the highest concentration (saline intrusion from the Permian) is substantial, it is not as steady as for chloride. The reason is that cation exchange of calcium and magnesium (in the recharge) for sodium on clays in the aquifer increases the sodium concentration from what would be expected from the simple mixture of freshwater flowing along the profile with saltwater intrusion from the underlying Permian strata. Therefore, the increase in sodium concentration along the flow path is derived from both the cation exchange process and an increasing amount of saline water from Permian intrusion.
Figure 24--Sodium and calcium concentrations for wells sampled along a regional flow path of the Dakota aquifer from southeast Colorado to central Kansas.
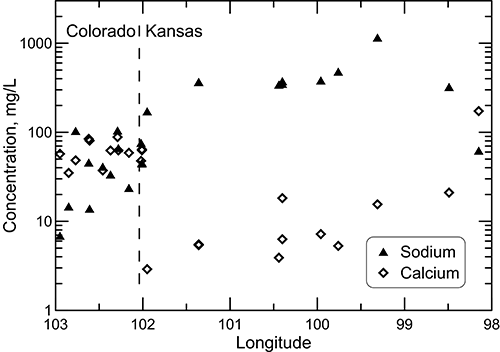
The pattern in the calcium concentration (fig. 24) illustrates the onset of the cation exchange process once the flow path leaves the recharge zone in Colorado and enters the confined aquifer in western Kansas. The pattern in the magnesium profile is similar to that for calcium. Groundwaters in southeast Colorado derive calcium and magnesium from leaching carbonate minerals in the aquifer rocks as well as from recharge that leaches carbonate minerals in soils in an environment of greater evapotranspiration than precipitation. The aquifer is well flushed in this area. Thus, any saline water has been essentially removed, and sodium and chloride concentrations in the groundwater are low. When the flow path enters the westernmost part of the confined zone in western Kansas, both calcium and magnesium concentrations drop sharply as a result of the cation exchange process. The aquifer in the confined area has not been as well flushed of saline water as in the local flow and recharge area of southeast Colorado, leaving a high sodium content on the clays. The high exchange capacity of most aquifer clays requires interactions with large volumes of inflowing water before the adsorbed cation concentrations approach ratios that are in near equilibrium with the inflows, and thus no longer appreciably change the inflow chemistry. The calcium and magnesium concentrations generally increase across the confined portion of the aquifer in Kansas as the TDS content rises. The local flow and discharge zone at the eastern end of the profile contains groundwater with calcium and magnesium contents either similar to or higher than in the recharge zone in Colorado.
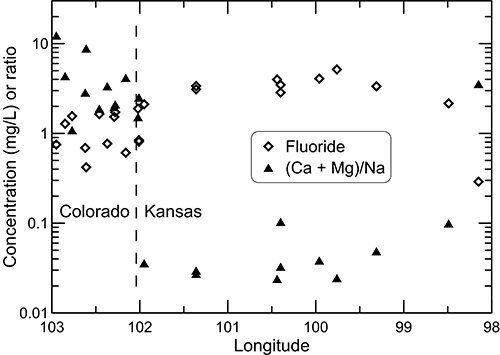
The change in the ratio (calcium + magnesium)/sodium along the flow path illustrates the effects of the exchange process (fig. 25). The ratio decreases by an average of about two orders of magnitude from the recharge area in southeast Colorado to the western part of the confined zone in western Kansas. The ratio remains relatively low in the confined aquifer and then increases substantially in the local recharge and discharge zone to a value within the range of that for the recharge zone in southeast Colorado. The relative change in dissolved fluoride concentration in the Dakota aquifer water along the flow path from southeast Colorado to central Kansas (fig. 25) is generally inversely related to the calcium concentration (fig. 24) because of the dissolution of fluoride-containing calcium minerals as described earlier. The fluoride concentration is greatest in the main part of the confined flow path in Kansas where the water has low calcium concentrations from cation exchange.
Figure 25--Fluoride concentration and (calcium + magnesium)/sodium equivalent ratio for wells sampled along a regional flow path of the Dakota aquifer from southeast Colorado to central Kansas.
Vertical Geochemical Changes
Saltwater occurs in the Permian rocks underlying the Dakota aquifer in much of Kansas. The saltwater intruded into Dakota aquifer strata in the geologic past and continues to intrude at varying rates into the aquifer where the Permian contains saltwater. Freshwater recharge from the surface and lateral flow of that recharge has been diluting and flushing the saline water from the aquifer at a faster rate than upward intrusion of the saltwater. Thus, the salinity in the Dakota aquifer generally increases with depth. The rate of salinity change with depth is seldom uniform; the TDS concentration is usually substantially greater below low-permeability layers that impede either the upper transport of saline water or the downward movement of fresh groundwater recharge, depending on the local hydraulic gradient. Salinity can also increase with depth within a thick sandstone if saltwater occurs in underlying units.
In the western areas of the outcrop/subcrop belt in south-central to north-central Kansas and the parts of the confined aquifer near the boundary with the outcrop/subcrop belt, the topography varies because of the incision of streams and rivers. The lowland areas along streams can serve as locations of regional and local saline discharge. As a result, deeper, saline water in the Dakota aquifer can discharge to the alluvial aquifer and streams, creating saline water springs and seeps and increasing the salinity of streams and rivers. Salt marshes associated with this saline discharge occur in the Saline, Solomon, and Republican river valleys of central and north-central Kansas (see fig. 14 in Macfarlane, Doveton, and Whittemore, 1998). Discharge of the saline water to the alluvial aquifers and thence to streams and rivers just to the east of the boundary of the confined zone increases the salinity of the Saline, Smoky Hill, Solomon, and Republican rivers. Surface recharge of freshwater to the Dakota aquifer in the upland areas creates local hydraulic heads that are higher than the water levels in the stream valleys. This causes downward flow of the freshwater along curved flow lines from the uplands to the valleys and mixing with the regional discharge. In general, greater salinity increases in a river are related to a greater salinity and volume of saline groundwater discharge, a smaller amount of fresh groundwater recharge mixing with the deeper, discharging saline groundwater, and a smaller flow of fresh river water entering the area where the saline groundwater discharge occurs. Such conditions explain why the salinity increase in the Saline River is greater than in other rivers in central and north-central Kansas.
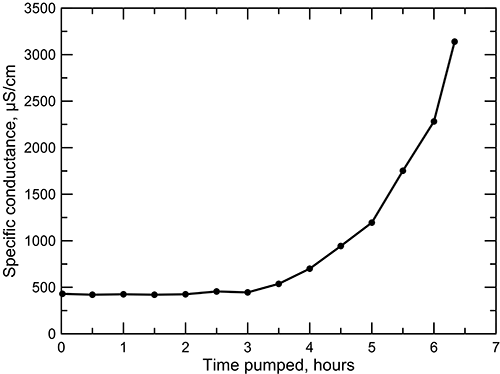
An example of the effect on groundwater quality of increasing salinity with depth and upward flow of saline water in valleys near the confined zone is shown by the increase in specific conductance during pumping of a well drilled for irrigation use in northwest Washington County during 2011 (fig. 26). The well was 200 ft (61 m) deep with a screened interval of 140-200 ft (43-61 m) and a casing diameter of 16 in (41 cm). A fine sandstone in the Dakota Formation extends between shale from 115 to 197 ft (35 to 60 m) (with shale strips at 120-140 ft [37-43 m]). The location is a few miles southeast of the extent of the confined Dakota aquifer and several miles southeast of the 500 mg/L TDS and 50 mg/L chloride concentration isolines for the upper Dakota aquifer (figs. 17 and 18). The well is sited approximately 200 ft (61 m) from a stream at an elevation of 10-15 ft (3-5 m) above the stream channel. The drawdown after two hours of pumping at 800 gpm (3.0 m3/min) was to a depth of 148 ft (45 m) below land surface from a static water level of 50 ft (15 m). The well was then pumped at 350 gpm (1.3 m3/min) for 6.3 hours and the conductivity of the water periodically measured (fig. 26). For the first three hours of pumping, the specific conductance remained below 1,000 µS/cm, indicating a very fresh water with about 300 mg/L TDS (fig. 15). After four hours of pumping, the conductance rapidly rose to more than 3,100 µS/cm (fig. 26). The KGS analyzed a sample collected at the end of the pumping; the conductance was 3,410 µS/cm, and the chloride and sulfate concentrations were 823 and 191 mg/L, respectively. Both the bromide/chloride and sodium/chloride ratios of this water indicate a natural saltwater source. The initial freshwater pumped by the well probably represented extraction of freshwater in the shallower portions of the sandstone interval in the Dakota. As the water level dropped in the well, a greater amount of groundwater was withdrawn from deeper in the sandstone interval, which contained saline water and increased the salinity of the mixture pumped from the well. The increase in salinity with depth in the Dakota at the location fits the mixing of subregional discharge of saline water in the stream valley with local recharge from precipitation. A 200 ft (61 m) borehole was drilled about 550 ft (170 m) to the east-southeast of the original well. A resistivity log in this borehole indicated increasing salinity of water starting about 120 ft (37 m). The borehole was plugged up to 140 ft and the well was completed with a screened interval of 60-140 ft (18-43 m). The original well was subsequently plugged up to a depth of 170 ft (52 m). Pumping of the original well at 150 gpm (0.57 m3/min) and the newer well at 600 gpm (2.3 m3/min) produced a sufficient quantity of freshwater for irrigation (E. Simms, personal communication).
Figure 26--Increase in salinity over time pumped of a 200 ft (61 m) deep well in the Dakota aquifer in northwest Washington County.
The substantially greater permeability of sandstone units within the Dakota aquifer in comparison with the shales can allow a faster rate of flushing of salinity by fresher regional flow. A general inverse correlation of the particle size of the Dakota sediments with TDS concentration in areas where some salinity exists, primarily in the confined aquifer (such as found in the test drilling of several wells near the City of Hays in Ellis County), means that substantial local differences can exist in both the vertical and areal distribution of water quality depending on the particular sandstone-to-shale ratio. Consequently, often the zones of higher permeability in the aquifer yield better quality water. In some locations where a thick and permeable sandstone receiving regional flow lies below low-permeability rocks in the Dakota aquifer, the water can be fresher in the sandstone than in the overlying, less-permeable units.
Although a general increase in salinity with depth occurs within subregions of the Dakota aquifer, differences in the geohydrology among subregions result in a wide-range of TDS concentrations with depth across the aquifer in Kansas. This is also true for concentrations of the major constituents, such as chloride and sulfate. However, a general decreasing trend in the (calcium + magnesium)/sodium ratio occurs with depth. This reflects higher values of the ratio for shallow groundwaters, which are often calcium, magnesium-bicarbonate in chemical type, in comparison with deeper waters that have undergone cation exchange of calcium and magnesium for sodium on clays during recharge and saltwater flushing by the fresher waters. The chemical signature of waters affected by the exchange process tends to occur more commonly in the confined aquifer. Recharge by freshwater occurs more easily in the unconfined aquifer, where substantial flows of recharge water have largely flushed out waters with a low (calcium + magnesium)/sodium ratio as the clays have lost their water softening capacity.
The greatest salinity changes with depth occur across substantial shale units with appreciable lateral extent that confine or separate aquifer units. Where the Graneros Shale is laterally continuous over miles (not isolated strata separated by multiple valleys), it can separate fresh or slightly saline water in the Greenhorn Limestone from very saline water (greater than 10,000 mg/L TDS) in the Dakota aquifer. Shales with a continuous lateral extent within the Dakota can also produce confined conditions in which saline waters are shielded from significant flushing by fresh recharge. Where the Kiowa Formation is mainly shale, it can separate saltwater in the Cheyenne Sandstone derived from underlying Permian strata from substantially less saline water in the overlying Dakota Formation.
In the confined aquifer, recharge passing through the overlying upper Cretaceous limestones and shales can have appreciably higher calcium, magnesium, and sulfate concentrations than in fresh to slightly saline portions of the upper Dakota aquifer. The water chemistry of samples collected during drilling of a test hole by the City of Hays in 1992 to explore water resources in the Dakota aquifer illustrates the changes with depth in these dissolved constituents as well as in the TDS, sodium, chloride, and fluoride concentrations in the aquifer groundwater (figs. 27-29). The test hole was located in southwest Ellis County above the western edge of where the Cedar Hills Sandstone directly underlies the Dakota aquifer and allows a greater rate of saltwater intrusion from the Permian to the Dakota aquifer base than where shales separate the strata. The depth interval for the Dakota Formation was 295-548 ft (90-167 m) in the test hole; the hole then penetrated the Kiowa Formation starting at 548 ft (167 m) before drilling was stopped at 595 ft (181 m). The lithology of the Dakota interval at the location is mainly siltstone and sandstone and that of the Kiowa Formation is siltstone and shale.
Figure 27--Depth profile of total dissolved solids concentration in the Dakota aquifer for samples collected during drilling of a test hole in Ellis County, Kansas.
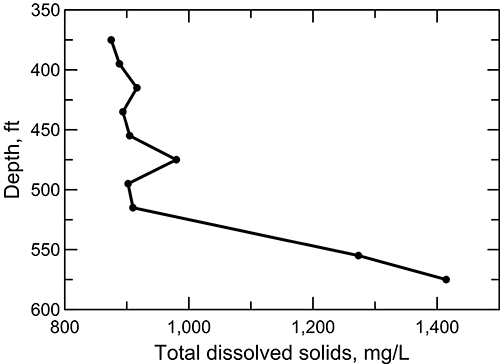
Figure 28--Depth profile of dissolved sodium, chloride, and sulfate concentrations in the Dakota aquifer for the same test hole in Ellis County as in fig. 27.
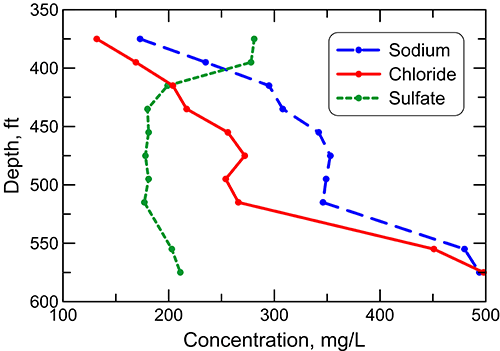
Figure 29--Depth profile of dissolved calcium, magnesium, and fluoride concentrations in the Dakota aquifer for the same test hole in Ellis County as in fig. 27.
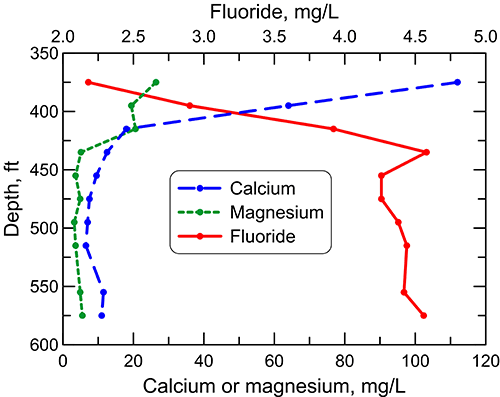
The TDS concentration of groundwater at the test-hole location generally increases by a relatively small amount in the upper to middle part of the siltstone and sandstone interval of the Dakota Formation, then increases markedly beginning just above the Kiowa Formation and continuing into the Kiowa (fig. 27). The sulfate content decreases in the uppermost part of the interval and then does not change substantially, whereas both the sodium and chloride concentrations increase in the upper portion, stabilize in the middle, and appreciably increase across the lower part of the interval (fig. 28). The calcium concentration decreases greatly and the magnesium content declines more moderately in the uppermost part of the Dakota Formation, followed by relatively small changes in the rest of the interval (fig. 29).
The fluoride concentration in the groundwater at the test-hole site follows a pattern with depth opposite to that of the calcium because the low calcium concentration within the aquifer waters allows fluoride-containing calcium minerals to dissolve (fig. 29). Fluoride is then expected to decrease with depth at the bottom of the Dakota aquifer and into Permian strata (below the interval shown in fig. 29) where calcium concentrations are much greater in more saline water, as indicated by data for saltwater-containing strata of the Dakota and Permian. The vertical changes in the constituent concentrations with depth in figs. 27-29 parallel the changes along the regional flow-path in the Dakota aquifer (figs. 24-25) from the recharge area near the southeast Colorado-southwest Kansas border to the saline water in the confined aquifer in central Kansas.
Prev Page--Water Use || Next Page--Development
Kansas Geological Survey, Geohydrology
Placed on web Nov. 6, 2014; originally published Fall 2014.
Comments to webadmin@kgs.ku.edu
The URL for this page is http://www.kgs.ku.edu/Publications/Bulletins/260/04_chem.html