![]()
Prev Page--Introduction || Next Page--Geochemistry
Location and Amount of Water Use
Prior estimates of the total amount of recoverable water from the Dakota aquifer, irrespective of quality, range from 500 to 700 million acre-ft (6.2 x 10¹¹ to 8.6 x 10¹¹ m3) (Crook, 1975; Helgeson et al., 1993). Keene and Bayne (1977) estimated that 70 to 80 million acre-ft (8.6 x 10¹⁰ to 9.9 x 10¹⁰ m3) of water containing less than 1,000 mg/L total dissolved solids (TDS) concentration and an additional 10 million to 15 million acre-ft (1.2 x 10¹⁰ to 1.8 x 10¹⁰ m3) containing 1,000 to 3,000 mg/L TDS could be obtained from this aquifer in Kansas. These estimates of recoverable groundwater in storage are based on limited information and regionalized estimates of drainable porosity and thickness of sandstone within the Dakota aquifer framework; they contain a wide range in uncertainty and may be substantially in error. Although sandstone porosity varies over a limited range and averages near 36%, total sandstone thickness ranges from less than 10% to more than 90% of the Dakota Formation thickness in Kansas. Furthermore, the amount of water released from the surrounding mudstones to the sandstones as leakage due to pumping is uncertain (Neuzil, 2002).
Groundwater from the Dakota aquifer is used for irrigation, stock, municipal, industrial, and domestic purposes. Development of the aquifer is limited primarily to areas where the groundwater is fresh or only slightly saline and where other more easily obtained water supplies, such as the High Plains and alluvial aquifers, are not available. Well yields depend on the ability of the aquifer to produce water as well as on the design and condition of the well and the pumping equipment. The most important hydrogeologic factors governing the potential yield are the thickness and lateral extent of the sandstone and its permeability, which depends on the properties of the sandstone matrix and the distribution of fractures. In general, because the sandstone is usually only fine- to medium-grained and cement (such as calcite and iron and manganese oxyhydroxides) may be present in pore spaces, the well yields are not as great as for the HPA. Reported well yields in the aquifer range widely from less than 10 to 2,000 gal/min (40 to 7,600 L/min) and are generally the highest in central and southwestern Kansas (Macfarlane, 1997a). In northern Ford and Hodgeman counties, yields reportedly exceed 1,000 gal/min (3,800 L/min) if the well is screened across thick intervals of permeable sandstone (Lobmeyer and Weakly, 1979). Farther north, where the aquifer strata outcrops in central and north-central Kansas, well yields generally range up to 600 gal/min (2,300 L/min). In northwest and west-central Kansas, use of the Dakota aquifer has been spotty or non-existent due to the more readily available and better quality near-surface water sources of the HPA.
Kansas statutes declare that all water within the state is "dedicated to the use of the people of the state, subject to the control and regulation of the state…" (Kansas State Statute 82a-702). Water may be appropriated for beneficial use subject to vested and existing senior water rights. These types of water appropriation or water rights are not required for "domestic" uses, although one can apply for a domestic-based water right. "Domestic" uses include household purposes, livestock as part of operating a farm (less than 1,000 confined head of cattle and less than 15 acre-ft [1,900 m3] of use), or irrigation over less than 2 acres (0.8 ha) (Kansas Department of Agriculture, 2011). Wells with water-right permits are mainly for larger capacity production for irrigation, industrial, municipal, large feedlots, and other purposes. The distribution of wells that have a water-right appropriation and produce part or all of their supply from the Dakota aquifer in Kansas is a good indicator of where and how much groundwater is used from the aquifer. The DWR collects and checks data on the location and reported annual water use for wells with appropriation rights. The DWR stores its water-right data in an Oracle-based relational data-base management system called the Water Rights Information System (WRIS). The KGS, in cooperation with the DWR, developed an online interactive website, called the Water Information Management and Analysis System or WIMAS, to query and analyze WRIS-based data (http://hercules.kgs.ku.edu/geohydro/wimas/index.cfm).
The Kansas Department of Health and Environment (KDHE) has required well drillers to file water-well-completion records (WWC-5 form) for all types of constructed, reconstructed, and plugged wells since 1975. The lithologic logs associated with the drillers' records can allow determination of which wells are completed entirely or partially in the Dakota aquifer. The KGS stores the drillers' logs and has developed an online interactive data base of the log information (http://www.kgs.ku.edu/Magellan/WaterWell/index.html). The KGS developed the online system called the Kansas Master Ground-water Well Inventory (http://hercules.kgs.ku.edu/geohydro/master_well/index.cfm), which indexes the water rights, drillers' logs, and depth-to-water data together. This allows water usage along with water-level changes to be associated with geologic sources when the data records are available.
These recent data-base and online systems developments, coupled with the use of geographic information system (GIS) data layers generated with ArcGIS (http://www.esri.com/software/arcgis/index.html) and viewed in ArcGIS Explorer (http://www.esri.com/software/arcgis/explorer/index.html), greatly facilitated determining the wells with water rights and the percentage of their yield from the Dakota aquifer. "Domestic" wells, which do not require water rights, are greater in number but produce much smaller amounts of water from the Dakota aquifer. The number of these wells was estimated for different regions of the Dakota aquifer using WWC-5 records and selected KGS county bulletins. The general procedures used for determinations of well locations and estimations of water use are described in the next sections; more detailed descriptions of the methods are in the appendix (http://www.kgs.ku.edu/Publications/Bulletins/260/appendix.html).
Wells with Water-Right Permits
Determination of Well Location and Water Use
The WRIS includes aquifer codes for most wells (points of diversion) that have groundwater rights. Aquifer codes include those for the Dakota Formation, Kiowa Formation, Cheyenne Sandstone, confined or unconfined Dakota aquifer, and combinations of the Dakota aquifer with alluvial or Ogallala aquifers. However, aquifer codes for many points of diversion are unknown or yet to be established. During the investigation of permitted wells that could produce from the Dakota aquifer, many wells with other aquifer codes (such as the Ogallala aquifer, a commonly used name for the western portion of the HPA) were found to also be partially completed in the Dakota aquifer based on WWC-5 records or well depths from annual water-use reports.
Only water-right-permitted wells located within the extent of the Dakota aquifer (fig. 2) were considered for this bulletin. Wells with logs were examined to determine whether the well produced partially or solely from the Dakota aquifer. Wells without logs located outside of the extents of the HPA and alluvial aquifers, but within the area of freshwater in the Dakota aquifer and where other wells were known to be in Dakota strata based on well logs, were assumed to be completed in the Dakota aquifer. WRIS records for some points of diversion (locations of water withdrawal) include reported well depths. These were used within the HPA extent to determine which wells were substantially deeper (>50 ft [15 m]) than the bedrock surface of Dakota strata directly underlying the HPA, or even deeper where overlying Upper Cretaceous rocks confining the Dakota aquifer form the HPA bedrock surface. Water-right data were extracted from WRIS during December 2011 and January 2012, essentially representing conditions just prior to 2012.
Information from WWC-5 records for the water-right-permitted wells was examined to estimate the percentage of the yield for each well. This information included the completed well depth, depths of the screened intervals and of grout seal, the top depth of Dakota units below overlying strata based on the lithologic log, the static water level, water levels after a pumping test, the relative permeabilities and thicknesses of lithologic units acting as aquifer units (e.g., sand, gravel, sandstone), and any other relevant information such as whether Dakota sandstone took water during drilling. For wells located outside the HPA extent, the location relative to the extent of the Dakota aquifer confined by overlying upper Cretaceous strata and the salinity of water in the upper Dakota aquifer were also considered. For wells located within the HPA extent, an interpolated depth-to-bedrock surface (source data from Macfarlane and Wilson, 2006) at the well location was used to assist in interpretation of the lithologic log if the log description did not clearly indicate the HPA-Dakota strata contact. After determining whether a well was screened in both the Dakota aquifer and overlying unconsolidated sediment, the approximate depth of the static water level expected during the winters of the several years before 2012 was compared to that for the contact between Dakota and overlying strata. For those wells that were completed before this recent period, the static water level was estimated based on values for nearby wells with recent WWC-5 records or on depth-to-water measurements in the online KGS data base WIZARD (http://www.kgs.ku.edu/Magellan/WaterLevels/index.html). The WWC-5 or WIZARD water level was used to determine the thickness of the saturated HPA contributing to the well yield relative to the sandstone thickness of the Dakota aquifer contributing to the yield.
Some of the wells with Dakota aquifer codes in WRIS records were found to have been drilled into but not screened in the Dakota aquifer. Many wells with only WRIS codes for other aquifers above the Dakota aquifer were found to be completed partially in Dakota strata. A few of these wells were determined to produce essentially all (>95%) of their yield from the Dakota aquifer because the recent static water level was near, at, or below the contact between the Dakota and overlying unconsolidated aquifer.
A percent yield from the Dakota aquifer was assigned to each well based on the estimated relative contribution of the Dakota strata to the total well yield. If the percentage was less than 5%, the contribution of the Dakota aquifer to the well yield was assumed to be insignificant and the well was not designated as producing from the Dakota. If the yield was estimated as >95%, the well was designated as producing entirely from the Dakota aquifer. The accuracy of the values depends on the quality of the lithologic logs, the interpretation of the logs and other data, and the assumption of relative hydraulic conductivities for the different strata. The estimated uncertainty in the percentages is probably ±10% for the 10-20% and 80-90% ranges and ±20% for the 30-70% range for most of the wells with logs.
Wells coded in WRIS as solely in Dakota units or in a combination of Dakota and other aquifers but without WWC-5 records were assigned a percent yield based on the percent yields of surrounding wells with well logs. Reported depths, if available, were used to assist in this estimation. Likewise, a percent yield from the Dakota aquifer was estimated for wells without logs that were coded as other aquifers or that had no aquifer code but that had depths greater than 50 ft (15 m) below the HPA bedrock surface, based on percentages from surrounding wells with logs. The uncertainty in the percent Dakota for these wells is expected to be substantially greater than that for the wells with well logs. Although some of the wells to which a portion of the yield was assigned to the Dakota may have substantially less or even no significant Dakota yield, this is probably offset by other wells that could have some yield from the Dakota but that were not identified based on the above procedure and available information. This would be the case for those wells that have reported depths less than 50 ft (15 m) below the actual bedrock surface but that are also screened in sandstone and for wells completed to a depth of greater than 50 ft (15 m) below the actual HPA bedrock surface in areas where local contours in the bedrock surface map of Macfarlane and Wilson (2006) are deeper than actual.
The procedure also would have missed wells that produce partially or solely from the Dakota aquifer within productive parts of the HPA if they had no well logs or reported well depths. USGS and KGS reports on sandstone aquifers in southwest Kansas and KGS bulletins on the geohydrology of selected counties, which were published during the mid-1960s to mid-1980s, were examined for records of wells producing primarily or partially from the Dakota aquifer. These records were compared to the list obtained by the above procedures and to WRIS and WWC-5 records; more than a dozen Dakota-producing wells were added to the list based on this additional review.
The water use from the Dakota aquifer for each year from 1990 to 2010 was then determined by multiplying the assigned Dakota yield percentage associated with each well by the water use reported for that year. This total Dakota water use is expected to be conservative given some use was probably missed for wells that produced from the Dakota aquifer but that were replaced, moved, or became inactive sometime during 1990-2010. Only wells with active, non-dismissed water rights at the time of the WRIS download were considered for this bulletin. In addition, only irrigation, stock, municipal, industrial, domestic, and recreational uses were considered; two dewatering wells in the Dakota aquifer in Ellsworth County were not included in the use totals.
Distribution of Wells
A total of 2,237 wells with active water rights and uses as of the end of 2011 were determined to produce greater than 5% of their total yield from the Dakota aquifer (table 1, fig. 3). This included about two dozen wells with pending water use; these wells are too new to have reported water use for 2010, the latest year of reported water use available to the public at the time of preparation of this bulletin. Most of the Dakota wells are located in southwest Kansas where the Dakota aquifer directly underlies the HPA. The remaining Dakota wells are distributed for the most part within the outcrop/subcrop area of the Dakota aquifer from north-central, through central, to south-central Kansas (fig. 3). Wells in west-central Kansas produce only from the confined Dakota aquifer.
Table 1--Number of water-right-permitted wells that draw all or part of their yield from the Dakota aquifer and percent of total well yield from the Dakota aquifer.
| County | Total wells |
Estimated percentage of total well yield from Dakota aquifer | ||||||||||
|---|---|---|---|---|---|---|---|---|---|---|---|---|
| 100% | 90% | 80% | 70% | 60% | 50% | 40% | 30% | 20% | 10-15% | Mean % | ||
| North-central Kansas | ||||||||||||
| Clay | 12 | 12 | 100 | |||||||||
| Cloud | 110 | 108 | 1 | 1 | 99.1 | |||||||
| Ottawa | 63 | 51 | 1 | 4 | 2 | 1 | 2 | 1 | 3 | 91.9 | ||
| Republic | 13 | 13 | 100 | |||||||||
| Washington | 173 | 173 | 100 | |||||||||
| Region total | 371 | 357 | 1 | 3 | 2 | 1 | 2 | 1 | 4 | 98.4 | ||
| Central Kansas | ||||||||||||
| Barton | 21 | 17 | 1 | 2 | 1 | 84.8 | ||||||
| Ellis | 16 | 16 | 100 | |||||||||
| Ellsworth | 42 | 30 | 12 | 94.3 | ||||||||
| Lincoln | 6 | 6 | 100 | |||||||||
| Marion | 10 | 10 | 100 | |||||||||
| McPherson | 15 | 15 | 100 | |||||||||
| Rice | 61 | 49 | 6 | 1 | 4 | 1 | 94.9 | |||||
| Rush | 8 | 7 | 1 | 91.2 | ||||||||
| Russell | 2 | 2 | 100 | |||||||||
| Saline | 29 | 29 | 100 | |||||||||
| Region total | 210 | 181 | 6 | 13 | 4 | 3 | 2 | 1 | 95.5 | |||
| South-central Kansas | ||||||||||||
| Edwards | 16 | 5 | 7 | 3 | 1 | 87.5 | ||||||
| Pawnee | 66 | 30 | 6 | 1 | 4 | 19 | 4 | 2 | 69.2 | |||
| Region total | 82 | 35 | 13 | 1 | 7 | 1 | 19 | 4 | 2 | 72.8 | ||
| West-central Kansas | ||||||||||||
| Lane | 3 | 3 | 100 | |||||||||
| Ness | 4 | 4 | 100 | |||||||||
| Scott | 8 | 8 | 100 | |||||||||
| Trego | 3 | 3 | 100 | |||||||||
| Wichita | 1 | 1 | 100 | |||||||||
| Region total | 19 | 19 | 100 | |||||||||
| Southwest Kansas | ||||||||||||
| Clark | 9 | 8 | 1 | 27.8 | ||||||||
| Finney | 47 | 17 | 3 | 1 | 1 | 4 | 5 | 16 | 52.6 | |||
| Ford | 104 | 58 | 9 | 2 | 6 | 7 | 3 | 4 | 5 | 3 | 7 | 78.9 |
| Grant | 290 | 6 | 5 | 15 | 28 | 13 | 31 | 25 | 80 | 48 | 39 | 38.9 |
| Gray | 51 | 7 | 1 | 2 | 3 | 3 | 3 | 2 | 10 | 6 | 14 | 41.9 |
| Hamilton | 131 | 96 | 18 | 2 | 6 | 6 | 2 | 1 | 92.9 | |||
| Haskell | 230 | 1 | 1 | 1 | 7 | 4 | 10 | 17 | 68 | 58 | 63 | 25.9 |
| Hodgeman | 56 | 41 | 1 | 2 | 1 | 1 | 8 | 1 | 1 | 84.1 | ||
| Kearny | 84 | 4 | 5 | 6 | 8 | 20 | 20 | 21 | 30.3 | |||
| Meade | 7 | 1 | 1 | 2 | 3 | 20.0 | ||||||
| Morton | 138 | 31 | 8 | 8 | 21 | 3 | 21 | 5 | 13 | 10 | 18 | 58.9 |
| Seward | 30 | 1 | 2 | 2 | 5 | 20 | 17.3 | |||||
| Stanton | 307 | 40 | 21 | 28 | 49 | 22 | 43 | 26 | 38 | 30 | 10 | 58.2 |
| Stevens | 71 | 1 | 1 | 3 | 8 | 19 | 19 | 20 | 25.2 | |||
| Region total | 1,555 | 300 | 68 | 59 | 123 | 59 | 127 | 99 | 279 | 207 | 234 | 50.3 |
| Regions total | 2,237 | 893 | 87 | 76 | 132 | 65 | 129 | 100 | 305 | 213 | 237 | 63.8 |
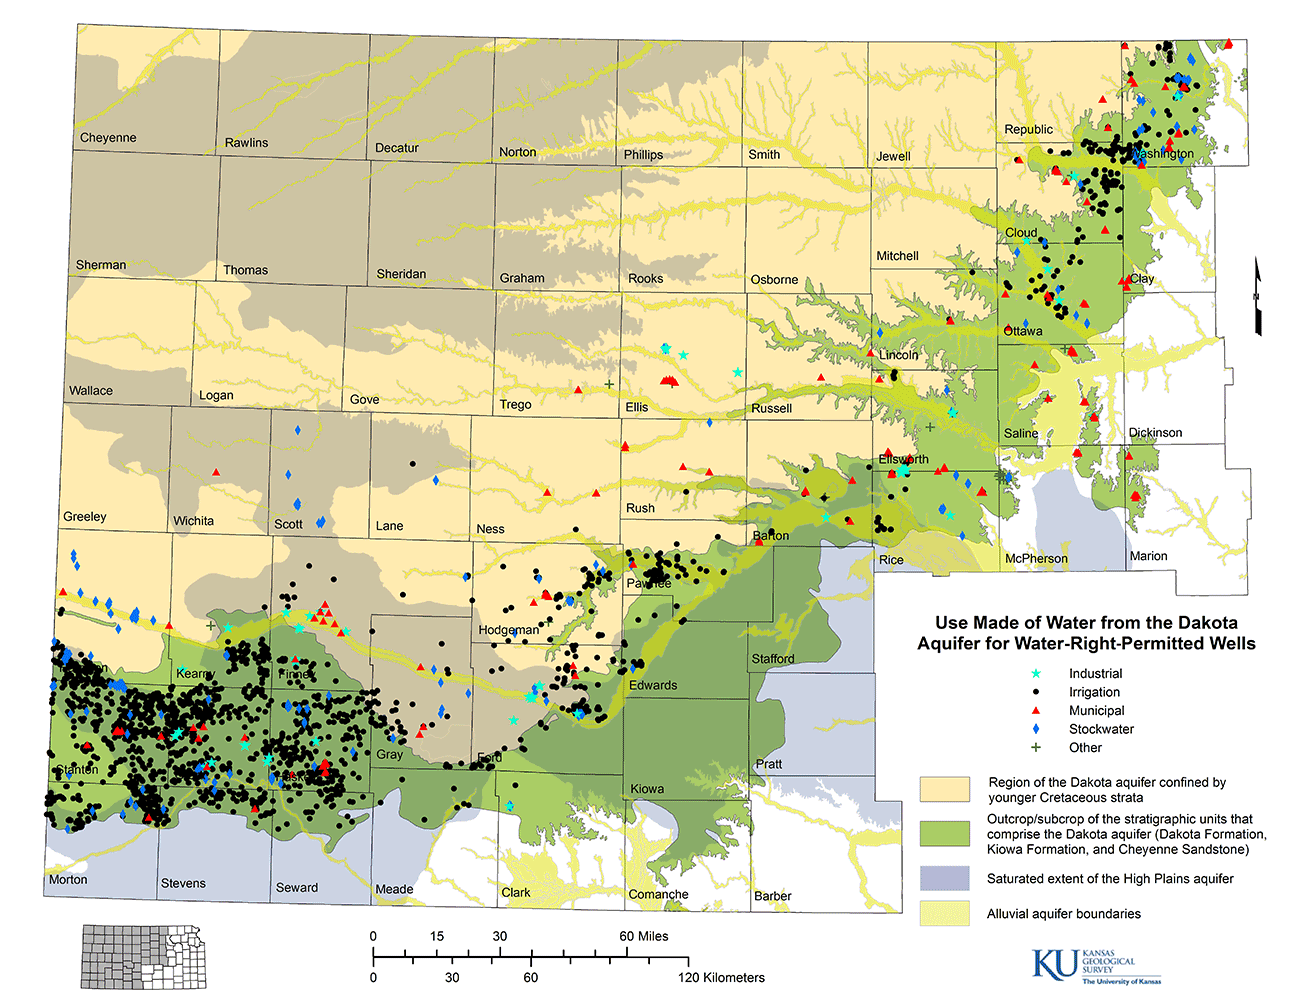
Figure 3--Distribution of wells producing partially or entirely from the Dakota aquifer according to percent of total yield that is from the Dakota system.

Of the 581 Dakota wells located in north-central and central Kansas, 538 (about 93%) produce all (or greater than 95%) of their yield from the Dakota aquifer (table 1). Washington and Cloud counties have the largest number of Dakota wells in these two regions. In Pawnee and Edwards counties, about 43% of the wells with Dakota production pump essentially only from the Dakota; the rest pump primarily from overlying alluvial aquifers. Only 19% of the wells that include the Dakota in southwest Kansas produce solely from the Dakota aquifer (and underlying Morrison-Dockum aquifer, if present); most of these are located in the three westernmost counties (Hamilton, Stanton, and Morton counties) and two of the easternmost counties (Ford and Hodgeman counties) in the region. A total of 609 (39%) of the 1,555 Dakota wells in southwest Kansas produce more than 50% of their yield from the Dakota aquifer; 946 wells pump 50% or more of their yield from other aquifers (nearly all of which is from the HPA). The average well that draws at least part of its water from the Dakota aquifer produces about half of its total yield from the Dakota in southwest Kansas in comparison with greater than 95% for the average Dakota well in north-central and central Kansas. In general, the greater the saturated thickness of the HPA in southwest Kansas, the smaller the percentage of the yield from the Dakota aquifer in those wells that obtain part of their supply from the Dakota (fig 3).
In the 36 counties in which water-right-permitted wells pump all or part of their supply from the Dakota aquifer, the Dakota wells are estimated to comprise 9% of the total wells with water-right permits that are completed in all aquifers (table 2). North-central Kansas has the greatest percentage of wells (about 22%) with Dakota production of any region in which water is pumped from the Dakota aquifer. Nearly two-thirds of all of the water-right-permitted wells in Washington County in this region draw water from the Dakota aquifer. Although only about 6% of all permitted wells in central Kansas pump water from the Dakota aquifer, more than half of the wells in Ellsworth County produce partially or solely from Dakota strata. The percentage of water-right-permitted wells that pump part or all of their water from the Dakota aquifer ranges substantially in southwest Kansas, from less than 1% in Meade County to more than 25% in Grant, Hamilton, Morton, and Stanton counties. The distribution of wells in fig. 3 shows that a major factor determining whether a county has a large percentage of wells pumping partially or solely from the Dakota is the proportion of the county that is underlain by the outcrop/subcrop extent of the aquifer.
Table 2--Number of water-right-permitted wells that draw all or part of their yield from the Dakota aquifer by water-use type and comparison to total number of water-right-permitted wells completed in all aquifers.
| County or region | Number of partial or sole Dakota wells | Total wells, all aquifers |
% Dakota wells |
|||||
|---|---|---|---|---|---|---|---|---|
| Irrigation | Stock | Municipal | Industrial | Other | Total | |||
| North-central Kansas | ||||||||
| Clay | 12 | 12 | 334 | 3.6 | ||||
| Cloud | 95 | 2 | 10 | 2 | 1 | 110 | 446 | 24.7 |
| Ottawa | 39 | 10 | 12 | 2 | 63 | 178 | 35.4 | |
| Republic | 7 | 6 | 13 | 439 | 3.0 | |||
| Washington | 92 | 45 | 27 | 6 | 3 | 173 | 268 | 64.6 |
| Region total | 233 | 57 | 67 | 10 | 4 | 371 | 1,665 | 22.3 |
| Central Kansas | ||||||||
| Barton | 8 | 10 | 1 | 2 | 21 | 752 | 2.8 | |
| Ellis | 6 | 6 | 3 | 1 | 17 | 307 | 5.2 | |
| Ellsworth | 15 | 5 | 15 | 6 | 1 | 42 | 84 | 53.2 |
| Lincoln | 2 | 2 | 2 | 6 | 47 | 12.8 | ||
| Marion | 10 | 10 | 134 | 7.5 | ||||
| McPherson | 4 | 3 | 8 | 15 | 673 | 2.2 | ||
| Rice | 30 | 13 | 10 | 7 | 1 | 61 | 618 | 10.0 |
| Rush | 1 | 1 | 6 | 8 | 447 | 1.8 | ||
| Russell | 2 | 2 | 51 | 3.9 | ||||
| Saline | 2 | 25 | 2 | 29 | 273 | 10.6 | ||
| Region total | 58 | 31 | 89 | 17 | 15 | 210 | 3,368 | 6.2 |
| South-central Kansas | ||||||||
| Edwards | 15 | 1 | 16 | 1,155 | 1.4 | |||
| Pawnee | 63 | 1 | 2 | 66 | 1,172 | 5.6 | ||
| Region total | 78 | 2 | 2 | 0 | 0 | 82 | 2,327 | 3.5 |
| West-central Kansas | ||||||||
| Lane | 1 | 2 | 3 | 308 | 1.0 | |||
| Ness | 1 | 3 | 4 | 216 | 1.9 | |||
| Scott | 8 | 8 | 1,115 | 0.72 | ||||
| Trego | 2 | 1 | 3 | 264 | 1.1 | |||
| Wichita | 1 | 1 | 1,149 | 0.09 | ||||
| Region total | 2 | 10 | 6 | 0 | 1 | 19 | 3,051 | 0.62 |
| Southwest Kansas | ||||||||
| Clark | 1 | 8 | 9 | 116 | 7.8 | |||
| Finney | 32 | 1 | 7 | 7 | 47 | 2,456 | 1.9 | |
| Ford | 85 | 10 | 2 | 7 | 104 | 1,242 | 8.4 | |
| Grant | 272 | 7 | 4 | 7 | 290 | 975 | 29.8 | |
| Gray | 41 | 7 | 3 | 51 | 2,032 | 2.5 | ||
| Hamilton | 90 | 37 | 4 | 131 | 425 | 30.8 | ||
| Haskell | 209 | 14 | 7 | 230 | 1,392 | 16.5 | ||
| Hodgeman | 44 | 8 | 3 | 1 | 56 | 579 | 9.7 | |
| Kearny | 76 | 4 | 2 | 2 | 84 | 1,166 | 7.2 | |
| Meade | 7 | 7 | 818 | 0.86 | ||||
| Morton | 131 | 7 | 138 | 540 | 25.6 | |||
| Seward | 30 | 30 | 861 | 3.5 | ||||
| Stanton | 292 | 9 | 6 | 307 | 966 | 31.7 | ||
| Stevens | 69 | 2 | 71 | 1,122 | 6.3 | |||
| Region total | 1,379 | 114 | 36 | 23 | 3 | 1,555 | 14,687 | 10.6 |
| Regions total | 1,750 | 214 | 200 | 50 | 23 | 2,237 | 25,098 | 8.9 |
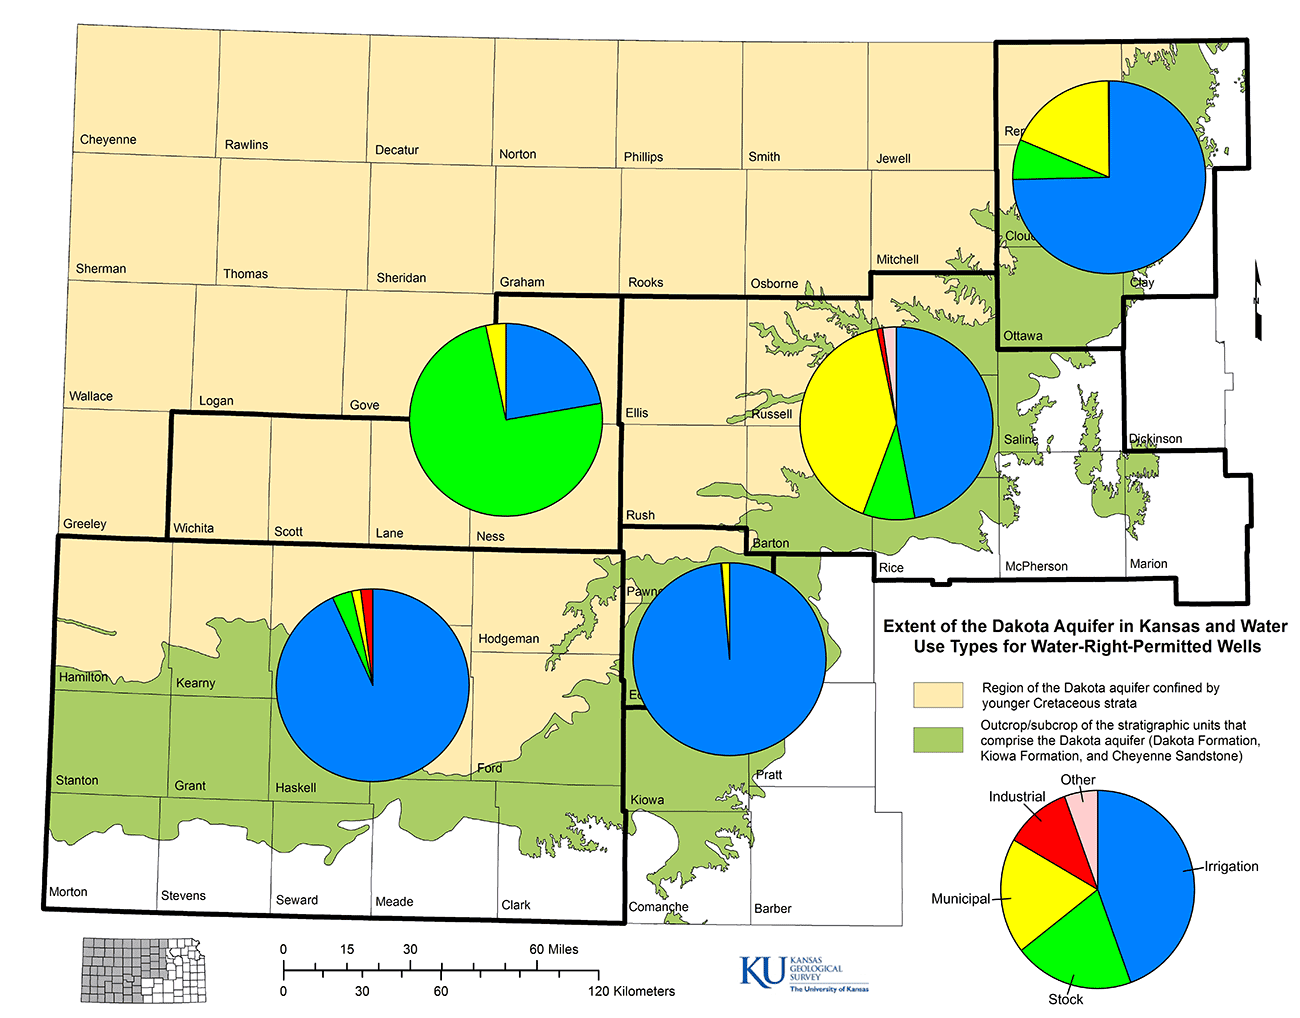
Most (78%) of the water-right-permitted wells that draw part or all of their water from the Dakota aquifer are used for irrigation (table 2, fig. 4). The second most common use of water made from permitted wells in the Dakota aquifer is for stock (9.6% of the total Dakota wells) followed closely by municipal purposes (8.9% of Dakota wells). Industrial wells account for about 2.2% of water-right-permitted wells completed partially or solely in the Dakota, and domestic and recreational wells ("Other" in table 2) are only about 1% of the total. The percentage of the total number of partial or sole Dakota wells that are used for irrigation ranges from about 10% in west-central, to 28% in central, 63% in north-central, 89% in southwest, and 95% in south-central Kansas. Municipal wells comprise a larger percentage of the total number of partial or sole Dakota aquifer wells in central (42%), west-central (32%), and north-central (18%) Kansas than in south-central (2.4%) and southwest Kansas (2.3%).
Figure 4--Distribution of water-right-permitted wells that draw part or all of their yield from the Dakota aquifer according to use type.
Estimated Water Use
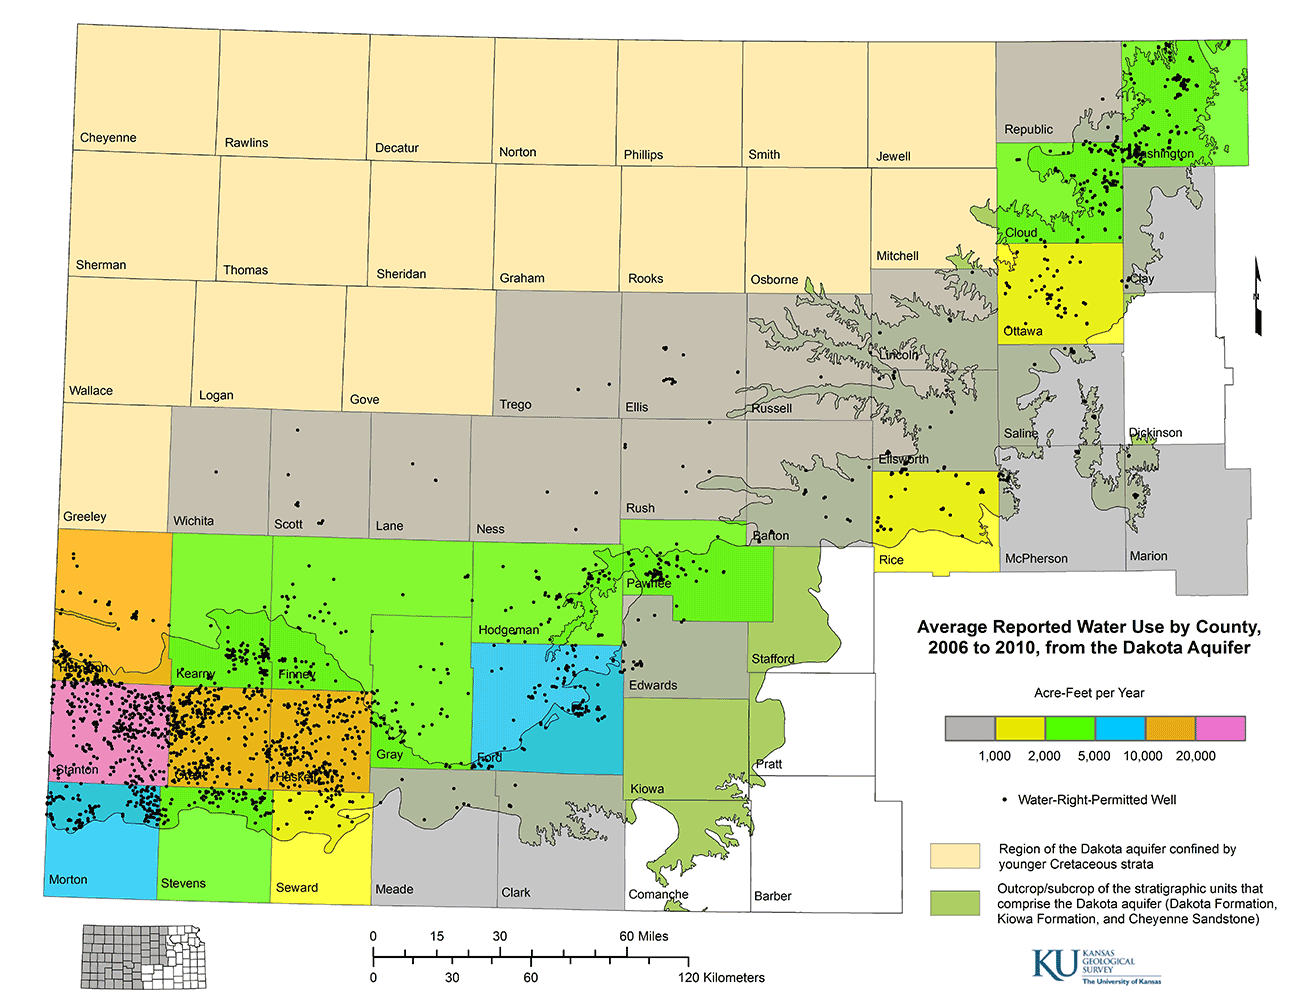
The average total volume of water used from the Dakota aquifer by water-right-permitted wells in Kansas is estimated to be 117,000 acre-ft/yr (1.44 x 10⁸ m3/yr) for the 5-yr period 2006-2010 (table 3). The estimated mean annual use is much greater in southwest Kansas (approximately 86% of the total Dakota aquifer use) than in the other regions. The mean annual use for the other regions ranges from approximately 0.5% of the total Dakota use for west-central Kansas to 2.4% for central, 2.9% for south-central, and 8.1% for north-central Kansas. The density of the mean annual use for 2006-2010 (fig. 5) indicates local areas of high use from southwest Hamilton through northern Stanton into northwest Grant counties. Other localities of high use are in northeast Morton, the southeast corner of Stanton, south-central Haskell, central Ford, southwest Pawnee, and southwest Washington counties. The county with the greatest estimated annual use from the Dakota aquifer is Stanton County, followed in order of decreasing use by Grant, Hamilton, and Haskell counties (table 3, fig. 6). The mean use density for 2006-2010 did not change substantially from earlier 5-yr averages (1990-1995, 1996-2000, 2001-2005; see online appendix, http://www.kgs.ku.edu/Publications/Bulletins/260/appendix.html). The main apparent differences are slightly larger or smaller areas of high use and the appearance or disappearance of individual wells in areas of few wells (mainly in the confined aquifer) from period to period.
Table 3--Estimated mean annual water use during 2006-2010 from the Dakota aquifer by water-right-permitted wells for different use types, and total use from all aquifers.
| County or region | Mean annual water use during 2006-2010, acre-ft/yr | % Dakota use |
||||||
|---|---|---|---|---|---|---|---|---|
| Use from Dakota aquifer | Total use all aquifers |
|||||||
| Irrigation | Stock | Municipal | Industrial | Other | Total | |||
| North-central Kansas | ||||||||
| Clay | 163 | 163 | 10,950 | 1.5 | ||||
| Cloud | 3,560 | 19.6 | 613 | 0.0 | 0.0 | 4,190 | 13,010 | 32.2 |
| Ottawa | 823 | 146 | 157 | 7.3 | 1,130 | 2,496 | 45.4 | |
| Republic | 154 | 2.4 | 157 | 17,080 | 0.92 | |||
| Washington | 2,500 | 469 | 810 | 1.2 | 3.2 | 3,780 | 4,509 | 83.8 |
| Region total | 7,030 | 634 | 1,740 | 8.5 | 3.2 | 9,420 | 48,050 | 19.6 |
| Central Kansas | ||||||||
| Barton | 52 | 75.1 | 0.0 | 64.8 | 192 | 36,640 | 0.52 | |
| Ellis | 71.9 | 83.7 | 2.7 | 0.0 | 158 | 4,113 | 3.8 | |
| Ellsworth | 365 | 14.4 | 215 | 0.0 | 594 | 2,571 | 23.1 | |
| Lincoln | 0.23 | 14.4 | 27.8 | 42.4 | 544 | 7.8 | ||
| Marion | 133 | 133 | 999 | 13.3 | ||||
| McPherson | 103 | 33.5 | 0.0 | 136 | 32,930 | 0.41 | ||
| Rice | 909 | 40.0 | 134 | 24.7 | 0.0 | 1,108 | 22,470 | 4.9 |
| Rush | 8.5 | 5.5 | 79.9 | 94 | 8,509 | 1.1 | ||
| Russell | 17.6 | 17.6 | 112 | 15.7 | ||||
| Saline | 7.2 | 375 | 1.8 | 384 | 6,014 | 6.4 | ||
| Region total | 1,340 | 249 | 1,170 | 27.4 | 66.6 | 2,860 | 114,900 | 2.5 |
| South-central Kansas | ||||||||
| Edwards | 616 | 3.0 | 619 | 105,700 | 0.59 | |||
| Pawnee | 2,780 | 1.9 | 45.6 | 2,820 | 66,670 | 4.2 | ||
| Region total | 3,390 | 4.9 | 45.6 | 3,440 | 172,400 | 2.0 | ||
| West-central Kansas | ||||||||
| Lane | 101 | 35.8 | 136 | 17,140 | 0.80 | |||
| Ness | 29.4 | 16.2 | 45.6 | 3,770 | 1.2 | |||
| Scott | 399 | 399 | 51,800 | 0.77 | ||||
| Trego | 3.6 | 0.0 | 3.6 | 5,959 | 0.06 | |||
| Wichita | 0.0 | 0.0 | 61,170 | 0.0 | ||||
| Region total | 130 | 435 | 19.8 | 0.0 | 585 | 139,800 | 0.42 | |
| Southwest Kansas | ||||||||
| Clark | 18.2 | 32.2 | 50.4 | 5,591 | 0.90 | |||
| Finney | 828 | 4.0 | 615 | 722 | 2,170 | 302,700 | 0.72 | |
| Ford | 6,840 | 528 | 41.4 | 1,240 | 8,660 | 106,300 | 8.1 | |
| Grant | 18,000 | 48.0 | 94.4 | 34.0 | 18,200 | 133,400 | 13.6 | |
| Gray | 1,810 | 333 | 260 | 2,400 | 213,100 | 1.1 | ||
| Hamilton | 13,100 | 1,340 | 41.7 | 14,400 | 38,940 | 37.1 | ||
| Haskell | 10,700 | 229 | 104 | 0.6 | 11,000 | 215,900 | 5.1 | |
| Hodgeman | 1,960 | 183 | 110 | 2.9 | 2,260 | 23,770 | 9.5 | |
| Kearny | 3,920 | 14.3 | 16.2 | 3.1 | 3,960 | 144,100 | 2.7 | |
| Meade | 283 | 283 | 172,700 | 0.16 | ||||
| Morton | 6,600 | 214 | 6,820 | 47,880 | 14.2 | |||
| Seward | 1,200 | 1,200 | 176,700 | 0.68 | ||||
| Stanton | 25,100 | 374 | 267 | 25,800 | 127,100 | 20.3 | ||
| Stevens | 3,400 | 18.1 | 3,420 | 228,100 | 1.5 | |||
| Region total | 93,700 | 3,320 | 1,530 | 2,020 | 5.9 | 100,600 | 1,936,300 | 5.2 |
| Regions total | 105,600 | 4,640 | 4,520 | 2,050 | 75.8 | 116,900 | 2,411,500 | 4.8 |
Figure 5--Density of estimated average annual use of groundwater from the Dakota aquifer in Kansas for 2006-2010.
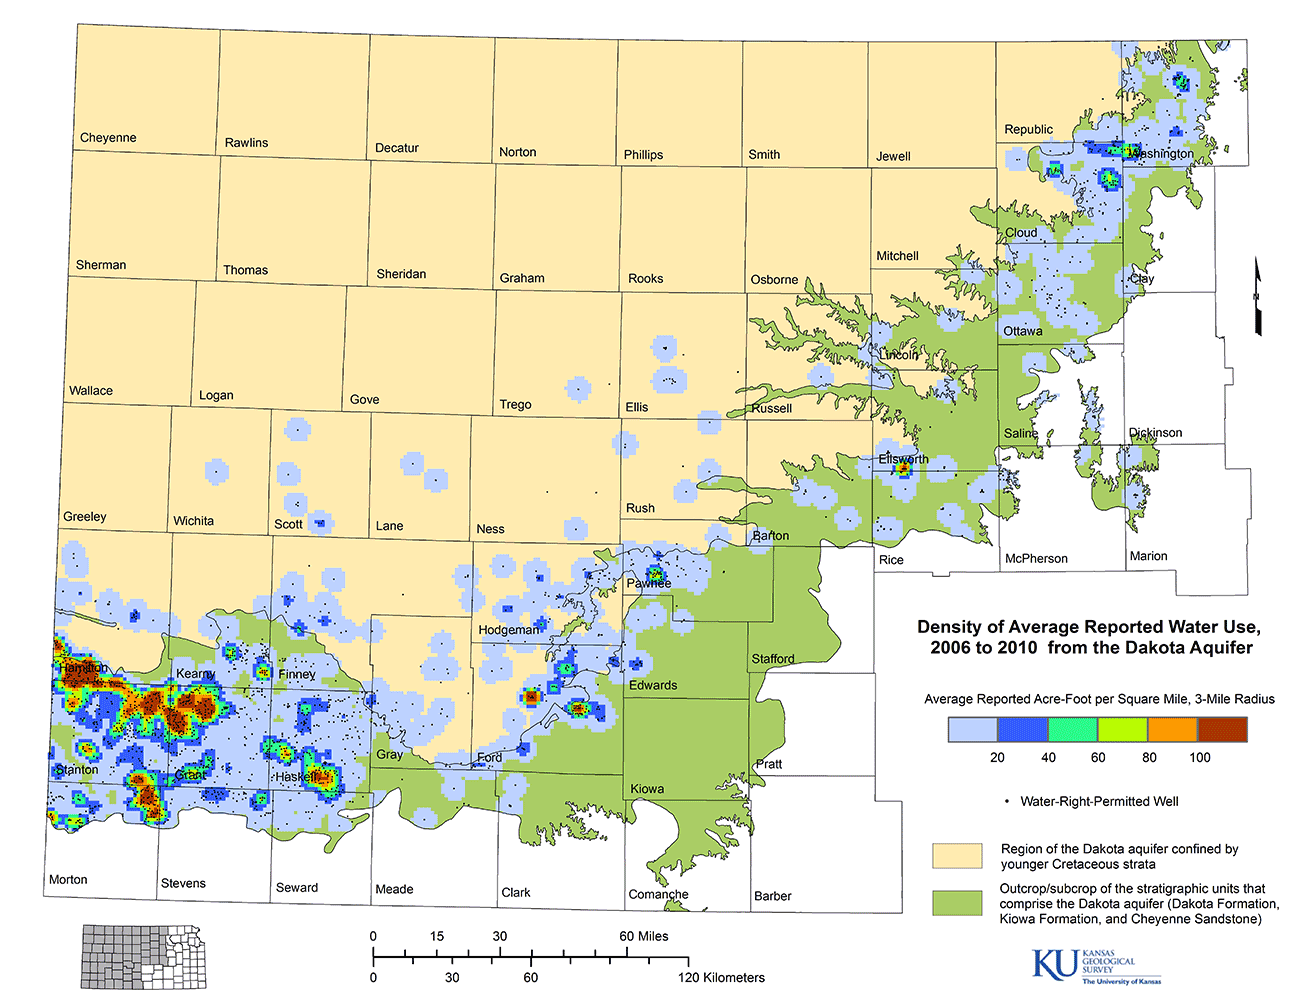
Figure 6--Estimated average annual use of groundwater from the Dakota aquifer by counties in Kansas for 2006-2010.
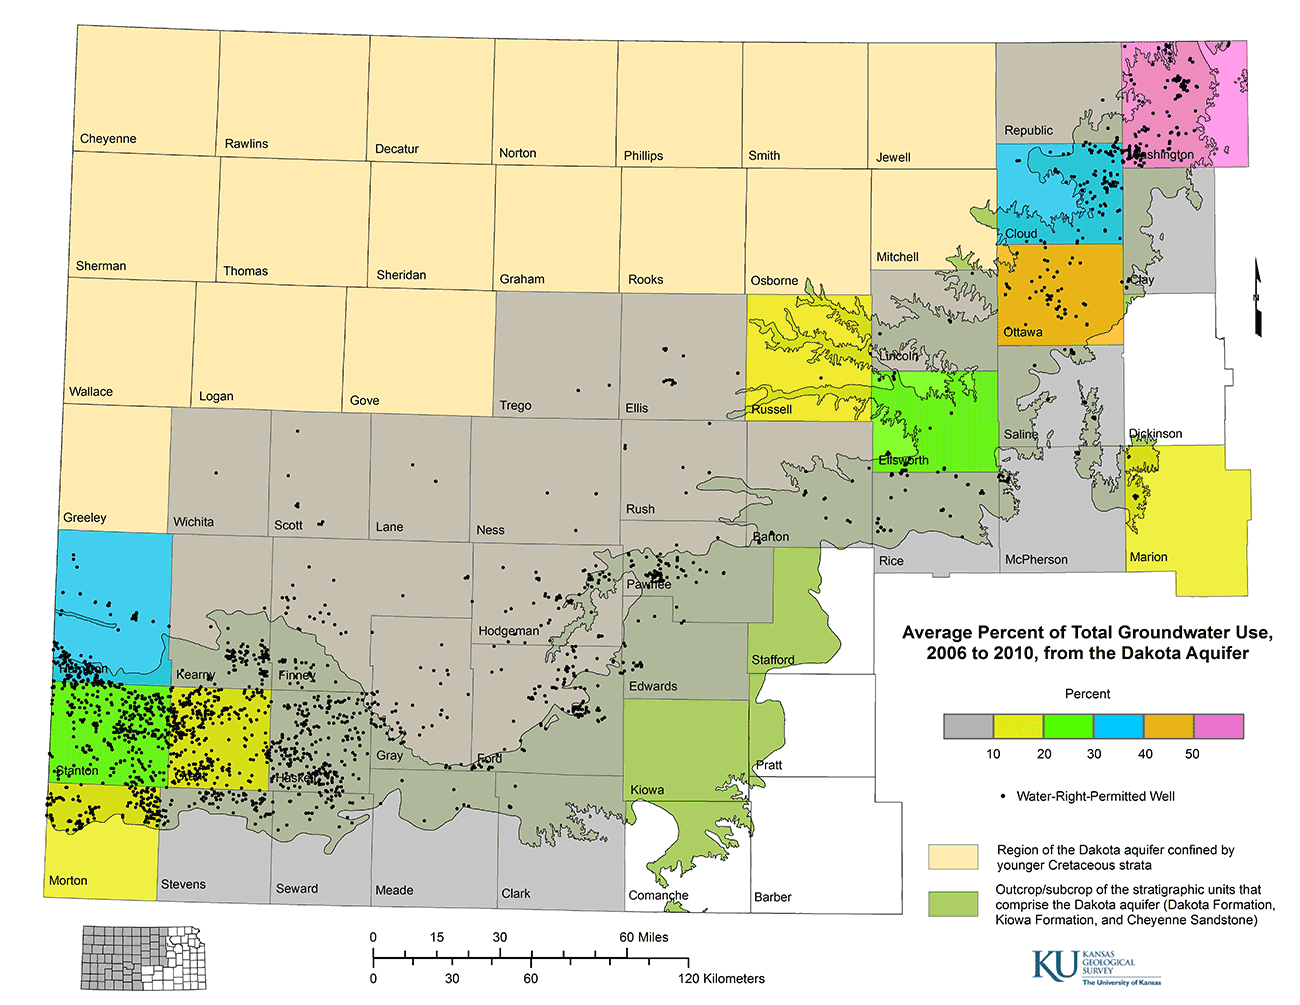
Water pumped from the Dakota aquifer by water-right-permitted wells during 2006-2010 was about 5% of the total water pumped from all aquifers in the 36 counties with Dakota use (table 3). Percentage of Dakota use compared to total use from all aquifers is also displayed by county in fig. 7. Although Washington County has the ninth highest average use rate of the 36 counties that produce water from the Dakota aquifer, it has the highest percentage of estimated Dakota use compared to total groundwater use (approximately 84%). The county with the next highest percentage Dakota use relative to the total groundwater pumped is Ottawa (45%), followed by Hamilton (37%) and Cloud (32%) counties. The Dakota aquifer supplies more than 20% of the total groundwater used in Ellsworth and Stanton counties and more than 10% of the total groundwater used in Russell, Morton, Grant, and Marion counties (in decreasing order).
Figure 7--Average percent of total annual use of groundwater from all aquifers for 2006-2010 estimated to be from the Dakota aquifer.
About 90% of the total mean annual use from the Dakota aquifer during 2006-2010 was for irrigation (table 3). The use ratios for stock and municipal purposes were about the same; each comprised nearly 4% of the total volume pumped from the Dakota aquifer. The mean annual use for industrial and other applications (domestic and recreational) accounted for less than 2% and 0.1% of the total Dakota water pumped, respectively. The mean percentage of annual water use during 2006-2010 for various purposes is shown in table 3 and fig. 8 for different regions of Kansas. Irrigation was the dominant use of water in south-central and southwest Kansas (99% and 93%, respectively) and was about 75% of the total annual use from the Dakota aquifer in north-central Kansas. The greatest percentage of municipal use occurred in central and north-central Kansas (41% and 18%, respectively, of the total annual use from the Dakota aquifer for these two regions). Stock use accounted for most (74%) of the Dakota water pumped annually from west-central Kansas.
Figure 8--Mean 2006-2010 percentage of water use from the Dakota aquifer for different types of water-right-permitted wells drawing part or all of their supply from the Dakota aquifer in different regions of Kansas.
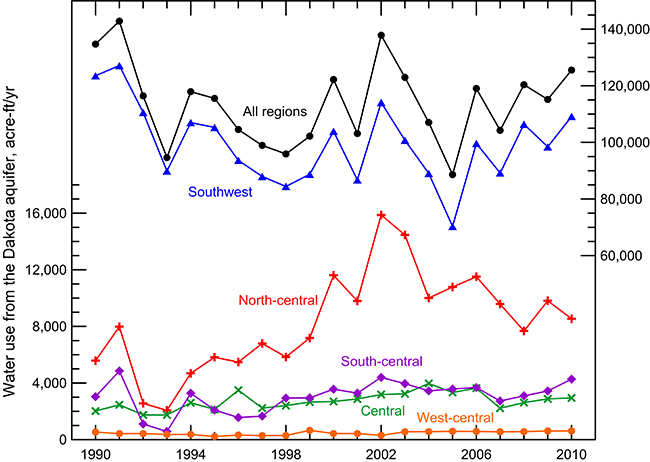
The annual water use from the Dakota aquifer varied substantially across regions in Kansas during 1990-2010, the period for which water reports have been verified by state-sponsored programs for water-use quality control (fig. 9). The total change in the annual use for all regions parallels the use in southwest Kansas because water use from the Dakota aquifer in this region is approximately seven times the annual use for all of the other regions combined. The fluctuation in the total annual use from the Dakota aquifer in Kansas during 1990-2010 ranged from -22% to 26% (minimum to maximum, respectively, relative to the mean). The percent fluctuation was greatest in north-central Kansas (-75% to 92% of the mean) and the least in southwest Kansas (-29% to 28% of the mean). The use from the Dakota aquifer in north-central Kansas peaked in 2002 and has declined since then, which is in contrast with the other regions, where the use has generally been more stable, if not slightly increasing.
Figure 9--Estimated annual use of groundwater from the Dakota aquifer in Kansas and in different regions of Kansas from 1990 to 2010.
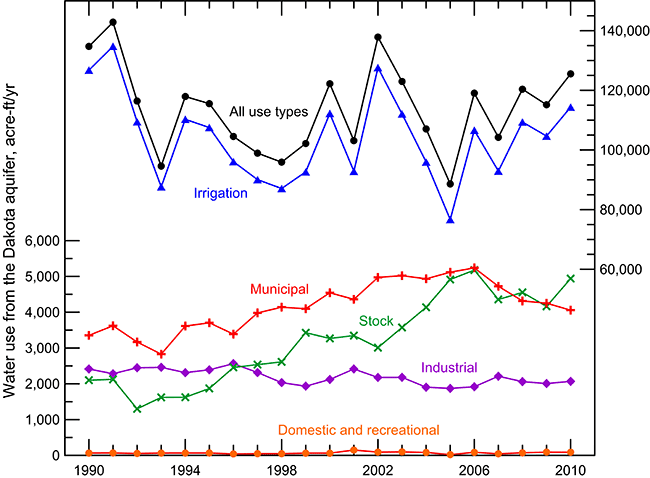
Irrigation is by far the dominant use made from the Dakota aquifer, accounting for the single largest use of water each year from 1990 to 2010 (fig. 10). Municipal use from the Dakota increased from 1990 to 2006 and has since declined somewhat in contrast to a general increase in irrigation use from 2006 to 2010. Stock water use shows an increasing trend during 1990-2010 and surpassed municipal use in 2010. Industrial use, which was greater than stock use from 1990 to 1996, has been relatively stable. Domestic and recreational uses with water-right permits have remained small and have generally fluctuated within ±30 acre-ft/yr (37,000 m3/yr) of the average of 70 acre-ft/yr (86,000 m3/yr) over the 1990-2010 period.
Figure 10--Estimated annual use of groundwater from the Dakota aquifer in Kansas according to different use types from 1990 to 2010.
The variations in the annual rate of water use from the Dakota aquifer are related mainly to variations in climatic conditions for each year during 1990-2010, as indicated in figs. 11 and 12 for north-central and southwest Kansas, respectively. The Palmer drought severity index (PDSI) displayed in the upper portion of each graph represents the differences between wet (positive numbers) and dry (negative numbers) conditions in Kansas; it incorporates the factors that affect evapotranspiration over periods of months (precipitation, temperature, and soil characteristics). Irrigation, stock, and municipal use generally are substantially greater during droughts than wet periods. A general inverse relationship is apparent in the two Kansas regions, i.e., the positive peaks in PDSI (wetter years) match troughs in the estimated water-use rate, and the negative peaks in PDSI (drier years) coincide with positive peaks in estimated water use (figs. 11 and 12). In north-central Kansas, almost eight times as much water was used during the drought year of 2002 (15,900 acre-ft/yr [1.96 x 10⁷ m3/yr]) as during the very wet year of 1993 (2,070 acre-ft/yr [2.55 x 10⁶ m3/yr]). This relative range is greater than in southwest Kansas because during wet years in north-central Kansas, precipitation is completely or nearly sufficient for crop irrigation and lawn growth. In southwest Kansas, additional crop irrigation is often needed during short dry periods (a week or two) even in wet years due to the much greater rate of evapotranspiration that normally occurs relative to north-central Kansas. The decline in use from the Dakota aquifer in north-central Kansas from 2002 to 2010 fits the general increase in the PDSI during this period (fig. 11). The use in north-central Kansas is expected to increase in 2011 (annual PDSI of 1.9) and in 2012 (summer drought) in comparison with 2007-2010.
Figure 11--Palmer drought severity index and estimated annual use of groundwater from the Dakota aquifer in north-central Kansas from 1990 to 2010.
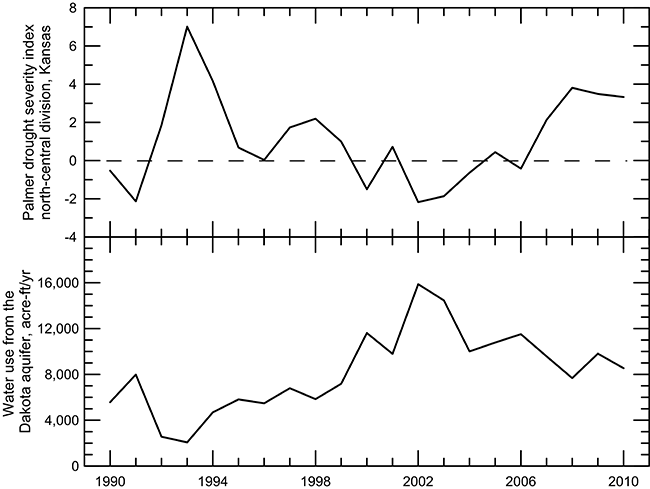
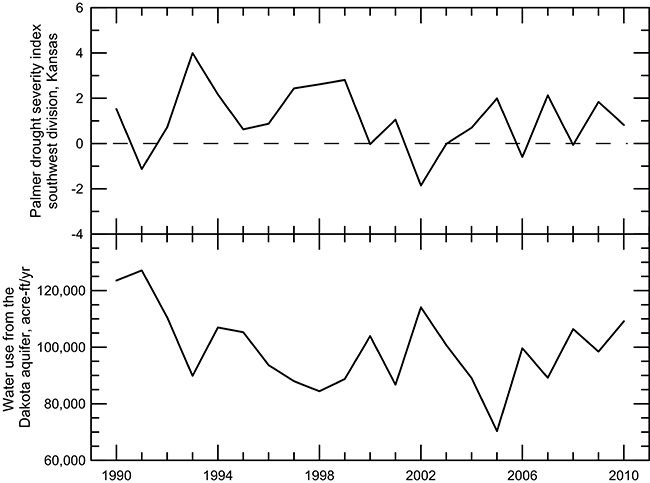
Figure 12--Palmer drought severity index and estimated annual use of groundwater from the Dakota aquifer in southwest Kansas from 1990 to 2010.
Watts (1989) estimated water use from the Dakota aquifer by water-right-permitted wells for five counties in southwest Kansas (Finney, Ford, Gray, Hodgeman, and Kearny) from 1975 to 1982. Comparison of the total mean annual water use for these counties during that period with the estimated total for 2006-2010 from this bulletin appears to indicate an insignificant change in the total (table 4). However, the values for Finney, Gray, and Kearny counties increased appreciably between the periods, while the use in Ford and Hodgeman counties decreased substantially. Part of the increases in Finney, Gray, and Kearny counties could reflect that Watts (1989) considered only those wells that obtained all or most of their water from the Dakota aquifer, whereas this study considered all wells with greater than 5% contribution from the Dakota. In addition, some of the increases represent additional wells in the Dakota, as well as the deepening of new or replacement wells screened in both the Dakota and HPA. The data in Watts (1989) show an increase from 600 acre-ft/yr (7.4 x 10⁵ m3/yr) in 1975 to 4,100 acre-ft/yr (5.1 x 10⁶ m3/yr) in 1982 for Finney County and from 0 to 300 acre-ft/yr (0 to 3.7 x 10⁵ m3/yr) and 0 to 500 acre-ft/yr (0 to 6.2 x 10⁵ m3/yr) for Gray and Kearny counties, respectively, for the same period. From 1990 to 2010, a significant increase in Dakota water use occurred in Kearny County, a small increase occurred in Gray County, and no significant change took place in Finney County (fig. 13).
Table 4--Comparison of mean annual water use from the Dakota aquifer for water-right-permitted wells in Finney, Ford, Gray, Hodgeman, and Kearny counties from 1975-1982 to 2006-2010. The data for 1975-1982 are from Watts (1989) and for 2006-2010 from this report.
| County | Mean annual use, acre-ft/yr> | |
|---|---|---|
| 1975-1982 | 2006-2010 | |
| Finney | 1,400 | 2,169 |
| Ford | 12,188 | 8,655 |
| Gray | 112 | 2,399 |
| Hodgeman | 5,888 | 2,255 |
| Kearny | 100 | 3,957 |
| Total | 19,688 | 19,435 |
Figure 13--Estimated annual use of groundwater from the Dakota aquifer in Finney, Ford, Gray, Hodgeman, and Kearny counties from 1990 to 2010.
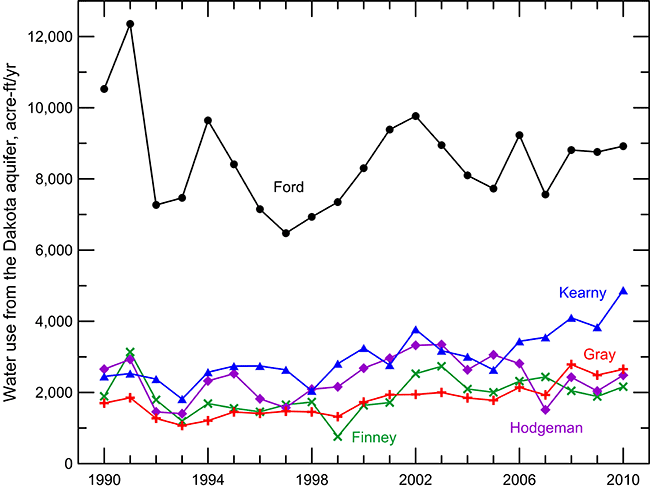
Although the water use values for the Dakota aquifer in Watts (1989) fluctuated for Ford and Hodgeman counties from 1975 to 1982, they did not show any significant trend. Water use in Ford County dropped substantially from a range of 10,500-12,400 acre-ft/yr (1.30 x 10⁷-1.53 x 10⁷ m3/yr) in 1990 and 1991 to a range of 6,500-9,600 acre-ft/yr (0.80 x 10⁷-1.18 x 10⁷ m3/yr) during 1992-2010 (fig. 13). Water use in Hodgeman County shows no significant trend and fluctuated between 1,400 and 3,300 acre-ft/yr (1.7 x 10⁶-4.1 x 10⁶ m3/yr) during 1990-2010 (fig. 13).
Two main reasons explain the decreases in water use in Ford and Hodgeman counties from 1975-1982 to 2006-2010 (table 4), one based on data accuracy for 1975-1982 and the other reflecting actual decreases in water use. Reported water use values before 1990 are known to have been, in general, somewhat greater than the actual water use (based on comparison with data after 1990). The year 1990 was the first for which reported water use was examined by a state quality-control program (first undertaken by the KWO and today by the DWR) that checked water-use data. In addition, flow-rate meters were required for all pumping wells in Ford County from 1991 to 1996 as part of an order from Southwest Kansas Groundwater Management District No. 3 (GMD3), and starting in 1980 in Hodgeman County, flow-rate meters were required for all new or re-drilled water-right-permitted wells (Wilson, 2003). Water usage reports based on hours pumped times flow rates or on energy usage rates traditionally are higher than more accurate flow-rate meter readings.
Actual decreases in water use that occurred in Ford and Hodgeman counties also can be attributed to irrigators pumping less water from or no longer pumping, or not replacing, existing wells in the Dakota aquifer that had decreased in yield. A primary factor for this was probably greater maintenance costs for Dakota aquifer wells than typical for unconsolidated aquifer wells. Factors such as physical, biological, and chemical blockage of the well screen (Scherer, 2005) or well corrosion can result in increased maintenance costs. The common occurrence of high iron and manganese concentrations in the Dakota wells (described in the geochemistry section of this bulletin) and a substantial drop in water level (allowing the introduction of more dissolved oxygen) could have resulted in oxyhydroxide precipitation and the formation of accompanying biological mats across the well screen. Also, corrosion of the well casing and screen by a chemically reducing environment sometimes encountered in the Dakota could have contributed to greater maintenance costs.
Wells without Water-Right Permits
Determination of Well Location
Estimating the number of "domestic" wells without water-right permits and their annual water usage is a challenge with a much higher level of uncertainty than well counts and water usage for wells with water-right permits. Wells that pump water primarily from the Dakota aquifer for "domestic" uses tend to be distributed mainly in areas outside the extents of alluvial aquifers and the HPA shown in fig. 3. The most recent KGS bulletins that describe the geohydrology of counties within the extent of the Dakota aquifer in north-central and central Kansas that also include lists of wells with information about water source and use type are for Ellsworth (Bayne et al., 1971), Ottawa (Mack, 1962), and Rush (McNellis, 1973). The numbers of domestic and stock wells listed in these publications that had a primary or sole water source from the Dakota aquifer were 136 in 1961 for Ellsworth County, 136 in 1957-1958 for Ottawa County, and 26 in 1959-1960 for Rush County.
Wells classified as "domestic" are not required to have quantified water rights by Kansas water law and include the use designations in WWC-5 records of domestic, lawn and garden, and feedlot/livestock/windmill. However, some of the feedlot wells and a few of the domestic and lawn-and-garden wells have water rights. Between 1975 (the start of the WWC-5 records) and early 2012, the number of "domestic" wells constructed in Ellsworth, Ottawa, and Rush counties, minus the number of plugged wells of this type and minus the number of permitted stock-watering and domestic use wells, totaled 348, 796, and 267, respectively. The sum for the three counties (1,411 wells) represents a net total of WWC-5 "domestic" wells for 1975-2012. The proportion of the 1975-2012 "domestic" wells that produce primarily or solely from the Dakota aquifer for each of the three counties was estimated from the ratio of Dakota domestic and stock wells to the total wells of these types in all aquifers in the list in the KGS bulletin for each county. The average annual rate of "domestic" Dakota well construction during 1975-2012 for each county was used to estimate the number of Dakota wells constructed between the date of the well list in each KGS bulletin and 1975. The total number of current Dakota wells with "domestic" uses was determined by summing the number in the KGS bulletin list, the estimated number between the bulletin list and 1975, and the estimated number during 1975-2012. These totals were further reduced by 5% to reflect wells that may have been plugged before 1975 or that are currently unused but not plugged. The numbers of wells currently producing primarily or solely from the Dakota aquifer for "domestic" uses were estimated to be 454 for Ellsworth, 910 for Ottawa, and 123 for Rush, giving a total of 1,487 for the three counties.
Ellsworth, Ottawa, and Rush counties are reasonably representative of the counties in the north-central and central regions where the Dakota aquifer is used for water supply (see table 1 for counties in named regions). The usable Dakota aquifer in these regions includes both confined and unconfined strata. Unconsolidated aquifers overlying part of the Dakota are mainly alluvial systems associated with stream and river valleys. The ratio of the estimated total of active "domestic" Dakota wells (1,487) divided by the net total (1,414) of wells constructed in 1975-2012 used for "domestic" purposes from all aquifer sources is 1.05 for these three counties. The total number of active Dakota wells used for "domestic" purposes in the north-central and central regions of Kansas was estimated by multiplying that ratio times the net total wells constructed during 1975-2012 in the counties in these regions. However, for this calculation, an adjustment must be made for the area for which "domestic" wells are summed from the WWC-5 data base because not all of the counties in these two regions are underlain by Dakota strata (fig. 3). Thus, no wells from Clay County were considered in the north-central region to approximately balance the area of Washington County that is not underlain by the Dakota aquifer. Similarly, no wells were considered in Saline, McPherson, and Marion counties to offset the area without underlying Dakota strata in Rice County and the part of Barton County south of the Arkansas River where the HPA is essentially the only aquifer used. The net total of "domestic" wells constructed during 1975 to early 2012 in the adjusted areas of north-central and central Kansas is 7,621. Application of the 1.05 ratio of active Dakota/net total wells gives an estimate of 8,000 "domestic" wells with a primary or sole water source from the Dakota aquifer for these two regions (table 5).
Table 5--Estimated number of "domestic" wells primarily or solely completed in the Dakota aquifer, mean annual water use from the Dakota by these wells compared to water-right-permitted wells that produced part or all of their yield from the Dakota aquifer during 2006-2010, and total mean annual use from the Dakota aquifer. Use values are rounded to three significant figures or to 100, whichever is smaller.
| Region | Number of "domestic" wells in Dakota aquifer |
Mean annual water use from Dakota aquifer, "domestic" wells, acre-ft/yr |
Number of water-right- permitted wells in Dakota aquifer |
Mean % of total yield that is from Dakota aquifer, water-right- permitted wells |
Mean annual water use from Dakota aquifer, water- right-permitted wells, acre-ft/yr |
Total mean annual water use from Dakota aquifer, all wells acre-ft/yr |
Mean % of total Dakota use that is "domestic" |
|---|---|---|---|---|---|---|---|
| North-central | 1,880 | 1,520 | 423 | 98.4 | 9,420 | 10,950 | 13.9 |
| Central | 6,120 | 4,810 | 236 | 95.5 | 2,860 | 7,670 | 62.7 |
| South-central | 345 | 212 | 82 | 72.8 | 3,440 | 3,660 | 5.8 |
| West-central | 696 | 573 | 21 | 100.0 | 585 | 1,160 | 49.5 |
| Southwest | 2,120 | 885 | 1,572 | 50.6 | 100,600 | 101,400 | 0.9 |
| Total | 11,200 | 8,000 | 2,334 | 116,800 | 124,800 | 6.4 |
The numbers of active "domestic" Dakota wells in south-central, west-central, and southwest Kansas (see table 1 for counties in named regions) were estimated based on WWC-5 records and modifications to the ratio used in the estimation for north-central and central Kansas. To estimate the number of active "domestic" Dakota wells in the south-central region of Kansas, the number of counties was first reduced to reflect areas where the Dakota aquifer is not used due to sole use of the HPA (fig. 3). Thus, WWC-5 records in Edwards County were not included and only wells in Pawnee County were considered. For the southwest Kansas region, WWC-5 records were not included in Clark, Meade, and Seward counties to offset the areas of Morton and Stevens counties that are not underlain by the Dakota aquifer in that region.
Major portions of the south-central, west-central, and southwest regions are underlain by the HPA, which is the primary source of water in these areas (fig. 2). The HPA is likely to be the only water source for "domestic" wells in these areas because the wells do not need the extra capacity that could be derived from completion in the underlying Dakota aquifer in addition to the HPA. However, in much of the area that either does not include the HPA or has only thinly saturated HPA, the Dakota aquifer (along with some underlying Morrison-Dockum aquifer in westernmost southwest Kansas) is the main water source. For example, Fader et al. (1964) list many wells completed in the Dakota Formation and several in the Cheyenne Sandstone and Dockum Group in Stanton County, especially in the southwest part of the county. These factors were considered in the reduction of the ratio of active Dakota wells/net total wells from the value of 1.05 for north-central and central Kansas to 0.5 for south-central, west-central, and southwest Kansas. This number was selected to be less than the ratio (0.65) of two fractions: the first (0.083) is the number of permitted water-right wells in the Dakota aquifer divided by the total permitted wells in all aquifers in south-central, west-central, and southwest Kansas; the second (0.129) is the analogous value for north-central and central Kansas. The net total of "domestic" wells constructed from 1975 to early 2012 in west-central Kansas and the adjusted areas of south-central and southwest Kansas is 6,346. Multiplying by the 0.5 ratio of active Dakota/net total wells gives an estimate of 3,160 "domestic" wells with a primary or sole water source from the Dakota aquifer for these three regions (table 5).
Based on the above computations, the total number of "domestic" wells that produce most or all of their water from the Dakota aquifer in Kansas is estimated to be 11,200 (8,000 in north-central and central Kansas and 3,160 in south-central, west-central, and southwest Kansas). Although "domestic" wells are generally much smaller in terms of overall pumping capacity than those requiring water rights, their estimated number is five times the estimated number (2,237) of water-right-permitted wells that obtain some or all of their source from the Dakota aquifer.
Estimated Water Use
The annual water use for a domestic well in Kansas that serves a 2.5-person household (U.S. Census, http://quickfacts.census.gov/qfd/states/20000.html), uses 100 gal/day (380 L/day) per person (self-supplied use, Kenny et al., 2009), and waters a fifth of an acre of lawn and garden with 18 inches is estimated to be 0.6 acre-ft/yr (740 m3/yr). A typical well dedicated to lawn and garden watering probably applies water to a larger area than watered by a typical domestic well; annual water use could average 0.5 acre-ft/yr (600 m3/yr). Most stock wells are used to provide water for cattle. Beef cattle require an average of 8-12 gal/day (30-45 L/day) over a year (Blocksome and Powell, 2006). Wells that water fewer than 1,000 stock in a confined location do not require a permit. Thus, livestock wells that fall under the classification of "domestic uses" could pump from less than 1 to about 10 acre-ft/yr (1,200-12,000 m3/yr), depending on the number of livestock at the facility.
Most of the wells used for "domestic" purposes (not requiring a water right) are recorded as domestic wells in the WWC-5 records for the regions in which the Dakota aquifer is used for supply. About one-sixth of the "domestic" wells are recorded as lawn and garden usage, and approximately one-tenth are recorded as feedlot and livestock usage. Based on this well distribution and average use rates of 0.6, 0.5, and 3 acre-ft/yr (740, 600, and 3,700 m3/yr) for domestic, lawn and garden, and feedlot/livestock use, respectively, the use rate for an average "domestic" well is estimated as a little more than 0.8 acre-ft/yr (1,000 m3/yr).
The total water use from the Dakota aquifer by wells that do not need a water right was determined by multiplying the estimated number of "domestic wells" by an average of 0.8 acre-ft/yr (1,000 m3/yr) use and also by the mean percentage of total yield that is from the Dakota aquifer for water-right-permitted wells (table 5). This mean percentage (column three in table 5) is smaller for southwest and south-central Kansas than for the three other regions, indicating that a smaller proportion of the total pumping from a well partially completed in the Dakota aquifer is actually derived from Dakota strata.
The largest water use from the Dakota aquifer by "domestic" wells is expected to be from central Kansas (approximately 4,800 acre-ft/yr [5.9 x 10⁶ m3/yr]), followed by north-central Kansas (about 1,500 acre-ft/yr [1.9 x 10⁶ m3/yr]). Water pumped from the Dakota aquifer by "domestic" wells in the three other regions sums to approximately 1,700 acre-ft/yr (2.1 x 10⁶ m3/yr). The total use from the Dakota aquifer by wells that do not need a permit is estimated to be 8,000 acre-ft/yr (1.0 x 10⁷ m3/yr).
"Domestic" wells are estimated to pump more than 60% of the total water produced from the Dakota aquifer in central Kansas and half of the total Dakota water in west-central Kansas (table 5). Substantially smaller percentages of the total water use from the Dakota aquifer are pumped by "domestic" wells in the three other regions, with the "domestic" water use in southwest Kansas amounting to only about one percent of the total. The amount of water use from the Dakota aquifer by "domestic" wells in all Kansas regions is estimated to be 6.4% of the total of approximately 125,000 acre-ft/yr (1.54 x 10⁸ m3/yr) pumped from the aquifer by all wells.
Prev Page--Introduction || Next Page--Geochemistry
Kansas Geological Survey, Geohydrology
Placed on web Nov. 6, 2014; originally published Fall 2014.
Comments to webadmin@kgs.ku.edu
The URL for this page is http://www.kgs.ku.edu/Publications/Bulletins/260/03_use.html