Previous--Seismic Response of the East Flank of the Central Kansas Uplift || Next--Seismic Signature of the Hutchinson Salt
Kansas Geological Survey
This article available as an Acrobat PDF file (5 Mb).
Middle and Upper Pennsylvanian cyclic sequences (cyclothems) in eastern Kansas are ineffectively imaged on standard petroleum-exploration reflection seismogram sections with frequency responses less than 80 Hz. The Kansas City and Lansing Groups, despite the number of interlayered high-contrast beds they contain, often cannot be distinguished and are grouped as a single characteristic response. However, the use of high-resolution reflection seismology, with dominant frequencies of 250-300 Hz and maximum frequencies to greater than 500 Hz, allows the detection of thin-bed units within the individual groups and formations to approximately 2-m thickness. Alternating thin limestones and shales that comprise cyclothems lead to resonance of the seismic wave. Geological cyclicity and reflection seismology harmonize, and carbonate units are recorded as peaks and siliciclastic units (mostly shales) are recorded as troughs. Further, seismic response is sensitive to such phenomena as the presence of intrabed sandstone lenses in shales and the surface roughness (diffusivity) of lithologic interfaces. The use of an instantaneous phase response display accentuates low-amplitude interbed features such as channels within sandstones and shales.
The ability of high-frequency seismic data to resolve features within the stratigraphically heterogeneous Pennsylvanian of eastern Kansas is demonstrated. To effectively image at the scale of variability of these strata (meters to tens of meters), resolution must be maximized and spurious noise minimized. Acquisition, processing, and display must all aim to this purpose. Small-scale features that are observed on a seismic section acquired across a geologically well-defined stratigraphic interval are documented, and observations of reflection character are correlated to observed geology.
In 1986, a 70-m (230-ft)-long high-resolution seismic line was shot on the west campus of The University of Kansas (fig. 1). The data reveal a great deal about the seismic response of Kansas cyclothems. Details of the acquisition are published elsewhere (Knapp, 1988; Knapp and Müftüoglu, 1987; Knapp and Watney, 1987) and are summarized in table 1.
Figure 1--Location map of the seismic line. Total line length displayed in fig. 2 is 70 m (230 ft).
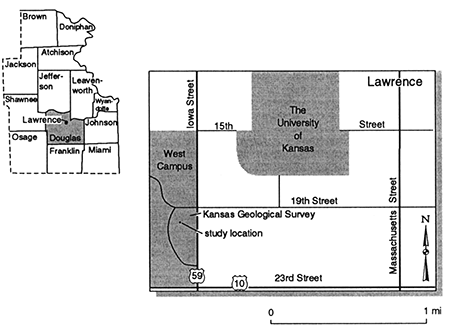
Table 1--Seismic-data Acquisition Parameters.
| Source: | .50-caliber rifle fired into a augered hole 30 in. (76.2 cm) deep |
| Vertical stack: | 1 |
| Receivers: | Mark Products 40-D geophones, 100-Hz natural frequency, undamped |
| Arrays: | none, point source, and single geophone receivers. |
| Group interval: | 2 m |
| Seismograph: | Input/Output DHR 2400, 24 channels |
| CMP stack fold: | 12 |
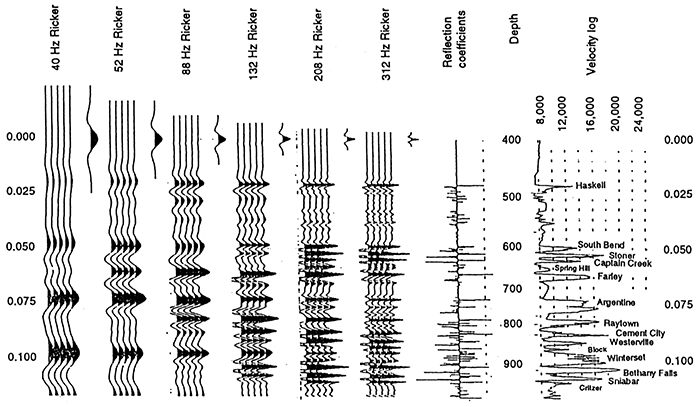
To detect thin beds requires short wavelengths (high frequencies). There is an inverse relationship between frequency content and thin-bed resolution (Knapp, 1990). The wavelength of frequencies in the wavelet must be within an order of magnitude of the thickness of a thin bed for detection to occur. Detection is maximized when bed thickness is one-fourth the wavelength of the dominant frequency. This is the tuning thickness (Widess, 1973). Dominant frequency is frequently about two-thirds of the maximum frequency contained in the wavelet-frequency bandwidth (Kallweit and Wood, 1982). Figure 2 shows that bed resolution improves dramatically with value of dominant frequency. In particular, with a dominant frequency of at least 200 Hz, detection of individual beds begins to occur. This is because tuning begins to occur at that point, at least for cyclic beds of the Upper Pennsylvanian in eastern Kansas. With frequencies of about 80 Hz or less ("typical" petroleum exploration data), reflection character associated with cyclothems has little to do with individual rock units. Rather, generalities are made about the groups, and, in particular, the Kansas City-Lansing Groups are typically paired as an event of some particular characteristic.
Figure 2--Synthetic seismograms showing the relationship of frequency and bed detection.
Seismic reflection is a differential process. That is, rather than being sensitive to lithologic processes, reflections are the consequence of changes (differences) in the acoustical impedance (product of density and velocity) of the rock. Because the seismic wavelet is band-limited, the reflection from an abrupt interface is smeared or spread in time. This dispersion is defined by vertical resolution (Knapp, 1990; Berkhout, 1984). Limitations in lateral resolution smear the horizontal character of the reflection response (Berkhout, 1984). Consequently, the vertical character of a reflection is modulated 1) according to the rate of lithologic change, i.e., vertical rate of change of the acoustic impedance and 2) according to the proximity of other reflecting surfaces that produce interfering reflections. Lateral changes in the reflector, such as reflection-surface roughness, likewise modulate the response at a reflection point; such effects are seen in these data. Migration, the correction of distortion due to reflector geometry, can correct for some of the problems of lateral interferences by removing the effects of diffractions and by moving reflectors to their correct position, but results are still strictly limited by lateral resolving power. Even migration reduces a point to what Claerbout (1985, p. 17) terms a "focus," i.e., a "point" with lateral and vertical dimension. For "layer cake" geology with smooth, thick-bed reflectors, the reflection character is regular and its amplitude and polarity represent the change in acoustic impedance. In this case, the results can be inverted to a geological interpretation with a maximum of ease, although calibration information is required. In general, however, reflection response is the complex interference of effects due to vertical and lateral geological changes. These effects limit interpretation capabilities.
Middle and Upper Pennsylvanian strata of eastern Kansas are characterized by cyclic lithologic sequences made up of alternating laterally persistent limestones, shales, and sandy shales. These cyclothems are typically 10-30 m (33-98 ft) thick, with individual members commonly less than a meter (3.3 ft) thick. Local development of sandstone channels and lenses, and coals is common in the thicker shales (Heckel, 1978; Heckel et al., 1979). Seismically, most beds appear as thin-bed responses (Knapp, 1990), corresponding to individual beds of limestone and shale. Consequently, the seismic section can be processed so that the shales appear as troughs and the limestones as peaks (fig. 3). Thickness cannot be directly measured but one can, in some cases, determine the thickness of a thin bed from its amplitude response (Widess, 1973) or its frequency (Knapp, 1990). The former method requires calibration by well log or other information and becomes unreliable when vertical or lateral changes of the reflector smear the response or when cyclothemic variation causes tuning of the reflector. The latter method depends on the cyclothemic tuning of the reflector and, depending on the degree of the tuning, may be very approximate. Both methods are employed to judge the thickness of a reflector bed.
Instantaneous phase emphasizes continuity of all reflectors, weak or strong. An important attribute of instantaneous phase is that amplitude is removed as a component, and reflectors, regardless of strength, have the same display weight. This is important in that a display of the recorded trace is scaled according to the amplitudes of the strongest reflections. CMP seismic data have a dynamic range of 40-60 dB (1:100 to 1:1000); a standard display has a dynamic range of about 20 dB (1:10). Accordingly, on a simple trace display, only the characteristics of the strongest reflections are obvious to the interpreter. This is important, of course, in terms of stratigraphic location and identification of marker horizons, but frequently it is the small subtle features and anomalies that are of true interest. The display of instantaneous phase enhances subtle features such as weak reflections and inflections on the stronger ones, and it is the most sophisticated of the devices one could employ to do so. Identification of relatively small-scale rock heterogeneity enhances the use of very high resolution seismic-reflection profiling for use in infracyclothemic seismic stratigraphic interpretation and use in near-surface reservoir analog investigations.
Instantaneous phase is determined from complex trace analysis (Taner et al., 1977). For smoothness, it is frequently the sine of the phase angle that is displayed. That is, values will vary from -1.00 (-90°, troughs) to +1.00 (+90°, peaks) with other angles cycling in-between.
The seismic section, correlated with a synthetic seismogram, and its general interpretation is shown on figs. 3 and 4. The synthetic seismogram is derived from a velocity log from a well about 10 km from the seismic line (DCL & FA #1, USGS-KGS, sec. 13, T. 12 S., R. 17 E., Douglas County). The fit is generally very good. Except for the lower Douglas Group, the response of the seismic section is one of thin beds where the troughs correspond to shales and the peaks to limestones. The general weakening of reflection strength with depth is due in part to distance from the surface and decreased signal-to-noise ratio, but also is due to a general decrease in reflection coefficient, i.e., changing geology from a carbonate rock-shale package in the Lansing, Kansas City, and Marmaton Groups above to a shaly sandstone-shale interval of the Cherokee Group below. Note the reduced contrast of the lithology below 150 msec, seen in the log of fig. 3. The reduction corresponds with the top of the Cherokee Group.
Stratigraphic nomenclature, which follows, is adapted from Watney et al. (1989).
Figure 3--Seismic section acquired on West Campus of the University of Kansas. Correlation with stratigraphic section from the area lines up peaks with limestones. Approximate depth in meters is given right of the section.
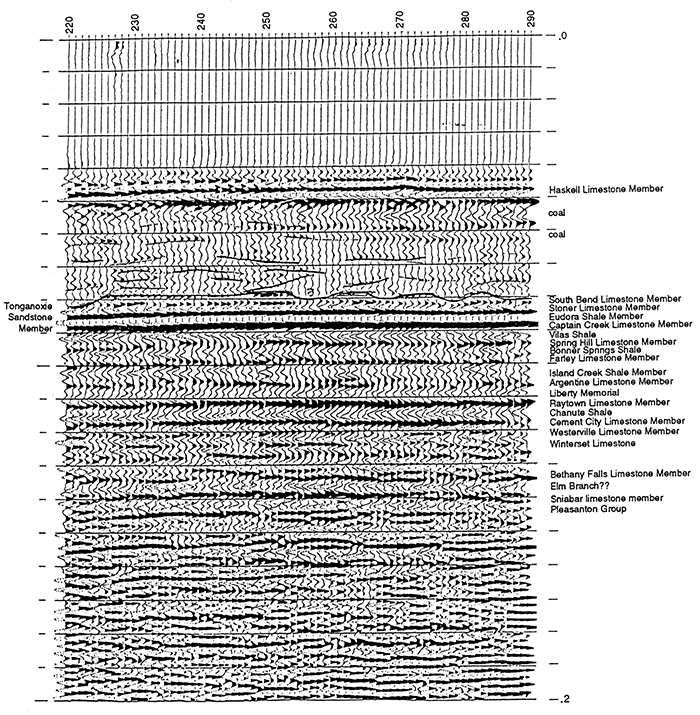
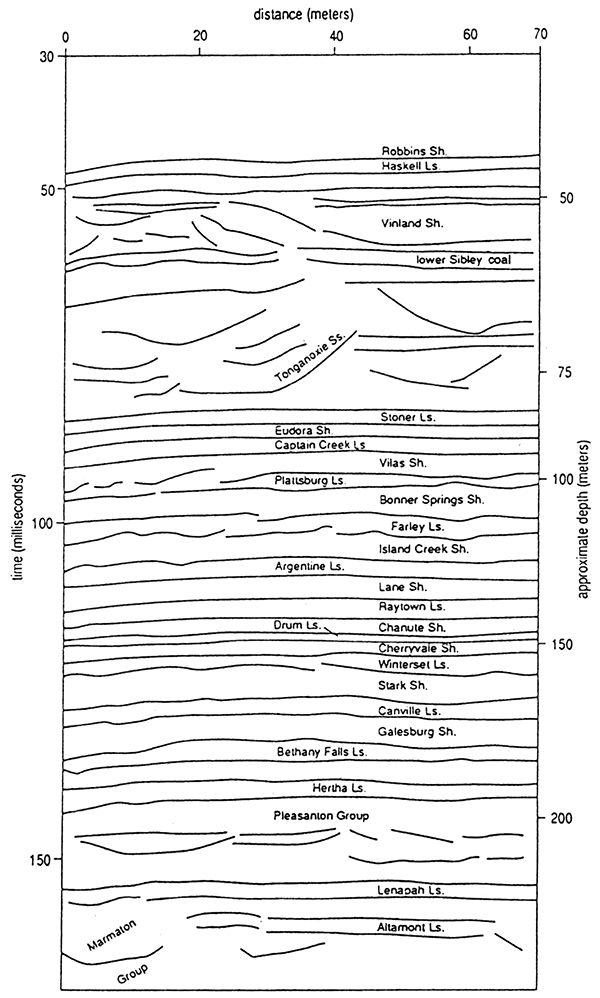
Figure 4--Interpretation of the seismic section of fig. 3.
Only the lower half of the Douglas Group is recorded on the seismic section. The first strong reflector is the Haskell Limestone (47 msec), the basal member of the Lawrence Shale. The Haskell Limestone is 2 m (6.6 ft) thick and is displayed as a prominent peak. The remainder of the group is the Stranger Formation, the upper third of which contains very shaly sandstone and two thin coals. The two coals are the upper and lower Sibley coals. They are 0.3 m (I ft) or less in thickness (Bowsher and Jewett, 1943), and they are resolved seismically as two distinctive troughs at 55 and 61 msec, respectively. It was demonstrated (Knapp and Müftüoglu, 1987) that despite the thinness of the coals, the acoustic-impedance contrast was great enough to cause a prominent reflection. They are easily detected. The lower two-thirds of the Stranger Formation is relatively clean Tonganoxie Sandstone.
The Tonganoxie Sandstone is a prominent fluvial to estuarine sandstone named after surface exposures near Tonganoxie, Kansas, in Leavenworth County (Moore et al., 1934), 20 km (12 mi) northeast of the seismic line. The sandstone from a core near the seismic line (KGS Fishpond #1) consists of 43 m (141 ft) of fine- to medium-grained crossbedded sandstone with rare thin shale and mudstone beds. This is the maximum known thickness of the sandstone. The city of Lawrence lies in a large buried valley in which the Tonganoxie Sandstone was deposited (Lins, 1950; Feldman et al., 1995). The valley cuts down from beneath the Haskell Limestone into the lower half of the Douglas Group and locally into the Stanton Limestone of the Lansing Group. The incised valley was mapped by Lins as 35 km (22 mi) wide near Lawrence along the outcrop belt and approximately 30 m (98 ft) deep.
The valley is generally filled to and beyond the valley walls with: I) minor conglomerate at the base, 2) festooned cross stratified and massively bedded sandstone with abundant cut and fill structures, 3) thin-bedded argillaceous siltstone, sandstone, and silty shale, 4) silty shale and clay shale, and 5) coal (the upper Sibley coal which forms the uppermost bed of the Tonganoxie) (Lins, 1950). The coal can be correlated as essentially a continuous unit throughout the valley. Valley-fill strata beneath the coal range from amalgamated channel fills overlain by estuarine deposits while a marine limestone (Westphalia) overlies the coal (Lins, 1950; Feldman et al., 1995).
The Tonganoxie Valley trends northeast-southwest in the vicinity of Lawrence. A nearly continuous filled sandstone valley appears to have been mapped through the subsurface by Sanders (1959). The sandstone extends southward from Lawrence into southeastern Kansas until it crosses a carbonate shelf margin fringing the northern Arkoma basin. Several other elongate sandstone systems have been mapped by Sanders (1959) and Winchell (1957).
These sandstones apparently merge with the sheetlike Stalnaker sandstone in southern Kansas. The Stalnaker is located at a stratigraphic position equivalent to limestones in the Lansing Group (Winchell, 1957). The Stalnaker sandstone is interpreted as a lowstand deposit situated in the northern end of the Arkoma basin. Valley incision of the shelf to the north occurred during lowstand deposition. The Tonganoxie Valley in the Lawrence area, some 175 km (109 ft) from the shelf margin was progressively filled with sandstone, shale, coal, and eventually capped by marine limestone (Haskell Limestone) during a regional sea-level rise. The Haskell Limestone is a nearly continuous marker on both the shelf and basin in the northern midcontinent, reflecting regional base-level rise.
The underlying more regular carbonate-dominated cyclothems of the Lansing Group appear to have been deposited during a higher stand of sea level. Perhaps the siliciclastics of the Douglas Group, were better able to prograde out onto what was the carbonate platform when sea level was lower. In addition, lower stands of sea level probably encouraged valley incision such as the Tonganoxie Valley on the shelf (Watney et al., 1992). Uplift may have been responsible for both the fall in relative sea level and for introduction of the siliciclastics. However, cyclothems in the midcontinent can be correlated to equivalent cycles in western Kansas and on the Texas shelf (Boardman and Heckel, 1989; Watney et al., 1991) suggesting regional processes were important. Local expression of cyclicity may have been affected by local tectonism and sediment supply.
The instantaneous phase display (fig. 5) has removed the factor of amplitude (i.e., reflection strength) from the data; all reflections have the same display weight, regardless of strength. Figure 5 shows clearly the lateral continuity of the Haskell Limestone but, most importantly, shows internal channel structure within the Tonganoxie more clearly than the regular seismic trace section of fig. 3.
Figure 5--Instantaneous-phase display.
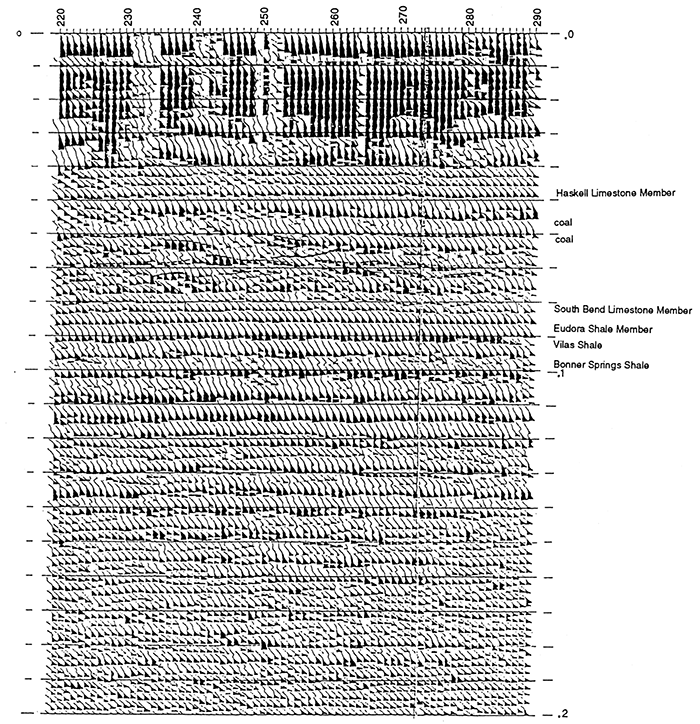
Particularly prominent in the Lansing-Kansas City Groups are the reflections of the Stanton Formation limestones (80-89 msec) and the Liberty Memorial Shale-Raytown Limestone combination (116 msec). Other prominent events include the Chanute Shale (120 msec) and the Bethany Falls Limestone-Hushpuckney Shale-Elm Branch Shale combination (135 msec).
In the Stanton Formation only the Stoner and Captain Creek Limestones are strongly detected (two peaks at 85 and 88 msec, respectively). The South Bend Limestone (81 msec) and the Rock Lake Shale have been cut by the Tonganoxie channel north of CMP 225, 253-260, and 275-280. The nature of the contact is prominently displayed on the instantaneous-phase section (fig. 5). The uniform, sandstone-free Eudora Shale (trough at 87 msec) contributes to the power of the reflector. Figure 5 shows the flatness of the reflecting surface at the top and bottom of the Stoner Limestone and the top of the Captain Creek. At almost 2-m (6.6-ft) thickness, the Eudora Shale can be considered to be a relatively thick bed because of its slow velocity. Because the limestones of the Stanton Formation are nearly twice as thick as the Eudora Shale and because their velocity is about twice as much, the wavelength thickness is equal for all three beds. This makes the situation for tuning nearly perfect; hence, the powerful, ringy result of about 300 Hz. This frequency response is exactly consistent with limestone thickness of 4 m (13 ft) and shale thickness of 2 m (6.6 ft), Tuning thickness (Widess, 1974) is one-fourth of the wavelength λ = V/f). For the shale, .25λ = 2 m = 2,400 m/sec/300 Hz; for the limestone, 0.25λ = 4 m = 4,800 m/sec/300 Hz.
The sandstone- and siltstone-rich Vilas (95 msec) and Bonner Springs (102 msec) shales are easily resolved on the amplitude and instantaneous phase sections (figs. 3 and 5). There is a strong lack of lateral continuity in the troughs of these reflectors. Both shales contain lenticular beds of siltstone and sandstone in nearby outcrops (Watney et al., 1989) Other than those two shales, the section is fairly laterally coherent to the Pleasanton Group beneath 140 msec.
The Cement City Limestone (118 msec), only 2 to 3 m (6.6-9.8 ft) thick, is a prominent reflector. Its frequency response (about 300 Hz) is consistent with its thickness. The Westerville Limestone (123 msec) is about 1 m (3.3 ft) thick, and waxes and wanes in strength across the section. (The unit is noted for local thickening up to 6 m (20 ft) due to grainstone buildups.] Its detection is marginal, and it represents the limit of detection for these data. The Westerville Limestone is a high-frequency event because it is so thin, and it is a low-amplitude event because it is thinner than the tuning thickness. Here, its apparent frequency is about 500 Hz. A limestone tuned to that frequency would have a thickness of about 2.4 m (7.9 ft). Amplitude response of the Westerville is about half the tuning amplitude; thus, its thickness is about half, i.e., 1.2 m (3.9 ft), or so. The Westerville interval displays good continuity in phase (fig. 5), despite its lateral variation in amplitude.
The reflections due to the Springhill (94 msec) and Argentine (106 msec) limestones are notably weaker on the seismic section than on the synthetic seismogram. The synthetic seismogram shows that according to vertical velocity contrast, these limestones should show strong positive reflectors. The seismic sections show very weak reflectors in their locations. The surfaces of these reflectors are known to have rough and diffusive surfaces in contrast to many of the other reflectors that are known to have flat, smooth surfaces (Knapp and French, 1991). The rugosity of the surfaces is due to subareal exposure, and the resulting roughness mutes reflection strength (Knapp, 1991). Diffusivity is a lateral effect, not a vertical effect, so it is not seen on the vertical sonic log. The anomalous response of the seismic section with respect to synthetic seismogram is diagnostic of lateral influence on the seismic data.
In all fairness, in this case, laterally variable sandstone content of the Vilas and Island Creek Shales is also a potential contributor to the observation. A lenticular crinoidal grainstone (sand-sized carbonate rock) ranging from 0 m to 1 m (0 ft-3.3 ft) in thickness is present at the base of the Island Creek Shale in nearby surface exposure (Watney et al., 1989).
The grainstone rests on the Argentine or is separated from the Argentine Limestone by less than 0.5 m (1.6 ft) of shale. Similar lateral variations would variably attenuate the amplitude of the reflections along this surface.
The seismic-reflection response of the cyclothems of eastern Kansas to frequencies in the pass band of about 100 Hz to more than 500 Hz tends to tune to the thickness of the beds. Although Middle and Upper Pennsylvanian cyclothems of eastern Kansas are basically interbedded limestones and shales, and the seismic response is one of peak and trough for the cycle, the high-resolution seismic interpretation of their response is not quite that simple.
Reflection strength depends not only on rock contact type (i.e., shale-limestone and bed thickness), it depends also on the nature or diffusivity of the contact and/or on the presence of laterally irregular sandstone lenses and channels in the overlying shale. Clean shales and flat contacts result in strong reflectors. In this case, the actual strength and frequency response of the reflection depends on bed thickness. Rough contact surfaces and sandstone channels in the overlying shale can virtually obliterate a limestone reflector. In the cases seen with Bonner Springs and Vilas Shales, both conditions existed at the same time, so it is difficult to separate the effects.
Instantaneous phase specifically highlights the existence of lateral discontinuity. Emphasized in this process are coherent-but-curved "channel-looking" features and broken chaotic patterns suggesting lenticular or channel-form strata. In the display of instantaneous-phase, internal channel-form structures within the Tonganoxie Sandstone are more clearly seen, and the presence of sandstone lenses within the Vilas and Bonner Springs Shales is inferred as seen in nearby surface exposures of these strata. The high-resolution seismic section provides information about the sandstone content and uniformity of a shale. This determination is enhanced with instantaneous phase which is sensitive to low-amplitude reflections and lateral discontinuity. Instantaneous frequency demonstrates a realistic relationship between frequency value and thin-bed thickness when interval velocity is known. This property takes advantage of the tuning of the thin-bed cyclothems described by Knapp (1990).
The seismic section contains information about the lateral variability of the shale-limestone contact. From this, inferences can be made as to whether the bed surface was exposed to dissolution or erosion during subareal exposure or other processes that would have roughened the surface. The inhomogeneity of strata on top of a reflector surface such as sandstone in shale can also vary the seismic response by decreasing the sharpness of the reflection response. These observations show reasons why synthetic seismograms may fail to fit observed seismic data. Seismic reflections are affected by this lateral variability of the surface, whereas the synthetic seismogram is not. The effect of lateral discontinuity becomes more prominent at high frequencies (short wavelengths) because as wavelength approaches the dimensions of roughness, then diffusivity ceases to be negligible. Although lateral variation is observable on seismic data, as Knapp (1991) points out, it is difficult to characterize what is causing the observed result because of the smoothing or averaging effects of both the vertical and lateral wavelets.
Resolution power of the section is indicated by the clear resolution of the upper and lower Sibley coal, about 0.3 m (1 ft) thick each, at depths of about 50 m and 60 m (164 ft and 197 ft), respectively. Given the strength of the reflection from the 2-m (6.6-ft)-thick Haskell Limestone, it is evident that reflections from limestones thinner than 1 m (3.3 ft) are not difficult to detect in the shallow part of the section. In the deeper part of the section, the limits of detection are defined by the marginal detection of the Westerville Limestone, which is 1 m (3.3 ft) thick, at a depth of about 160 m (525 ft).
The seismic profile permits resolution of individual limestone and shale members of formations comprising the Lansing and Kansas City Groups. Thinner marine shales (condensed sections) such as the Hushpuckney and Stark shales are not seen except when the marine shale is thicker than 2 m (6.6 ft), e.g., Eudora Shale. Similarly, the transgressive limestones (flooding unit) are generally not resolved on the seismic profile due to thinness and proximity to the overlying highstand carbonate unit.
The Douglas Group presents a different type of geology with laterally discontinuous, lenticular and channel sandstones, thin limestones, and coal. The section imaged below the Haskell Limestone is situated in an incised valley filled primarily with Tonganoxie Sandstone overlain by a shale capped by the upper Sibley coal. Interval stratification probably representing some of the larger cut and fill structures in the Tonganoxie are clearly visible as well as the low-impedance coals.
Valley-fill sandstones of Morrow (Lower Pennsylvanian) age are important reservoirs in western Kansas. These results suggest that further studies of near-surface sites of these valley-filled sandstones may provide useful, cost-effective means of developing three-dimensional reservoir analogs.
Ertan Müftüoglu aided in the acquisition of these data. He assisted on the crew while Jeff Treadway manned the seismograph. Ertan also did much of the work on whether or not we were detecting the Sibley coals. Brian Stephens aided in the initial interpretation of the data by helping with the correlation of the seismograms with well logs.
Berkhout, A. J., 1984, Seismic resolution: Geophysical Press, 228 p.
Boardman, D. R., II, and Heckel, P. H., 1989, Glacial-eustatic sea-level curve for early Late Pennsylvanian sequences in north-central Texas and biostratigraphic correlation with curve for midcontinent North America: Geology, v. 17, p. 802-805
Bowsher, A. L., and Jewett, J. M., 1943, Coal resources of the Douglas Group in east-central Kansas: Kansas Geological Survey, Bulletin 46, 94 p. [available online]
Claerbout, J. F., 1985, Imaging the earth's interior: Blackwell Scientific Publications, 398 p.
Feldman, H. R., Gibling, M. R., Archer, A. W., Wightman, W G., and Lanier, W. P., 1995, Stratigraphic architecture of the Tonganoxie paleovalley fill (Lower Virgilian) in northeastern Kansas: American Association of Petroleum Geologists, Bulletin, v. 79, no., 7, p. 1,019-1,043
Heckel, P. H., 1978, Upper Pennsylvanian cyclothemic limestone facies in eastern Kansas: Kansas Geological Survey, Guidebook Series 2, 79 p. [available online]
Heckel, P. H., Brady, L. L., Ebanks, W. J., and Pabian, R. K., 1979, Pennsylvanian cyclic platform deposits of Kansas and Nebraska: Kansas Geological Survey, Guidebook Series 4, 79 p. [available online]
Knapp, R. W., 1988, High-resolution seismic data of Pennsylvanian cyclothems in Kansas: The Leading Edge, v. 7, no. 11, p. 24-27
Knapp, R. W., 1990, Vertical resolution of thick beds, thin beds, and thin-bed cyclothems: Geophysics, v. 55, no.9, p. 1,184-1,191
Knapp, R. W., 1991, Effects of surface roughness on migration-lateral and vertical resolution: 2nd Congress of the Brazilian Geophysical Society, Salvador, Bahia, Brazil
Knapp, R. W, and Müftüoglu, A. E., 1987, Detection of 30-cm-thick coals at depths of 50 and 60 meters by seismic reflection profiling: Society of Exploration Geophysicists, 57th Annual International Meeting and Exposition, Expanded Abstracts, p. 227-228
Knapp, R. W., and Watney, W. L., 1987, Seismic identification of Pennsylvanian cyclothems beneath Lawrence, Kansas: Society of Exploration Geophysicists, 57th Annual International Meeting and Exposition, Expanded Abstracts, p. 338-341
Knapp, R. W., and French, J., 1991, Features in Kansas cyclothems seen by high-resolution seismology; in, Sedimentary Modeling--Computer Simulation and Methods for Improved Parameter Definition, E. K. Franseen, W L. Watney, C. G. sec. Kendall, and W. Ross, eds.: Kansas Geological Survey, Bulletin 233, p. 111-121 [available online]
Lins, T. W., 1950, Origin and environment of the Tonganoxie Sandstone in northeastern Kansas: Kansas Geological Survey, Bulletin 86, pt. 5 [available online]
Moore, R. C., Elias, M. K., and Newell, N. D., 1934, Pennsylvanian and Permian rocks of Kansas: Kansas Geological Survey, Chart
Sanders, D. T., 1959, Sandstones of the Douglas and Pedee Groups in northeastern Kansas: Kansas Geological Survey, Bulletin 134, pt. 3, p. 125-159 [available online]
Taner, M. T., Koelher, E, and Sheriff, R. E., 1979, Complex seismic trace analysis: Geophysics, v. 44, no. 6, p. 1,041-1,063
Watney, W. L., French, J. A., and Franseen, E. K., 1989, Sequence stratigraphic interpretations and modeling of cyclothems: Kansas Geological Society, Guidebook, 41st Annual Field Trip, 211 p.
Watney, W. L., Wong, J. C., and French, J. A., 1991, Computer simulation of Upper Pennsylvanian (Missourian) carbonate-dominated cycles in western Kansas; in, Sedimentary Modeling--Computer Simulations and Methods for Improved Parameter Definition, E. K. Franseen, W. L. Watney, C. G. St.C. Kendall, and W. Ross, eds.: Kansas Geological Survey, Bulletin 233, p. 415-430 [available online]
Watney, W. L., French, J. A., Wong, J. C., Feldman, H. R., Franseen, E. K., and Guy, W. J., 1992, Sequence stratigraphy and stratigraphic modeling for improved understanding of midcontinent Paleozoic reservoirs (abs.): American Association of Petroleum Geologists, Bulletin, v. 76, no. 8, p. 1,289
Widess, M. B., 1973, How thin is a thin bed?: Geophysics, v. 38, no. 6, p. 1,176-1,180
Winchell, R. L., 1957, Relationship of Lansing Group and the Tonganoxie ("Stalnaker") Sandstone in south-central Kansas: Kansas Geological Survey, Bulletin 127, pt. 4, p. 123-152
Previous--Seismic Response of the East Flank of the Central Kansas Uplift || Next--Seismic Signature of the Hutchinson Salt
Kansas Geological Survey
Comments to webadmin@kgs.ku.edu
Web version placed online Aug. 26, 2015. Original publication date 1995.
URL=http://www.kgs.ku.edu/Publications/Bulletins/237/Knapp3/index.html