Previous--Depositional and Stratigraphic Analysis of Kansas City Group Strata || Next--Seismic Response of Pennsylvanian Cyclothems
1Phillips Petroleum Resources and 2Kansas Geological Survey
This article available as an Acrobat PDF file (6 Mb).
A 7-mi (11.2-km) seismic line across the Lyons anticline just south of Lyons, Rice County, Kansas, shows reflections to the depth of about 3,500 ft (1,070 m) corresponding to the Precambrian Rice Formation. The Lyons anticline is used as a gas storage facility.
Although data quality of reflections from the Precambrian is poor, the indication is that the Lyons anticline existed during the Late Proterozoic and that its initial uplift may be related to Keweenawan rifting. Cambrian-Ordovician Arbuckle Group reflections diverge away from the anticline, suggesting that deposition was contemporaneous with uplift. The Middle Ordovician Simpson Group and the Devonian-Mississippian Chattanooga Shale have distinctive reflection characters. Middle and Upper Ordovician Viola and Maquoketa Formations share a single response of a strong transitional, stretched, and positive-polarity peak.
Within the Chattanooga Shale is a thin limestone member which forms a distinct positive-polarity reflection. The limestone is seen to truncate over the crest of the Lyons anticline, and apparently thins eastward and is eventually replaced with siltstone.
In the Pennsylvanian, the Kansas City, Lansing, and Douglas Groups show a reflection aspect characteristic of a deposition system that is predominantly nonmarine clastic with an associated marginal-marine transport process. Reflections in the Shawnee Group have distinctive but modes amplitude and good continuity. Existence of a possible channel is apparent in the seismic response of the Kanwaka Shale. This feature would be rare to encounter and difficult to characterize if known only from drill data. In the Wabaunsee Group, the Howard Limestone forms a very prominent reflection.
The Lower Permian Admire, Council Grove, and Chase Groups have high-amplitude continuous reflections similar to the Wabaunsee, indicating lateral consistency across the section.
Seven miles (11.2 km) of 12-fold MiniSOSIE (Barbier et al., 1976) seismic data were acquired during the summer of 1983 in Rice County, Kansas, along a line starting about 2 mi (3.2 km) south of the center of Lyons and proceeding eastward (fig. 1). Data-acquisition details are covered in table 1 and are discussed in Roehl et al. (1989). Reflections are detected to depths of approximately 3,500 ft (1,070 m) at times of 0.850 sec and correspond to Precambrian Rice Formation. Processing did not include migration.
Figure 1--Location of Rice County seismic-reflection profile. CMP numbers are shown for each mile (section comer). CMP interval is nominally 27.5 ft (8.4 m).
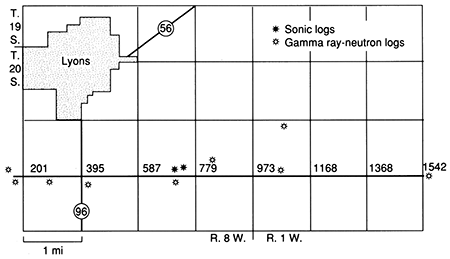
Table 1--Seismic data-acquisition parameters.
| Source type: | MiniSOSIE (Barbier et al., 1976) earth compactor |
| Vertical stack: | 2,000 impulses/shotpoint |
| Record length: | 1 second |
| Sample interval: | 2 milliseconds |
| Source interval: | 55 ft (17 m) |
| Source array: | 55 ft (17 m) linear |
| Group interval: | 55 ft (17 m) |
| Group array: | 55 ft (17 m) linear |
| Recording geometry: | End-on, 24-channel, 12-fold CMP |
| CMP interval: | 17.5 ft (8.4 m) |
| Near offset: | 742.5 ft (226 m) |
| Far offset: | 2,007.5 ft (612 m) |
| Filters: | low cut 55 Hz (24 dB/octave slope) |
| high cut 125 Hz (24 dB/octave slope) | |
| notch 60 Hz (60 dB rejection) |
Rice County is located on the western side of a broad structural saddle formed by the intersection of the Salina basin, the Central Kansas uplift, and the Sedgwick basin. Locally, geologic structures superimposed on the broad saddle generally strike north and north-northeast. The crest of the Central Kansas uplift is just west of the west edge of the seismic section. Deformation in the region began as early as Ordovician time and resulted in complex erosion, faulting, and folding, generally expressed as thickening and thinning and changing attitude of formations encountered in wells.
Uplift and erosion along the flanks of the ancestral Central Kansas uplift during Ordovician to Devonian time resulted in the removal of the Silurian-Devonian "Hunton" Group over much of Rice County and created a large valley named the McPherson Valley (Lee, 1956). Devonian-Mississippian Chattanooga Shale which fills the McPherson Valley reaches thicknesses in excess of 200 ft (61 m). Just west of the axis of the McPherson Valley is the Lyons anticline. This structure is one of a series of north-trending en echelon anticlines developed in western Rice County by accelerated deformation in Late Mississippian to Early Pennsylvanian time. Dip is variable on the east flank, but is, in general, about 2°. Reverse faulting on the west side of the anticline displaces lower Paleozoic strata in excess of 250 ft (75 m). This structure subcrops under the regional basal Pennsylvanian angular unconformity. Formerly a productive reservoir, the Lyons anticline is now used for storage of natural gas by Northern Natural Gas Co.
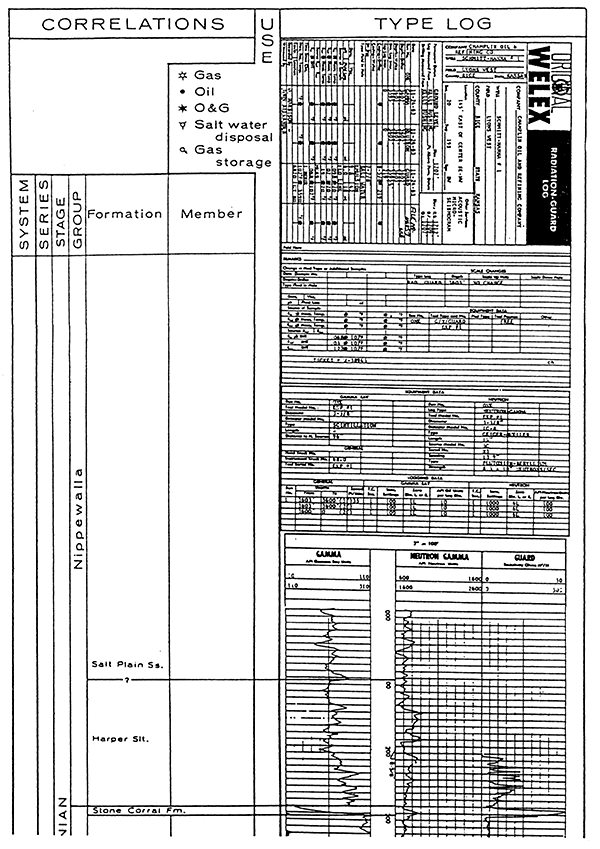
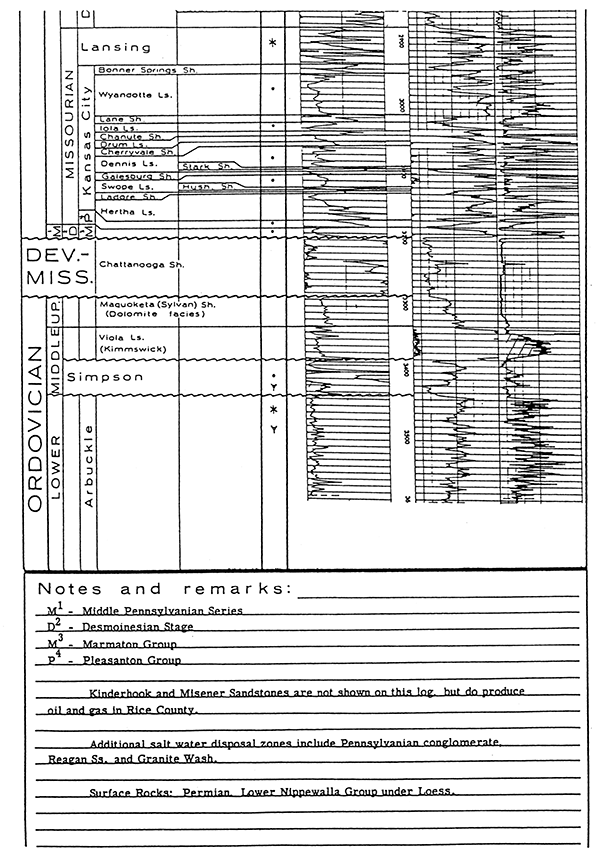
The original intent of the seismic line was to study the extent and character of a limestone bed within the Devonian-Mississippian Chattanooga Shale. Well log data indicate this limestone has a maximum thickness of about 70 ft (21 m) at the western edge of the section. It subcrops over the crest of the Lyons anticline and thins eastward from there. For further reference, fig. 2 shows the type log of Rice County.
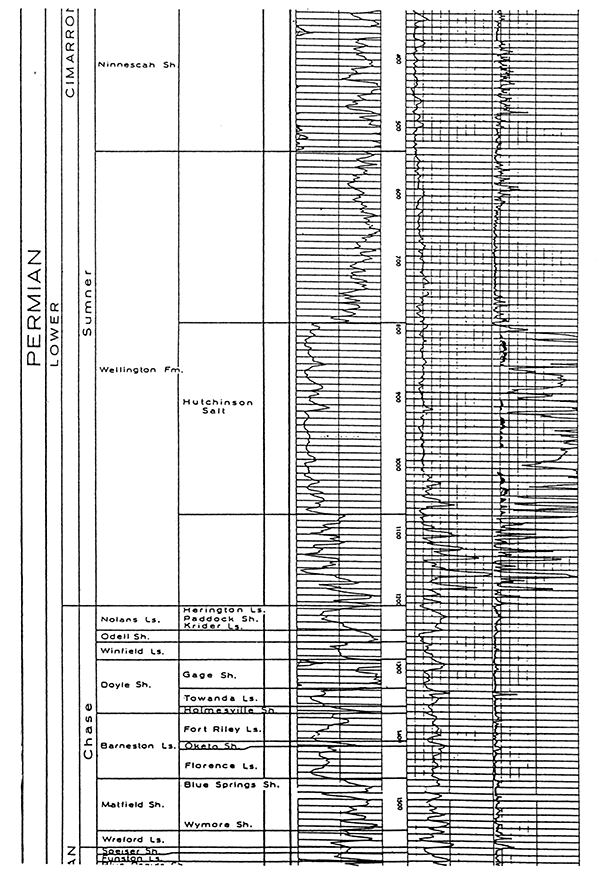
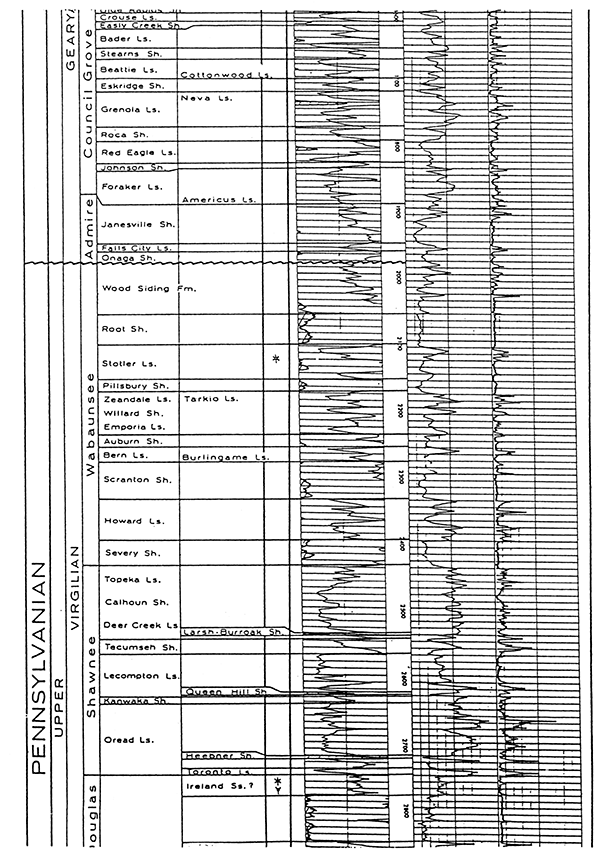
Figure 2--Type log of Rice County, Kansas (Harris et al., 1966).
The east-west seismic profile (fig. 3) runs roughly parallel to regional dip. Of particular interest in the area is the Lyons anticline centered at CMP 650, which is now used as a gas storage facility for Northern Natural Gas. Just east of the Lyons anticline is the McPherson Valley (Lee, 1956), beginning at CMP 680. These structures are particularly evident on fig. 4, a plot interpreted from well data with 5x vertical exaggeration. Several units, from the Cambrian-Ordovician Arbuckle Dolomite to Mississippian limestones, subcrop beneath a basal Pennsylvanian unconformity at about 0.600-0.630 sec (figs. 3b and 5). Likewise, there is a sub-Chattanooga unconformity where upper Ordovician Maquoketa Shale and middle Ordovician Viola Limestone subcrop (fig. 6).
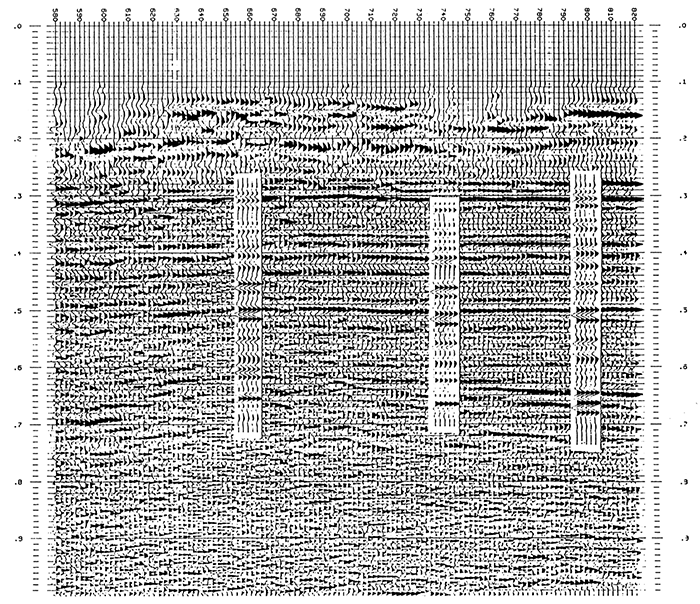
Figure 3--A) Rice County seismic section. B) Generalized interpretation.
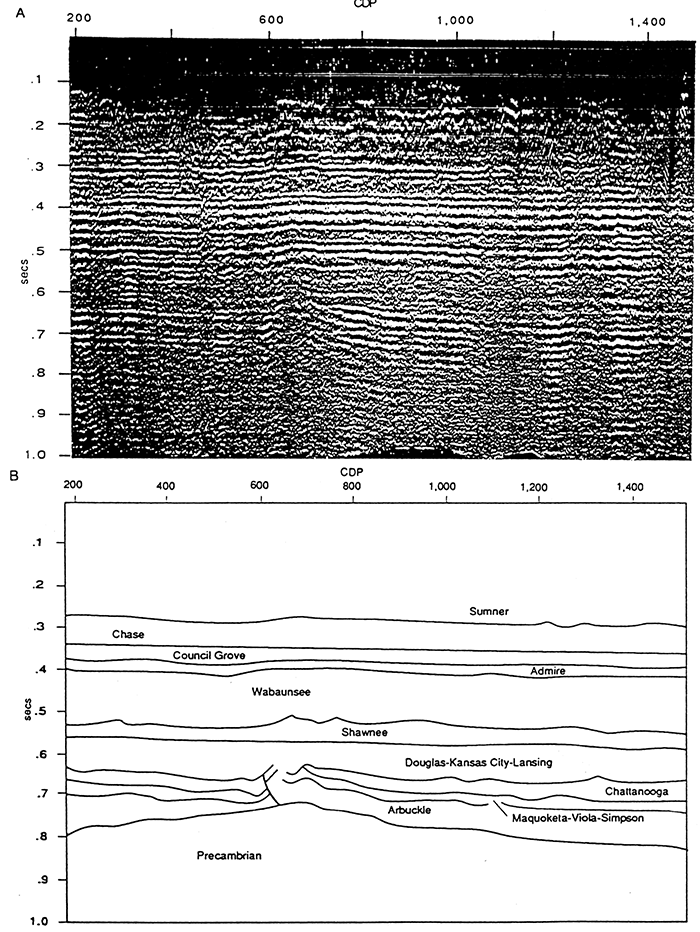
Figure 4--Geologic cross section showing part of Lyons anticline along part of Rice County seismic section: 5x vertical exaggeration.
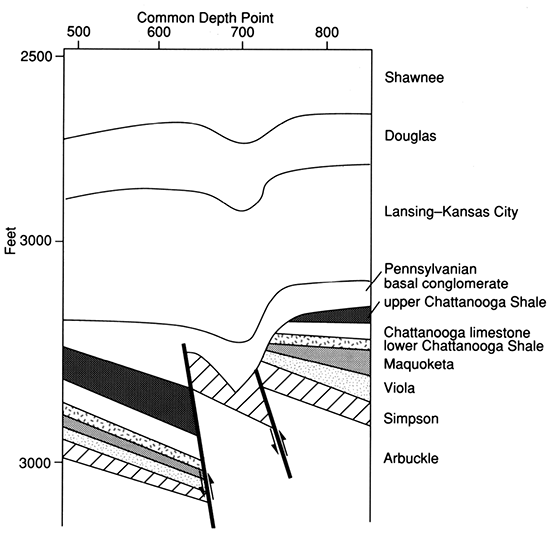
Figure 5--Subcrop map at the basal Pennsylvanian unconformity. Heavy line indicates eastward extent of Chattanooga limestone unit within the Chattanooga Shale. Map is 12 x 12 mi (19.3 x 19.3 km). Location of the seismic line is marked by double-arrow line.
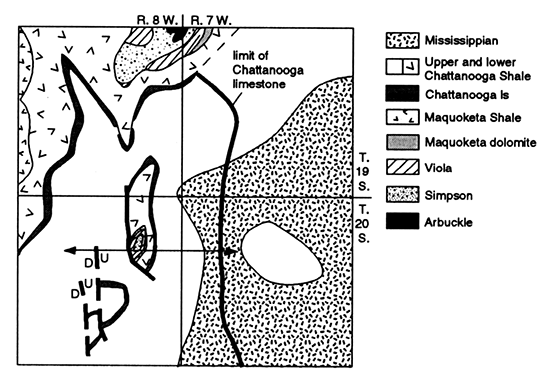
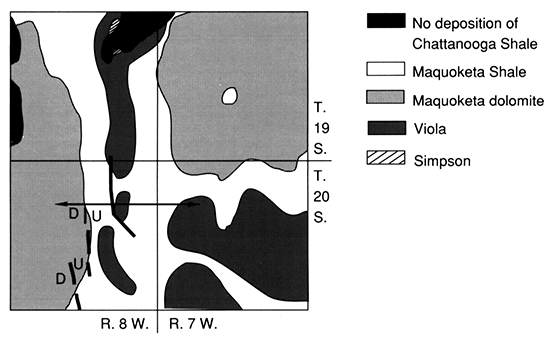
Figure 6--Subcrop map at the pre-Chattanooga unconformity. Dark areas indicate where Chattanooga Shale is absent due to later erosion at the basal Pennsylvanian unconformity. Subcropping Viola in the southeast quadrant of the map expresses the axis of the east-west-trending McPherson Valley. Map is 12 x 12 mi (19.3 x 19.3 km). Location of the seismic line is marked by the double-arrow line.
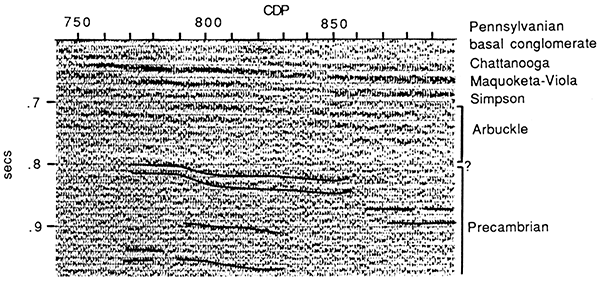
The seismic response of the Precambrian section is poor, and reflections fade in and out with data quality (fig. 3A). The contact between Precambrian and Arbuckle dolomites is not seen on the section. Gravity and aeromagnetic information suggest that the top of the Precambrian in this area is Upper Keweenawan (Proterozoic) Rice Formation arkosic sandstones (Scott, 1966; Yarger, 1983; Yarger and Lam, 1982). According to COCORP results in northeastern Kansas (Brown et al., 1983; Serpa et al., 1984), this unit may contain few good reflectors. Thinning of a layer in the Rice Formation seen on the seismic section (fig. 7, CMP's 770-885, 0.800 to 0.840 sec) implies that the Lyons anticline existed during the Later Proterozoic with its initial uplift related to Keweenawan rifting.
Figure 7--Detail of the Precambrian Rice Formation reflections between CMP's 740 and 900 (600-1,000 msec). Uplift of the anticline is indicated by dipping and thinning of the Rice Formation reflections.
The Cambrian-Ordovician Arbuckle Group is expressed seismically as a series of continuous, high-amplitude, parallel reflections (fig. 3, CMP's 185 to 290, 0.700 to ~0.800 sec and CMP's 730 to 780, 0.680 to ~0.800 sec). Divergence of the reflections away from the Lyons anticline suggests that deposition of the Arbuckle was contemporaneous with uplift of the anticline.
Above the Arbuckle, the seismic character of the Middle Ordovician Simpson Group is a trough of constant time thickness. It has a "noisy" character due to interbedding of shales, sandstones, and dolomites within the group. It is bracketed by strong positive-polarity peaks of the Middle Ordovician Viola above and Cambrian-Ordovician Arbuckle below. The Simpson Group response is distinguished from that of the lower part of the Devonian-Mississippian Chattanooga Shale because the seismic character of the Chattanooga Shale is a clean, relatively noise-free, trough event. The velocities of the Upper Ordovician Maquoketa are intermediate between the low-velocity Chattanooga above and the high-velocity Viola below. Consequently, the Maquoketa and Viola form a single response of a transitional, stretched (low apparent frequency) peak. This character is one of the strongest positive events on the section. The Maquoketa-Viola subcrops at the pre-Chattanooga unconformity at about CMP 690 (fig. 8). Figure 8 also illustrates the general seismic response of the Cambrian-Ordovician section.
Figure 8--Detail in the vicinity of the Lyons anticline showing structures related to Late Mississippian-Early Pennsylvanian deformation. Correlation with three synthetic seismograms is shown.
In this region, the Chattanooga Shale contains a thin limestone with a maximum thickness of about 70 ft (21 m) and thins eastward. Maximum thickness of the localized limestone within the Chattanooga (Lee, 1956) corresponds to the western edge of the seismic section. The limestone is missing under the eastern edge, being replaced by siltstones. The Chattanooga Shale is split into an upper and lower part by the limestone member. Throughout the section, the lower Chattanooga Shale maintains a constant time-thickness except where it is eroded over the Lyons anticline at the basal Pennsylvanian angular unconformity. The Misener Sandstone, the transgressive sandstone at the base of the Chattanooga Shale, is known from well control to be present in the vicinity of the Lyons anticline and westward from that point. Although it thins significantly eastward from the anticline, it is not seen in the seismic reflection character of the lower Chattanooga.
The Chattanooga limestone unit is one of the brightest positive-polarity reflections of the section where it is at its thickest, about 58 ft (18 m), at about CMP 800 (0.650 sec) (fig. 7). As the limestone thins eastward, the amplitude response dims. This is particularly apparent following the zones of excellent data quality (i.e., under CMP's 740-900, 1200-1240, and 1340-1420; figs. 8 and 9). Near CMP 1300 and eastward, the amplitude response of the Chattanooga limestone is very dim. It is either very thin or replaced with siltstone at this point. Westward of CMP 800 the Chattanooga limestone is locally truncated by erosion over the crest of the Lyons anticline. Westward from the Lyons anticline, the limestone member appears to thicken so as to be about the same thickness at CMP 300 as it is at CMP 800; i.e., it is about 58 ft (18 m), as estimated from amplitude response (fig. 3).
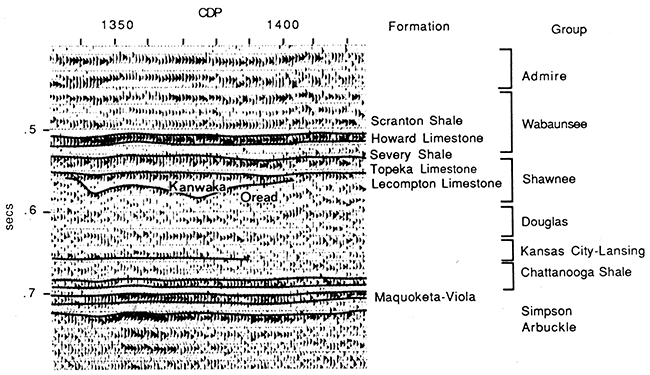
Figure 9--Detail of the eastern end of the seismic line showing stratigraphic relationships of Arbuckle through Wabaunsee groups. Channel, presumably sand-filled, in the Kanwaka Shale shows erosion through several units to the Oread Limestone.
The upper Chattanooga Shale is expressed seismically as a broad pronounced trough. Eastward of CMP 1140, it begins to thicken dramatically. At CMP 1280 it bifurcates and a small intermediate peak (an artifact of the seismic wavelet) appears in its middle (fig. 9).
The unconformity at the base of the Pennsylvanian is a low-amplitude event most easily identified by angular truncation of underlying strata. The Missourian-age Kansas City-Lansing and Virgilian-age Douglas Groups form a sequence of reflections having low amplitude and low continuity. This is probably indicative of parallel to slightly folded bedding that is characteristic of dominantly nonmarine clastic deposition by river currents and associated marginal-marine transport processes (Brown and Fisher, 1979). The interpretation is in general agreement with known stratigraphy of channel sandstones and shelf-margin limestone lenses and oolitic shoals that occur within these lower cyclothem units (Merriam, 1963). The Kansas City and Lansing Groups are composed primarily of limestone. Interbedded shales are too thin to be detected seismically. The Douglas Group is made up almost entirely of shales and channel sands. Similar to some of the interpretation given by Knapp and French (1991) and Knapp et al. (this volume, p. 53-56), marine limestone mounding, thin undetectable shales, and extensive erosional hiatuses combine to produce slightly chaotic, diffusive reflector characteristics for the given wavelength of the data, resulting in only nominal reflection amplitude for the three groups.
In the Shawnee Group (Virgilian), the Topeka and Lecompton limestones have modest-but-apparent seismic response. The intervening Calhoun Shale can be seen to vary across the section. Of particular interest in the Shawnee Group between CMP's 1330 and 1410 is a possible channel in the Kanwaka Shale (fig. 9). This anomaly helps illustrate the quality of the data.
In the Wabaunsee Group (Virgilian), the Howard Limestone forms one of the more prominent peaks on the section (fig. 9). Above the Scranton Limestone is the Stotler Limestone (fig. 10). Between these two limestones is a sequence of several discontinuous thin limestones and shales. In some cases interference of the reflections is constructive but in others it is destructive. The overall effect is a variable reflection character.
Figure 10--Detail showing stratigraphic relationships of Wabaunsee through Council Grove groups. Interference patterns of thin shales and limestones create variable amplitude and character reflectors of the Admire Group and Foraker Limestone formation. The Nolan Limestone illustrates a stretched amplitude due to a transitional boundary.
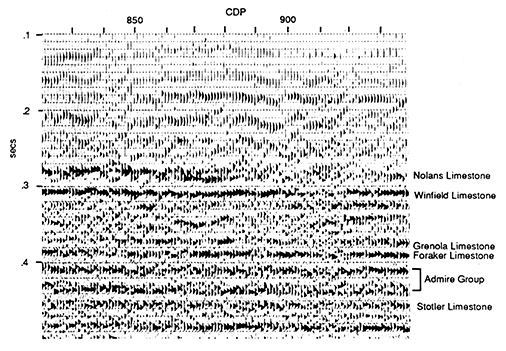
The Admire, Council Grove, and Chase Groups of the Lower Permian produce reflection configurations that are similar to the high-amplitude continuous reflections of the Wabaunsee (fig. 10). Although individual thin beds may be unresolved, the high continuity of the reflections indicates lateral consistency of the reflectors across the section.
The seismic data basically confirm the interpretations derived from point-derived well geology. However, the continuity of the seismic line provides detailed resolution of the position and character of the stratigraphic and structural relationships. Reflectors of the Proterozoic Precambrian section are seen to have distinguishable characteristics that lend to the interpretation of structure and local stratigraphic continuity.
The growth history and geometry of the Lyons anticline is accurately expressed on the seismic section. The anticline was a large symmetric positive feature during Cambrian and Ordovician time and, perhaps, during late Precambrian. The crest was eroded prior to Simpson deposition, and growth was reactivated during Late Mississippian to Early Pennsylvanian as a smaller, asymmetrical, and highly folded and faulted positive feature. The basal Pennsylvanian angular unconformity truncates several lower Paleozoic units over the crest of the Lyons anticline.
The Chattanooga limestone is continuous across the section except where it subcrops at the Lyons anticline. It thins from west to east and is replaced in the vicinity of CMP's 1350 to 1360 by lithologies of lower seismic velocities (i.e., siltstones or shales).
Most resolvable Pennsylvanian and Permian cyclothems display consistent reflection character across the section, although bed thickness can be highly variable due to intercyclic erosion. In particular, the stratigraphic intervals between the Lecompton Limestone and the Calhoun Shale, and the Topeka Limestone and Severy Shale are very variable. These thickness variations have short wavelengths and cannot be detected (or confirmed) by well control.
The advantage of the seismic detail is particularly illustrated by the display of the channel in the Kanwaka Shale. This channel is a potential producing reservoir, yet without the seismic line, detection by wells alone would have been solely by chance, and identification of its extent and character would have been impossible.
Barbier, M. G., Bondon, P., Mellinger, R., and Viallix, J. R., 1976, Mini-SOSIE for land seismology: Geophysical Prospecting, v. 24, p. 518-527
Brown, L., Serpa, L., Setzer, T., Oliver, J., Kaufman, S., Lillie, R., Steiner, D., and Steeples, D. W., 1983, Intracrusta1 complexity in the United States midcontinent--preliminary results from COCORP surveys in northeastern Kansas: Geology, v. 11., p. 25-30
Brown, L. F., and Fisher, W. L., 1979, Principles of seismic stratigraphic interpretation: American Association of Petroleum Geologists, table 5.2; in, Seismic Stratigraphy, R. E. Sheriff, ed. (1980): International Human Resource Development Corporation, Boston, p. 105-106
Harris, R. L., Stone, J. J., King, C. R., James, Alfred III, and Goebel, E. D., 1966, Type logs of Kansas, 1966, Rice County: Kansas Geological Society
Knapp, R. W., and French, J., 1991, Features in Kansas cyclothems seen by high-resolution reflection seismology; in, Sedimentary Modeling--Computer Simulation and Methods for Improved Parameter Definition, E. K. Franseen, W. L. Watney, C. G. St.C. Kendall, and W. C. Ross, eds.: Kansas Geological Survey, Bulletin 233, p. 111-121 [available online]
Lee, W., 1956, Stratigraphy and structural development of the Salina basin area: Kansas Geological Survey, Bulletin 121, p. 1-151 [available online]
Merriam, D. F., 1963, The geological history of Kansas: Kansas Geological Survey, Bulletin 162, 317 p. [available online]
Roehl, N. L., Knapp, R. W., and Newell, K. D., 1989, Seismic-reflection study in Rice County, Kansas; in, Geophysics in Kansas, D. W. Steeples, ed.: Kansas Geological Survey, Bulletin 226, p. 81-93 [available online]
Scott, R. W., 1966, New Precambrian (?) formation in Kansas: American Association of Petroleum Geologists, Bulletin, v. 50, p. 380-384
Serpa, L., Setzer, T., Farmer, H., Brown, L., Oliver, J., Kaufman, S., Sharp, J., and Steeples, D. W., 1984, Structure of the southern Keweenawan rift from COCORP surveys across the Midcontinent Geophysical Anomaly in northeastern Kansas: Tectonics, v. 3, p. 367-384
Yarger, H. L., 1983, Regional interpretation of Kansas aeromagnetic data: Kansas Geological Survey, Geophysics Series 1, 35 p. [available online]
Yarger, H. L., and Lam, C., 1982, Gravity measurements in Kansas; in, Assessment of the Geothermal Resources of Kansas, D. W. Steeples and S. A. Stavnes, eds.: U.S. Department of Energy, Final report, Contract no. DE-AS07-79ET27204, p. 220-232
Previous--Depositional and Stratigraphic Analysis of Kansas City Group Strata || Next--Seismic Response of Pennsylvanian Cyclothems
Kansas Geological Survey
Comments to webadmin@kgs.ku.edu
Web version placed online Aug. 25, 2015. Original publication date 1995.
URL=http://www.kgs.ku.edu/Publications/Bulletins/237/Haraldson1/index.html