Kansas Geological Survey, Bulletin 233, p. 415-430
by
W. Lynn Watney, Jan-Chung Wong, and John A. French, Jr.
Kansas Geological Survey
We describe a personal computer-based one-dimensional process (forward) stratigraphic model that simulates Upper Pennsylvanian marine carbonate-dominated cycles on a ramp shelf in western Kansas. Here we describe the logic and methodology behind the model, key concepts and parameters used in modeling, and three examples. The model parameters include a glacial-eustatic curve, tectonic subsidence, and sedimentation rates. The Pleistocene sea-level curve serves as a proxy to Pennsylvanian sea level, as used in the present model. Pennsylvanian sedimentation is estimated according to potential accumulation rates of Recent sediments. Rapid sea-level rise leads to attenuation of carbonate sedimentation, and the associated increased productivity of organic matter often results in black shale accumulation, a hallmark of the Pennsylvanian cycles. Simulation of cycles could prove useful in predicting petroleum reservoir development as sophistication of the modeling and knowledge of the processes increase. Inverse techniques will be useful to this end so that parameters can be obtained that permit models to depict characteristics of individual cycles more precisely and accurately.
An Acrobat PDF file containing the complete paper is available (1.2 MB).
Accuracy and precision in geologic modeling are of increasing concern in geologic applications, such as petroleum reservoir characterization. Current approaches in reservoir characterization consist of (1) observations of rocks and measurement of properties (the deterministic approach); (2) analysis and graphic depiction of geometries and spatial relationships of geologic properties established through structural geologic analysis, stratigraphy, and sedimentology (educated aiming); and (3) a stochastic approach that involves statistical estimations of the probable occurrences of rock properties (formalized guessing) (Halderson and Damsleth, 1990). The last two approaches are used to estimate properties that cannot be estimated with deterministic methods because of limited data or level of interpretations. Reservoir characterization traditionally has been a nonquantitative approach and has been referred to by those in other disciplines as soft data.
Quantitative geologic modeling can improve the accuracy and precision of geologic predictions needed to keep pace with the demands on geologic interpretation in petroleum reservoir characterization and recent developments in engineering and statistical modeling. Optimistic developments in geologic simulation include (1) continued refinements in understanding ancient sedimentary rocks in four dimensions by employing concepts and methods of sequence stratigraphy to three-dimensional data bases; (2) successful process (forward) modeling of sedimentation, stratigraphy, structure, and diagenesis using improved understanding of causal mechanisms (Cross, 1989); (3) the potential combination of forward modeling with stochastic modeling to generate variations in properties and features in areas where scale problems or limited data make understanding of the geologic system incomplete; and (4) continued study of the Recent sedimentary record with a focus on processes acting through time.
In this article we describe the initial version of a forward (process-response) stratigraphic simulation model developed to examine the origin of cyclicity in Upper Pennsylvanian (Missourian) carbonate-dominated strata in the subsurface of western Kansas (fig. 1). Individual cycles in these strata have been correlated lithostratigraphically and biostratigraphically over the central United States in both the surface and subsurface (Heckel, 1980; Watney, 1984; Boardman and Heckel, 1989). The widespread distribution of these cycles and an extensive subsurface and surface data base provide three-dimensional control and support the quest to quantify critical parameters of regional processes used in modeling and prediction of stratigraphic and sedimentologic attributes of these cycles.
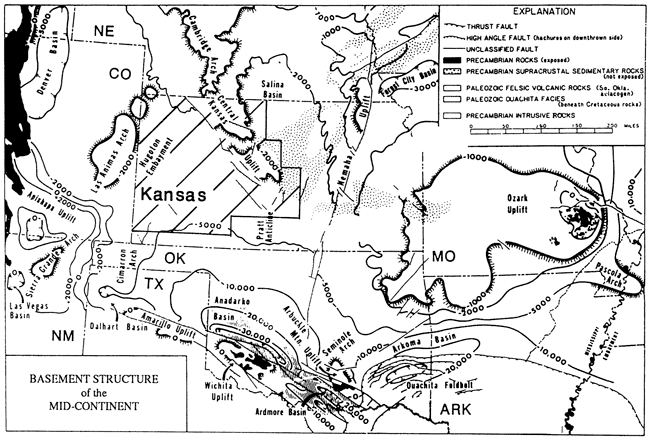
Figure 1--Configuration of the Precambrian basement in the southern midcontinent [from Rascoe and Adler (1983)]. Area of investigation outlined in western Kansas. The Anadarko basin was an active foreland basin during the Late Pennsylvanian. Rapid subsidence led to sediment-starved conditions in the western sector in the Texas and Oklahoma panhandles. Western Kansas was a broad carbonate-dominated shelf.
The model obviously assumes that these variables can be extracted from the geologic record. Information to date provides only approximation to these variables. The challenge before us in acquiring these data is significant (Kendall and Lerche, 1988). The models provide the basis to test and examine these variables as they are understood better. Moreover, the models help to focus on avenues of data collection that are useful in improving parameter definition.
Pennsylvanian strata in the midcontinent United States contain significant oil and gas reservoirs (Watney et al., 1989). Nearly 9 billion barrels of oil and more than 2 trillion cubic feet of gas have been produced from Pennsylvanian strata in the midcontinent (Rascoe and Adler, 1983). An estimated one-fifth of Kansas's 2.4 billion barrels of unswept mobile oil remains in Pennsylvanian reservoirs, isolated from producing wells because of reservoir heterogeneity (BPO/Toris data base). An estimated one-fourth of the oil and gas ultimately produced from the midcontinent will come from smaller and more subtle Pennsylvanian reservoirs whose porosity is controlled primarily by depositional and diagenetic processes (Watney et al., 1989). Economic interest in better characterization and modeling of these remaining reserves provides significant incentive to develop and test quantitative techniques. Moreover, improved understanding of the regional and local processes that controlled the makeup of these cycles can likely be obtained through iterative modeling efforts. As the data base and interpretations improve, quantitative models can progressively become more accurate and precise.
In this article we describe (1) the logic and methodology used in the development of the model, (2) key concepts and parameters related to the modeling of midcontinent sequences, and (3) a model run tailored to Upper Pennsylvanian (Missourian) cycles observed on the western Kansas shelf.
The one-dimensional model described here was written in Turbo Pascal by J. C. Wong and runs on an IBM-compatible personal computer. The model closely resembles the Fischer plot format introduced by Fischer (1964). This graphic format has been followed in other one-dimensional models [e.g., Read et al. (1986)]. Turcotte and Willemann (1983) provided an important conceptual influence for the model presented here. Our model utilizes primitive Pascal graphics, which increase the portability of the program. The system requirements include a graphics board and a Hewlett-Packard plotter, if a paper copy of the output is desired. The program is written in modular form to facilitate ongoing modifications. Each model run is a one-dimensional simulation, a reconstruction of deposition occurring at a single geographic position on a shelf or in a basinal setting.
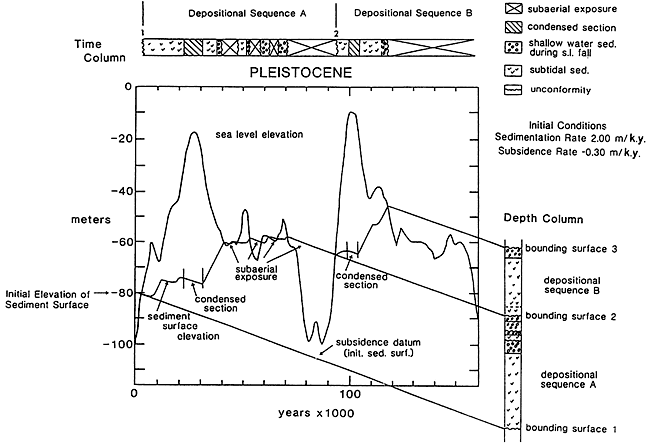
The graphic output displays elevation of the initial sediment surface, the slope of which is cumulative subsidence; elevation of the sediment surface reflecting sediment accumulation and subsidence; and sea-level history (fig. 2). The program begins by requesting the number of sedimentary cycles to be simulated, the values of subsidence rate and average potential sediment accumulation rate, and sea-level history for each cycle of sedimentation. Sea-level curves are entered from the keyboard or from a digitized file. The elevation of the initial sediment surface at the start of the first cycle is also requested at the initiation of the program. Subsequent initial elevations of the sediment surface of succeeding cycles are generated from results of the proceeding cycle. At each time step a current sediment accumulation rate is calculated (described later) at a given location according to a combination of rate of sea-level change, subsidence rate, water depth, and initial potential sediment accumulation rate.
Figure 2--Graphic output of a model simulation for a Pleistocene example. Axes are depth and time. Curve is eustatic sea level estimated from δ18O curve. Diagonal lines represent initial sediment surfaces of succeeding cycle and depict constant subsidence through time. A sediment curve above them represents sediment added during the cycle. Reduced sedimentation resulting from water-depth or rapid sea-level rise results in accumulation of a condensed section. Depth and time stratigraphic columns are manually added with facies derived from water depth.
The difference between elevations of the current sediment surface and sea level is either water depth or elevation of the sediment surface above sea level (emergent). Water depth interpolated in this phase of the program is used to calculate an effective sediment accumulation rate at each time step.
The program performs calculations in time steps of 10,000 years (10 k.y.). The input elevations are in meters. Zero elevation represents maximum inundation; all other elevations are negative. Subsidence, represented graphically in the model by a decreasing initial sediment surface elevation, is expressed and input as a negative slope.
The initial potential sediment accumulation rate input at the beginning of the program is modified by water depth and the rate of change in sea level to produce an effective sediment accumulation rate. The potential sediment accumulation rate is reduced by rapid increases in relative sea level (combination of sea level and subsidence rates) or is greatly reduced in deep water. Alternatively, the potential sediment accumulation rate is increased in shallow water. The dependent variables used in calculating this effective sediment accumulation rate are (1) the initial potential sediment accumulation rate provided as input when the programs begins), (2) the current sediment accumulation rate calculated in the previous time step, (3) the current subsidence rate (a constant linear rate provided as input for each cycle of sedimentation), (4) a reduction factor (used to reduce sedimentation during rapid rise in relative sea level), (5) the sea-level and sediment elevations at an existing time step (sea level is interpolated from that provided at input and sediment surface elevation is obtained from the previous time-step calculation), and (6) water depth.
The current sediment accumulation rate is first derived by calculating water depth at the current time step (Schlager, 1981; Hallock and Schlager, 1986). If the water depth is greater than 50 m (160 ft), the sediment accumulation rate is set equal to 0.01 m/k.y. (0.03 ft/k.y.). This depth is essentially the base of the euphotic zone below which indigenous carbonate accumulation is negligible, that is, where the sediment accumulation rate is very slow. If the water depth is between 0 and 3 m (0 and 10 ft) and sea level is falling, the sediment accumulation rate is set equal to 2 m/k.y. (7 ft/k.y.). This high rate of sedimentation is introduced to reflect greater sediment production associated with many shoal-water settings (Schlager, 1981). If the water depth is greater than 3 m but less than 50 m (10-160 ft), the user sets the sediment accumulation rate equal to the initial potential sediment accumulation rate input.
The sediment accumulation rate is reduced by rapidly rising sea level. When sea level is above the sediment surface and is rapidly rising and when the water depth is less than 50 m (160 ft), the current sediment accumulation rate is modified by a reduction factor, resulting in a new sediment accumulation rate:
Uns = USR - |Usub|, (1)
where Uns is the new sediment accumulation rate (m/k.y.), Us is the current sediment accumulation rate (m/k.y.), Usub is the subsidence rate (m/k.y. = constant), and R is the reduction factor.
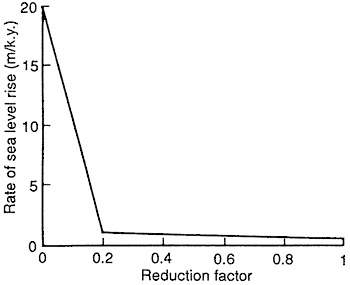
The reduction factor is a step function of sea-level change (fig. 3). As the rate of sea level increases, the sedimentation rate is reduced accordingly until the rate of sea-level rise equals 20 m/k.y. (66 ft/k.y.). Above a 20-m/k.y. rate of sea-level rise, sedimentation is stopped. The ranges of each step are arbitrary other than the general relationship that the rapid rises in sea level, such as those associated with glacial eustasy, greatly reduce carbonate sedimentation (Hallock and Schlager, 1986). This will be discussed later. The net result is that a rapid rise in sea level results in reduced sedimentation and thus in an increase in accommodation space for later sediment accumulation. The ranges in the time steps are (1) for rates of sea-level change less than 0.5 m/k.y. (1.6 ft/k.y.), R = 1 (i.e., no change in the current sediment accumulation rate); (2) for rates of sea-level change between 0.5 and 1 m/k.y. (1.6-3.3 ft/k.y.), R varies linearly between 1 and 0.2; (3) for rates of sea-level change between 1 and 20 m/k.y. (3.3-66 ft/k.y.), R varies linearly between 0.2 and 0.
Figure 3--Reduction factor applied to potential sediment accumulation rate plotted against rate of sea-level rise. Rapid rise in sea level leads to reduction of potential sediment accumulation rate.
Further conditions for modifying sediment accumulation rate occur when sea-level elevation falls below the sediment surface. Erosion of the sediment surface is not included in this version of the model. When the sediment surface elevation is above sea level, the elevation of the sediment surface simply declines at a rate equal to subsidence.
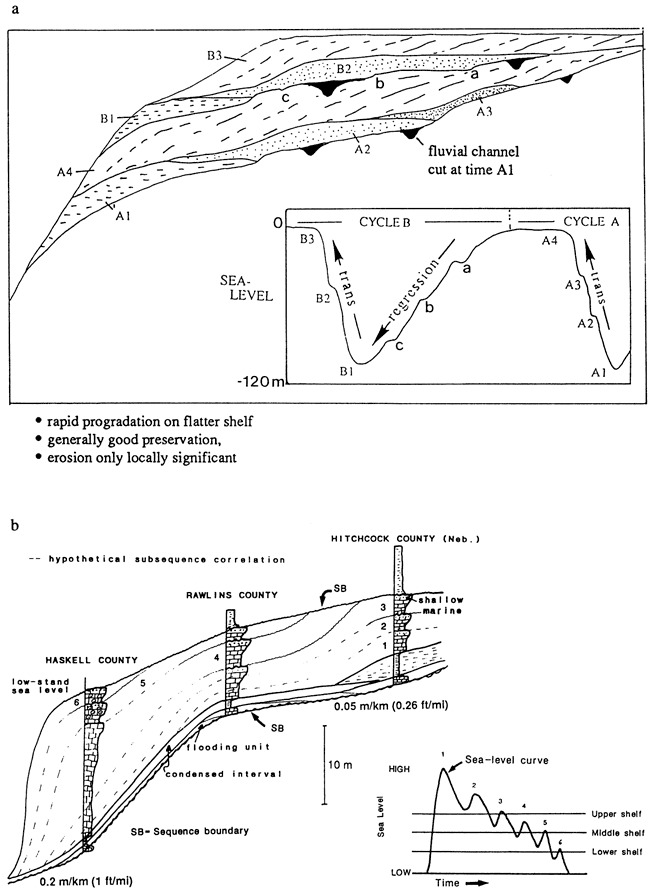
The parameters used in this model are derived from Pennsylvanian strata in the midcontinent, from Quaternary stratigraphic records, and from processes inferred from modern and Quaternary cycles. Quaternary coastal sedimentary cycles are similar in geometry and facies succession to Pennsylvanian shelf cycles in the midcontinent (fig. 4) (Carteret al., 1986).
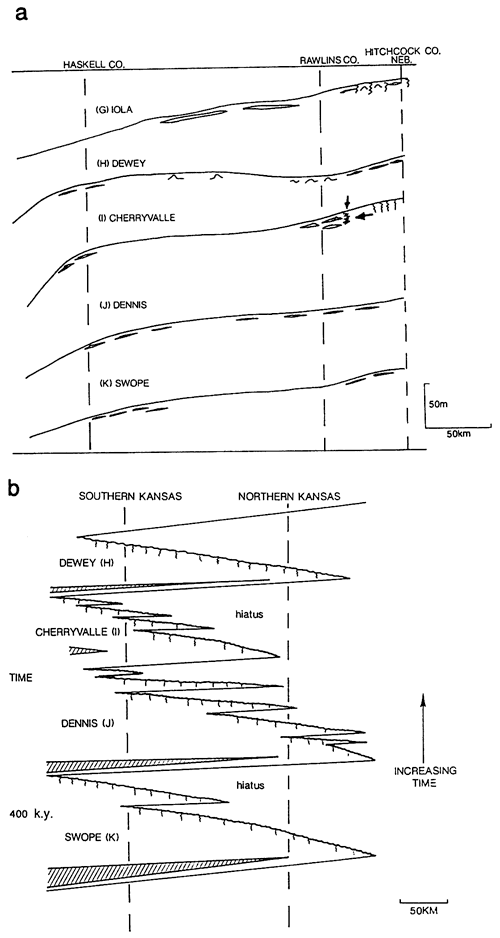
Figure 4--(a) Conceptual model of Quaternary coastal sedimentation in the Pacific region responding to two cycles of eustatic rise [from Carter et al. (1986)]. Flooding units (A1, A2, A3, B1, B2), condensed section (diastemic marine surface separating flooding units and highstand deposits), and prograding highstand deposits characterize each cycle. Each cycle is bounded by subaerial exposure and limited erosion on the upper shelf. (b) Conceptual model of Upper Pennsylvanian (Missourian) carbonate shelf cycle from ramp setting in western Kansas [from Watney et al. (1989)]. Flooding unit (thin carbonate rock), condensed section (commonly black shale or diastemic surface on Central Kansas uplift), and shallowing-upward (highstand) carbonate deposit typify major cycles. Minor cycles punctuate the larger cycle with estimated correlations shown for minor cycles. Basinward is sediment-starved setting. Landward limit is not shown because it is presently beyond available control.
The parameters used in modeling the Pennsylvanian cycles are categorized into six groups: (1) characterization and interpretation of temporally distinct stratigraphic units, (2) estimates of subsidence across the western Kansas shelf during the Late Pennsylvanian, (3) estimates of elevation across the Pennsylvanian shelf and magnitude of sea-level change, (4) characteristics of Pennsylvanian eustasy, (5) sea-level history estimated from Quaternary analogues, and (6) sediment accumulation rates from Recent and Quaternary analogues.
Inversion techniques to estimate processes systematically from the ancient record have yet to be developed for these Pennsylvanian cycles. Only then can the models be tailored more precisely to the observations and more useful, detailed results obtained. Until this is done, the models can provide only a rough approximation of how the processes can potentially interact to produce the observed cyclicity.
Delimiting temporally distinct depositional units (depositional sequences) bounded by unconformities is essential to resolving time- and rate-dependent parameters from these strata. Depositional sequences also make possible more precise paleogeographic and lithofacies reconstructions, which are useful in refining estimates of the model parameters such as water depth and sediment accumulation rates. Regional, temporally significant depositional sequences (referred to here as cycles) range from a few meters to 30 m (100 ft) in thickness over what was an extensive shelf in western Kansas (fig. 5) (Watney, French, and Franseen, 1989). These cycles comprise dominant, usually more easily recognized divisions of the Missourian strata and fit the standing definition of depositional sequences (Mitchum, 1977). They are bounded by regional unconformities over much of the shelf. Stratal pattern and lithofacies are predictable. The cycles provide the means to establish a detailed chronostratigraphic framework. In general, each cycle consists of (1) a thin flooding unit at or near the base, typically consisting of a thin limestone; (2) a condensed section that is often characterized by the accumulation of organic matter, thought to have been slowly deposited during rapidly deepening or deep-water conditions, e.g., highly radioactive black shale; (3) a shallowing-upward carbonate that is the thickest and most visibly complex member of the cycle, often characterized by internal deepening-shallowing minor cycles; and (4) widespread paleosol development immediately beneath the upper boundary of the cycle indicative of emergence of the shelf, typical of these cycles in the northern midcontinent.
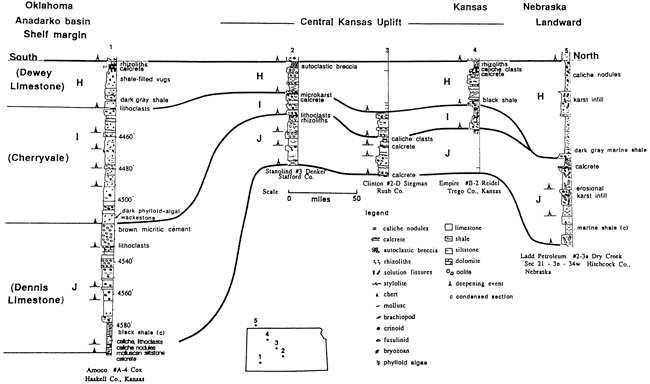
Figure 5--Sequence stratigraphy of Upper Pennsylvanian Kansas City Group, western Kansas, based on five cores. Section is hung on the flooding unit of an overlying cycle. Three carbonate-dominated cycles (H, 1, J) are shown bounded by subaerial unconformities. Upward-pointing arrowheads indicate bases of minor cycles. Well 1 is in lower shelf showing greater thickness and more complexity to cycle development. Wells 2 through 4 are situated on positive Central Kansas uplift. Well 5 is at the highest shelf setting, exhibiting evidence for more intense subaerial exposure and shallower water carbonate facies. The I cycle laps onto the upper shelf, also indicating a higher shelf setting. The J cycle on the lower shelf includes regionally extensive oolitic grainstone deposits indicative of a ramp configuration [see Watney (1985)]. Each major cycle contains a thin flooding or transgressive unit, a condensed section, and a shallowing-upward highstand carbonate package. This is overlain by a thin siliciclastic unit that thickens northward toward a shelf source. The siliciclastic unit is commonly a thin paleosol on the uplift. The condensed section is commonly represented only by a diastemic surface separating the flooding unit from the highstand deposits on the Central Kansas uplift. Additional minor cycles present in the south suggest increased fidelity as a result of greater sediment accommodation space.
The vertical succession of genetic units can be readily discerned in core and can be correlated to modern wire-line logs (fig. 6) (Watney, 1979; Watney et al., 1990). The cycles and their genetic units have been traced laterally through some 40 cores and 2,200 well logs covering 186,000 km2 (71,800 mi2)of this shelf. The resulting geometries and facies provide a framework for characterizing petroleum reservoirs that are commonly developed in the shallowing-upward carbonate units.
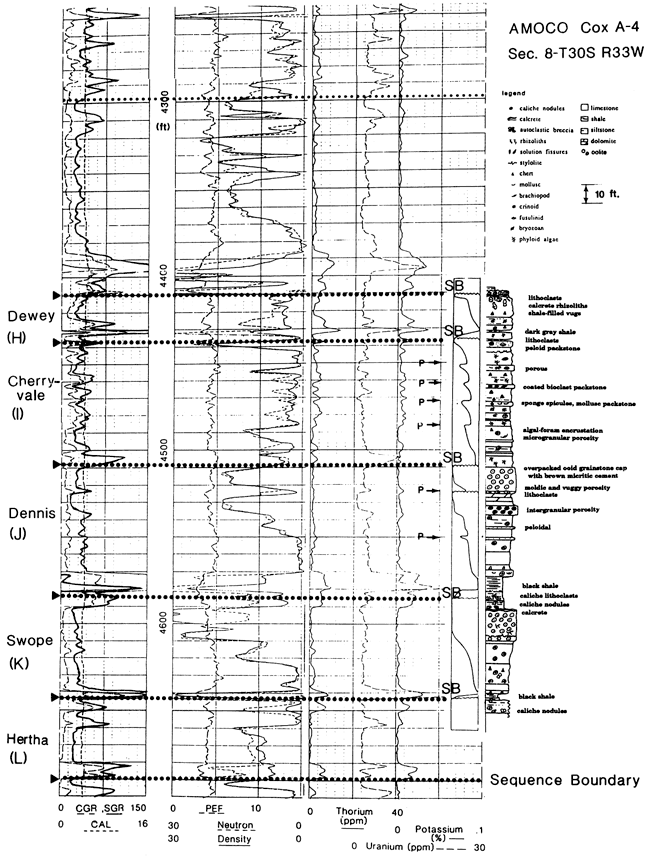
Figure 6--Gamma-ray, neutron-density, and uranium, thorium, and potassium profiles and graphic core description of H, I, J, and K cycles in the Amoco Cox A-4 well (well 1 in fig. 5). Well is located in a lower shelf position. Sequence (cycle) boundaries are indicated by dotted horizons. These are characterized by subaerial exposure. The letter P and accompanying arrows indicate bases of minor cycles that punctuate the major cycles (compare with well 1 in fig. 5).
The changing configuration of the Upper Pennsylvanian shelf from cycle to cycle in western Kansas has been described by Watney (1984, 1985) and Watney, French, and Franseen (1989). The shelf varied between rimmed platform and ramp settings during successive sedimentary cycles apparently because of changes in rates and spatial distribution of subsidence. The Anadarko basin bordering the shelf to the south was apparently subsiding rapidly enough to maintain sediment-starved conditions in western Oklahoma and the Texas Panhandle during the Late Pennsylvanian (Watney et al., 1989, fig. 20, pp. 26-27). Maximum average subsidence in the Anadarko basin, as estimated by Dickinson and Yarborough (1979) exceeded 0.2 m/k.y. (0.7 ft/k.y.). The Anadarko basin was a hybrid foreland basin that subsided at least in part because of overthrusting of crustal blocks now exposed in the Wichita Mountains in western Oklahoma [8-9 km (5.0-5.6 mi) of thrusting according to Brewer et al. (1983)]. Seismic stratigraphy and other subsurface studies suggest that relief across the shelf margin of the Anadarko basin was in excess of 300 m (1,000 ft) during the Late Pennsylvanian (Kumar and Slatt, 1984). The relief along the basin margin was apparently sustained because of high subsidence rates in the basin.
Estimates of average subsidence across the shelf in western Kansas during the Missourian range from 0.05 m/k.y. (0.2 ft/k.y.) on the north to 0.2 m/k.y. (0.7 ft/k.y.) on the southern margin of the shelf near the Anadarko basin (Kluth, 1986). The average subsidence in this type of setting probably includes episodes of rapid thrust-induced downwarp followed by longer periods of reduced subsidence rates (Quinlan and Beaumont, 1984). The precise duration or magnitude of these tectonic episodes is not known, although durations of thrusting events along the Cretaceous Sevier thrust in Utah, as deduced from sedimentologic studies, roughly spanned millions of years and were episodic rather than periodic. Recently, forward modeling of thrusting in the Sevier belt has used thrusting events lasting from 0-2 m.y. to 4-6 m.y. and quiescence from 2-4 m.y. to 6-8 m.y. (Fleming and Jordan, 1990). Subsidence in the Cretaceous foreland basin occurred within 300 km (190 mi) of the thrust belt, with small-scale upwarps developing 500 km (300 mi) inboard of the craton (Beaumont, 1981). Maximum distance inboard (northward) from the area of Pennsylvanian thrusting in the midcontinent was 450 km (280 mi) from the Wichita Mountain front.
Cycles that show notable thickening toward the Anadarko basin are inferred to have been deposited on a sloping shelf based on several lines of evidence (Watney, 1985). Abrupt changes in this pattern of basinward thickening coincide in part with changes in composition, structure, and age in the Precambrian basement and resemble patterns observed in other areas (Baars, 1966). Positive relief of the upper (northern) shelf is supported independently through recognition of (1) the loss of the widespread black organic-rich marine shales over the upper shelf and over the more prominent uplifts; (2) a greater proportion of shallow-water carbonate facies in each cycle over upper shelf and uplifts; and (3) evidence for sustained and relatively intense periods of subaerial exposure and oxidation across the upper shelf, for example, deep karstification and extensive autobrecciation (DuBois, 1985) and red paleosols with multiple episodes of soil formation (Watney, 1980; Prather, 1985).
In more basinward shelf areas, where the rate of thickening is greatest, cycles exhibit regional accumulations of thick [up to 25 m (80 ft)] oolitic grainstone deposits, supporting the interpretation of widespread ramp conditions rimming the Anadarko basin (Watney, 1985). In contrast, cycles that exhibit no regional thickening trends on the shelf tend to be dominated by scattered micritic carbonate buildups with only local oolite development associated with local minor relief (Watney, 1985).
The minimum regional relief across the approximately 450-km-wide (280-mi-wide) Pennsylvanian shelf during times of ramp development is estimated by the range in thickness of an individual cycle, approximately 25 m (80 ft). The relief on the shelf used in the modeling is 50 m (160 ft).
The estimate of relative sea-level change is herein linked to estimates of relief across the shelf. The maximum lateral extent of these inundations is 450 km (280 mi) north of the Anadarko basin. The magnitude of the change in sea level would be constrained by the maximum elevation on this shelf reached by the shoreline and the lowest elevation that was subaerially exposed. Marine waters apparently covered the entire shelf for major cycles northward, beyond which data are available in southwestern Nebraska (Rascoe and Adler, 1983). Thus no upper shoreline has been identified for the major cycles. Less substantial marine cycles (e.g., I zone) lap onto the upper shelf and exemplify the lithofacies and stratigraphic framework associated with the shoreward onlap of a cycle (fig. 5). Estimated maximum water depth encountered in a cycle at the most northerly data site is roughly 20 m (70 ft).
The lowstand in sea level extended to the lowermost reaches of the shelf in western Kansas for all cycles of the Kansas City Group based on evidence of subaerial exposure seen in cores from the lower shelf (e.g., figs. 5 and 6) (Watney, 1985, K zone; Watney and French, 1988; Watney, French, and Franseen, 1989). Sea-level change on the western Kansas shelf is set at 70 m (230 ft) in the modeling runs based on relief of shelf [50 m (160 ft)] coupled with the additional 20 m (70 ft) of water depth estimated to have affected control points on the upper shelf (fig. 7). This appears to be a minimum estimate of sea-level change because equivalent cycles in the lower Kansas City Group in southeastern Kansas were deposited continuously over local depositional topography, which is estimated to have been 60 m (200 ft) and probably 100 m (330 ft) thick before compaction (Watney, French, and Franseen, 1989).
Figure 7--(a) Succession of south to north profiles of the western Kansas shelf during development of consecutive cycles of sedimentation. Relief is estimated from thickness and depositional and diagenetic facies of each cycle [see Watney (1985) and Watney et al. (1989)]. (b) South to north time-distance section showing relative sea-level inundations associated with major cycles of the Kansas City Group in western Kansas. Condensed sections are shaded; wavy lines at top of cycle are bounding surfaces that are subaerially exposed.
Upper Pennsylvanian sedimentary cycles are widespread on many shelf areas around the world (Veevers and Powell, 1987; Ross and Ross, 1987). The maximum duration of major cycles has been estimated as 400 k.y. (Heckel, 1986). Investigations by Boardman and Heckel (1989) use independent comparisons of ammonoid, conodont, fusulinid, and coral groups to provide correlations between 13 major Virgilian and Missourian cycles in the eastern shelf of the Midland basin and the northern midcontinent. Regional correlations confirm high-frequency synchronous marine inundations in both areas. Foraminiferal, ammonoid, and conodont zones have also been used by Ross and Ross (1987) to extend correlations of similar Pennsylvanian marine inundations globally.
Both Boardman and Heckel (1989) and Ross and Ross (1987) attribute these sea-level fluctuations to late Paleozoic continental glaciation. Glacial-eustatic control of these Pennsylvanian cycles has also been invoked by Wanless and Shepherd (1936), Wanless and Cannon (1966), Crowell and Frakes (1975), Heckel (1977,1986), Crowell (1978), Crowley et al. (1987), and Veevers and Powell (1987).
Broecker and Van Donk (1970), Imbrie and Imbrie (1980), Matthews (1984), and Williams (1988), among others, have determined that the δ18O curves of planktonic foraminifers from deep-sea cores of Pleistocene age closely coincide with changes in volume of glacial ice. As the lighter oxygen isotope is tied up in glaciers, the heavier 18O increases in ocean water. A 0.11‰ change in 18O is equal to a 10-m (30ft) change in sea level (Williams, 1988) (fig. 8).
Figure 8--Quaternary-age oxygen isotope record for two deep-sea cores obtained from the Caribbean (Denton and Hughes, 1983). Dates on right-hand side are thousands of years before present. Isotope curves are scaled in estimated meters of sea-level change. δ18O is related to volume of ice and resulting eustatic change. Rates of rise and fall are indicated in meters per 1,000 years for major cycles of rapid rise and slower fall in sea level. Also percentage of time is included for rising sea level on the left-hand side.
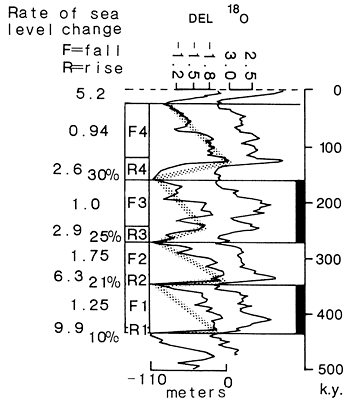
Asymmetric high-frequency (100 k.y.), high-amplitude 100+ m (330+ ft)] sea-level fluctuations characterize the late Pleistocene (<850,000 yr B.P.). Eustatic cycles typically begin with a rapid sea-level rise followed by slow, staggered falls (fig. 8). This pattern is thought to be a common feature of ice retreat and advance (Broecker and Van Donk, 1970) and is used here as a proxy for Pennsylvanian eustasy. The rates of rise during the last half-million years range from 2.5 to 10 m/k.y. (8.2-33 ft/k.y.), whereas the rates of fall in sea level during these cycles was generally less than 1 m/k.y. (3.3 ft/k.y.) (fig. 8). Such great rates and magnitudes of sea-level change make glacial eustasy a predominant mechanism that can significantly modify sediment accumulation.
In lieu of an inversion procedure to estimate a sea-level curve, a δ18O curve representing the last five Pleistocene cycles obtained from a Caribbean deep-sea core was digitized as an approximation of the sea-level history for the Pennsylvanian cycles. The dominant late Pleistocene periodicity in the δ18O curve is roughly 100,000 years. This cycle period was increased to 400,000 years to be more closely aligned with the duration of the average Pennsylvanian cycle. Maximum amplitude of sea-level change input into the model was set at 110 m (360 ft).
One potential sediment accumulation rate is used for a single carbonate-dominated sedimentary cycle in the model. This is obviously a rough approximation but appears to be realistic. Based on an extensive literature review, Schindel (1980) compared rates of sedimentation with constancy of sedimentation for several contrasting carbonate and siliciclastic depositional systems. Both the rates of sediment accumulation and the constancy of sedimentation vary by orders of magnitude in a depositional system. However, studies of Holocene shallow marine carbonate sedimentation suggest a smaller range in carbonate accumulation rates in this setting. Tidalites and oolites have a potential accumulation rate of ±1 m/k.y. (±3.3 ft/k.y.) (Schlager, 1981). Reef growth ranges from less than 1 m/k.y. (3.3 ft/k.y.) to greater than 10 m/k.y. (33 ft/k.y.). The average growth potential of a carbonate platform is approximately 1 m/k.y. (3.3 ft/k.y.) (Schlager, 1981). Potential accumulation rates used here range from one-fifth to one-third of Schlager's platform rate to produce thicknesses similar to those observed in the Pennsylvanian. If the duration of the Pennsylvanian cycles is considerably less than 400 k.y., as modeled here, the rates would be closer to 1 m/k.y. (3.3 ft/k.y.).
The potential sediment accumulation rate of the Pennsylvanian sedimentary cycle is modified according to different water depths and rates of sea-level change, as described earlier. Drowning of reefs and carbonate platforms, that is, much more reduced sedimentation, occurred during the rapid rise in sea level associated with the melting of continental glacial ice during the early Holocene (Hallock and Schlager, 1986). The rates of glacial-eustatic rise have also been recognized to exceed "keep up" carbonate systems (Sarg, 1988). The disruption of local conditions, such as changes in nutrient supply, biologic activity, and water circulation, led to an abrupt reduction in sediment accumulation rates and effectively resulted in what has been referred to as lag time, during which sediment accumulation is insignificant. The resulting diastemic (hiatal) surfaces have been recognized as bored hardgrounds, surfaces with crusts of ferromanganese oxides or elevated concentrations of phosphate or glauconite. Nondeposition, bioerosion, and evidence of reduced redox potential also indicate the nutrient excess associated with rising sea level (Hallock and Schlager, 1986). These surfaces are distinguished by their separation of shallow-water facies below from deeper-water facies above.
Sapropels, common to the Pennsylvanian cycles deposited in what was a tropical inland sea in the midcontinent, may be similar to Quaternary-age sapropels deposited during distinctive periods of sea-level rise (Coveney et al., 1991). The age of the classic sapropel deposit in the Black Sea sediments is 6,600 to 1,600 yr B.P. (Calvert et al., 1987). This sapropel is associated with the rapid late Pleistocene to early Holocene sea-level rise and not with the present stagnant, anoxic conditions. Elevated organic productivity is linked with rising water levels during the time that Mediterranean seawater began flowing into the Black Sea. This was also associated with increased freshwater influx into the Black Sea during climate change and the end of the ice age. Other sapropels have been dated in the eastern Mediterranean and Red seas and the Orca basin in the northern Gulf of Mexico at 12,000-8,000 yr B.P.; these sapropels are similarly associated with episodes of rapidly rising sea level and associated climate change (Rossignol-Strick, 1987). Rapid change in the state of the ocean-atmosphere system appears to have been an important factor leading to spatial increases in primary production of organic matter and its accumulation (Peterson and Calvert, 1990). Thus plausible conditions for black shale formation include dynamic conditions as well as the stagnant, anoxic conditions of bottom waters.
Two situations in the Pennsylvanian cycles suggest analogous conditions of increased primary organic production during abrupt rises in sea level. Diastemic surfaces separating clean shallow-water carbonates below from darker, often more argillaceous subtidal carbonates above are common within the shallowing-upward carbonate units of these Pennsylvanian cycles, suggesting perhaps abrupt deepening. Also, the thin flooding unit at the base of the cycles, reflecting a brief period of shallow marine deposition, is often sharply overlain by an organic-rich shale (condensed section) or more rarely by a dark, organic-rich carbonate from shallow to deeper water conditions.
Major cycles on high shelf positions and minor cycles in all shelf settings show inundation without the formation of black shale. Gray-green fossiliferous shales or shelly, phosphatic lag deposits are apparently equivalent to the black shales in these areas. In these cases the balance between the organic productivity and the oxidation of organic matter favored dysoxic to oxic conditions. A combination of lower magnitude and less sustained rates of rising sea level in these higher shelf settings could have led to conditions that did not favor black shale accumulation. In the high shelf settings a rise in sea level could have led to shallowing of the euphotic zone and temporary elimination of significant carbonate accumulation, resulting in a minor diastemic surface (flooding surface). Then, as the rate of rise diminished, carbonate sedimentation would again resume. At the far upper landward limit of the cycles, carbonate accumulation is essentially continuous during minor sea-level fluctuations.
In contrast, the black shales in lower shelf settings, such as in southwestern Kansas, are typically thick. The black shales here, where siliciclastic influx was minimal, probably represent extended periods of slow sedimentation in relatively deep water. Anoxic and dysoxic bottom conditions apparently continued beyond the period of flooding as a result of greater water depths and likely stagnant bottom conditions. Accordingly, carbonate sedimentation on the lower shelf did not begin until water depths sufficiently shallowed to reach the euphotic zone. Initial carbonate sedimentation that follows black shale deposition on the lower shelf is commonly dark and silty with abundant wisps of black clay and scattered red and amber organic macerals. Together this evidence suggests that elevated organic productivity or bottom stagnation was intermittent. Also, macrofossils are sparse in these basal carbonate units, and trace fossils such as Zoophycus are present in these dark basal carbonate deposits. Minor oscillations in sea level or changes in water circulation or climate apparently led to the episodic return to low-oxygen conditions of the bottom water before long-term carbonate accumulation was established.
Four Upper Pennsylvanian sedimentary cycles were simulated at three locations on the western Kansas shelf. These locations are located on a dip-oriented transect of this ramp crossing 70 m (230 ft) of relief. Only tectonics-driven subsidence is considered, ranging from -0.05 m/k.y. (-0.2 ft/k.y.) on the northern (upper) shelf location to -0.2 m/k.y. (-0.7 ft/k.y.) on the lower shelf (near the Anadarko basin). The eustatic record is the estimated curve from the late Pleistocene based on the δ18O record from planktonic foraminifers from a deep-sea core taken in the Caribbean (Broecker and Van Donk, 1970). The time scale of the Pleistocene record is expanded 4 times to make a cycle duration of 400,000 years. The magnitude of sea-level change is -110 m (-360 ft). The reference elevation (0 m) is maximum highstand in sea level. Calculations are based on 10-k.y. time steps. No erosion occurs during subaerial exposure, and no compaction is included. The sedimentary columns include flooding units, condensed sections, and subtidal and shoal-water carbonate deposits. The scale of the vertical columns is meters and the scale of the horizontal columns at the top of the plot is thousands of years. Comparisons with ancient units require 50% compaction of these results.
The model results are described in sequence, the first one for the upper shelf (fig. 9), then the middle shelf simulation (fig. 10), and finally the lower shelf (fig. 11).
Figure 9--One-dimensional computer simulation of Missourian cycles located on upper shelf in western Kansas. Horizontal axis is time in thousands of years; vertical axis is depth in meters. Process model runs from parameters described in the text and closely follows the example described and illustrated in fig. 2. Columns of sediment generated in time and at depth in the simulation are manually added according to depth-dependent carbonate facies. Starting elevation is -20 m (-66 ft), potential sediment accumulation rate is 0.2 m/k.y. (0.7 ft/k.y.), and subsidence rate is -0.05 m/k.y. (-0.2 ft/k.y.). Numbers of flooding, condensed intervals, and subaerial exposure surfaces generated are indicated below each depth column.
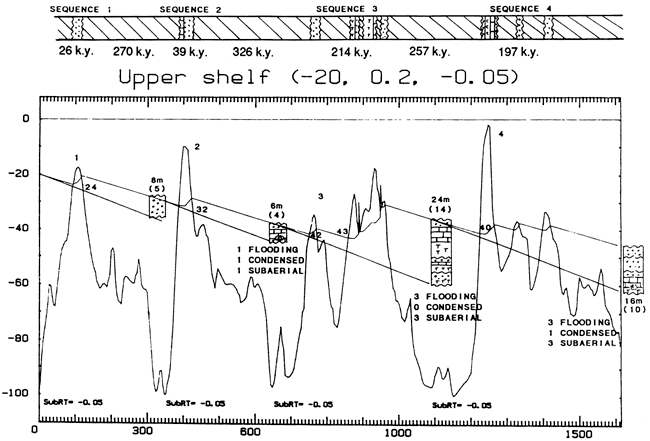
Figure 10--Computer simulation for a middle shelf setting for Missourian cycles in western Kansas. Initial sediment elevation is -50 m (-160 ft), potential sediment accumulation rate is 0.3 m/k.y. (1.0 ft/k.y.), and subsidence rate is -0.1 m/k.y. (-0.3 ft/k.y.). See figs. 2 and 9 for additional explanation.
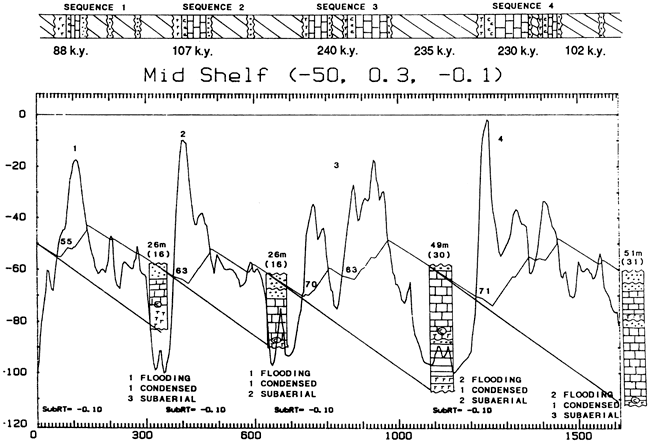
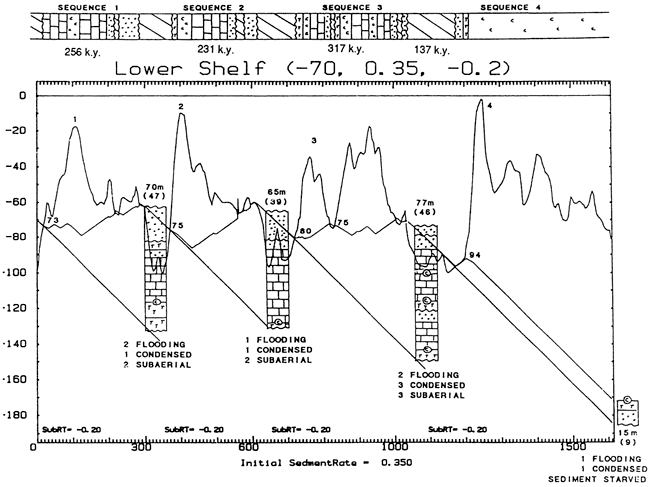
Figure 11--Computer simulation for a lower shelf setting for Missourian cycles in western Kansas. Initial sediment surface elevation is -70 m (-230 ft), potential sediment accumulation rate is -0.35 m/k.y. (-1.1 ft/k.y.), and subsidence rate is -0.2 m/k.y. (-0.7 ft/k.y.). Cycle 4 represents sediment starvation. See figs. 2 and 9 for additional explanation.
The upper shelf setting is defined by high initial sediment elevation [-20 m (-66 ft)], slow average subsidence [-0.05 m/k.y. (-0.2 ft/k.y.)], and slow average potential sediment accumulation rate [0.2 m/k.y. (0.7 ft/k.y.)]. The four simulated cycles on the upper shelf are thin because of limited duration of marine inundation and prolonged subaerial exposure (fig. 9). The initial sediment surface drops in elevation in three successive cycles, because sediment accumulation is unable to keep pace with subsidence. The complicated sea-level history of the third and fourth cycles results in several flooding and shallowing-upward packages punctuated by short intervals of subaerial exposure. The simulated sediment columns are relatively thin and contain a high percentage of shoal-water sediments. Condensed sections occur in the second and fourth simulated cycles and result from sustained, rapid deepening during glacial-eustatic rise. Cycles 1 and 3 were influenced by eustatic rises that were not sustained and did not lead to deep-water conditions. The horizontal time-stratigraphic column indicates that no sediment deposition occurred during 80% of the total duration of the four sea-level cycles. This is due to prolonged subaerial exposure in this high shelf position. Actual Pennsylvanian cycles on the upper shelf are of similar thickness with abundant shoal-water deposits and evidence of substantial subaerial exposure (fig. 5).
The simulation on the middle shelf (fig. 10) uses the same sea-level history as the upper shelf. The differences are initial shelf elevation [-50 m (-160 ft)], subsidence rate [-0.1 m/ k.y. (-0.3 ft/k.y.)], and average potential sediment accumulation rate [0.3 m/k.y. (1.0 ft/k.y.)]. Increased accommodation space relative to the upper shelf results from the greater subsidence rate and the lower shelf elevation. The result is thicker cycles and a greater percentage of deeper-water carbonates. The duration and relative timing in which shallow-water carbonate sedimentation occurs are not the same shelf locations occupying different elevations. These different tracts of sedimentation, probably representing individual stillstand events, are important for refining and validating models and for characterizing petroleum reservoirs. These tracts differ in the sense and definition of system tracts as used by Sarg (1988). The tracts as used here represent finer subdivisions of the highstand systems tract as a response to falling base level. Condensed sections are well developed in all cycles. The lower shelf elevations in this location result from additional fluctuations in sea level compared to the upper shelf location. Similar to the upper shelf position, sedimentation here does not keep pace with subsidence. Slight changes in rates of sediment accumulation or subsidence would balance the effects on the elevation of the sediment surface.
The simulation for the lower shelf (fig. 11) again has the same eustatic signal, but shelf elevation has been decreased to -70 m (-230 ft), subsidence has been increased to -0.2 m/ k.y. (-0.7 ft/k.y.), and average potential sediment accumulation rate has been increased to 0.35 m/k.y. (1.1 ft/k.y.). Lower shelf elevations result in more prolonged marine inundation. The cycles are thicker and contain multiple flooding units and condensed sections. However, periods of subaerial exposure are fewer and of shorter duration. Subsidence rates are relatively high, and even though sediment accumulation has increased, the sediment pile is still unable to keep pace with subsidence, in part because of continued interruptions in sedimentation resulting from fluctuating sea level. A sedimentary succession representative of the lower shelf is the cored well illustrated in fig. 6. Cycles are thicker, and minor cycles (shallowing-upward packages) in some cycles are better defined and more numerous [e.g., the I zone shown in fig. 6 compared to the upper shelf (fig. 5)].
By the fourth cycle on the lower shelf simulation, the initial elevation was lowered to the point where the next eustatic rise completely shut down carbonate sedimentation because the water depths were below 50 m (160 ft) throughout the course of the sea-level cycle. The net effect of these sediment-starved conditions is a backstepping of the shelf margin onto what was an interior position on the shelf. In order for the location to regain a shelf setting, subsidence rates would have to be decreased, sea level would have to fall to greater levels, or sediment would have to be redistributed from the shallow shelf, raising the sediment surface elevation. Thus this model demonstrates a realistic scenario in which abrupt sea-level change and rapid subsidence lead to shifting of the position of the shelf to basin transition.
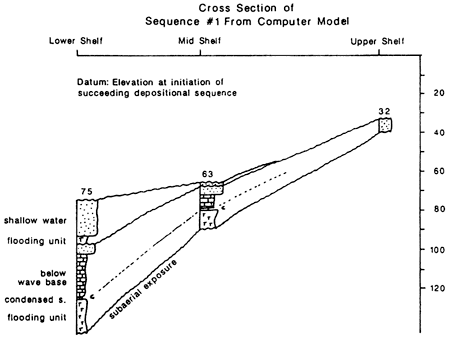
These one-dimensional simulations can be combined in several ways to examine the changes across the shelf in two dimensions. All four simulated cycles from the three shelf positions are shown in a time-stratigraphic plot (a Wheeler diagram) (fig. 12). Inferred correlations between temporally distinct events are shown. In addition, an elevation-distance plot of cycle 1 is plotted at the time just before cycle 2 begins to accumulate on the shelf (fig. 13). The profile of the shelf before cycle 2 is depicted as the upper surface of cycle 1.
Figure 12--Time-stratigraphic diagram (Wheeler diagram) for upper, middle, and lower shelf settings presented from time-stratigraphic sections generated in figs. 9 through 11.
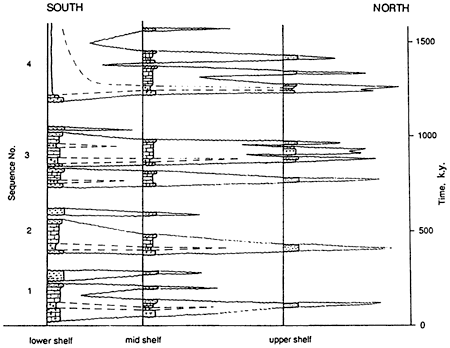
Figure 13--Depth-distance south to north cross section for cycle 1 when sea level begins to rise, leading to deposition of the succeeding cycle. The sections and elevations are derived from the depth-stratigraphic sections and sediment elevation curves generated in figs. 9 through 11.
The modeling discussed here is an initial attempt to simulate Missourian (Pennsylvanian) carbonate shelf cycles using a process-response model. This modeling provides the opportunity to examine the interaction of controls on sedimentation that are thought to be responsible for cycle development. Inversion procedures are needed to extract more detailed and precise parameters from the Pennsylvanian rock record and to make more realistic and constrained simulations. A systematic collection of information is needed to obtain better estimates of the modeling parameters. Integration of the study of the ancient rock record with results from the study of Quaternary analogues will provide further constraints to modeling and will help to move geologic results from what some consider to be soft data to the hard data category.
Appreciation is extended to S. J. Mazzullo and D. R. Boardman, 11, for the suggestions offered in their critical reviews of the manuscript. We also thank E. Franseen, C. Maples, R. Coveney, and D. Baars for discussions that influenced the content of this article. Thanks are given to Renate Hensiek for preparation of the illustrations.
Abbott, H. D. W., Carter, R. M., and Henderson, R. A., 1989, Facies signature of late Neogene eustatic sea-level fluctuations exemplified in Plio-Pleistocene cyclothems, North Island, New Zealand: 28th International Geological Congress, Washington, DC, Abstracts, v. 1, p. 1-2-1-3
Baars, D., 1966, Pre-Pennsylvanian paleotectonics--key to basin evolution and petroleum occurrences in Paradox basin: American Association of Petroleum Geologists, Bulletin, v. 50, p. 2,082-2,111
Beaumont, C., 1981, Foreland basins: Geophysical Journal of the Royal Astronomical Society, v. 65, p. 291-329
Berger, A., 1988, Milankovitch theory and climate: Reviews of Geophysics, v. 26, p. 624-657
Boardman, D. R., II, and Heckel, P. H., 1989, Glacial-eustatic sealevel curve for early Late Pennsylvanian sequence in north-central Texas and biostratigraphic correlation with curve for midcontinent North America: Geology, v. 17, p. 802-805
Brewer, J. A., Good, R., Oliver, J. E., Brown, L. D., and Haufman, S., 1983, COCORP profiling across the southern Oklahoma aulacogen--overthrusting of the Wichita Mountains and compression within the Anadarko basin: Geology, v. 11, p. 109-114
Broecker, W. S., and Van Donk, J., 1970, Insolation changes, ice volume, and the O18 record in deep sea cores: Reviews of Geophysics and Space Physics, v. 8, p. 169-198
Calvert, S. E., Vogel, J. S., and Southon, J. R., 1987, Carbon accumulation rates and the origin of the Holocene sapropel in the Black Sea: Geology, v. 15, p. 918-921
Carter, R. M., Carter, L., and Johnson, D. P., 1986, Submergent shorelines in the SW Pacific--evidence for an episodic postglacial transgression: Sedimentology, v. 33, p. 629--649
Coveney, R. M., Jr., Watney, W. L., and Maples, C. G., 1991, Contrasting depositional models for Pennsylvanian black shale discerned from molybdenum abundance: Geology, v. 19, p. 147-150
Cross, T. A., 1989, Quantitative dynamic stratigraphy: Prentice-Hall, Englewood Cliffs, New Jersey, 625 p.
Crowell, J. C., 1978, Gondwanan glaciation, cyclothems, continental positioning, and climate change: American Journal of Science, v. 278, p. 1,345-1,372
Crowell, J. C., and Frakes, L. A., 1975, The Late Paleozoic glaciation; in, Gondwana Geology, K. S. W. Campbell, ed.: Canberra, Australia National University Press, p. 313-331
Crowley, T. J., Mengel, J. G., and Short, D. A., 1987, Gondwanaland's seasonal cycle: Nature, v. 329 (October 29), p. 803-807
Denton, G. H., and Hughes, T. J., 1983, Milankovitch theory of ice ages--hypothesis of ice-sheet linkage between regional insolation and global climate: Quaternary Research, v. 20, p. 125-144
Dickinson, W. R., and Yarborough, H., 1979, Plate tectonics and hydrocarbon accumulation: American Association of Petroleum Geologists, Continuing Education Case Notes Series 1, 150 p.
Dubois, M. K., 1985, Application of cores in development of an exploration strategy for the Lansing-Kansas City "E" zone, Hitchcock County, Nebraska: Kansas Geological Survey, Subsurface Geology Series 6, Core Studies in Kansas, p. 120-144 [available online]
Evans, G., 1979, Quaternary transgressions and regressions: Journal of the Geological Society of London, v. 136, p. 125-132
Fischer, R. G., 1964, The Lofer cyclothems of the Alpine Triassic; in, Symposium on Cyclic Sedimentation, D. F. Merriam, ed.: Kansas Geological Survey, Bulletin 169, p. 107-149 [available online]
Fleming, P. B., and Jordan, T. E., 1990, Stratigraphic modeling of foreland basins-interpreting thrust deformation and lithosphere rheology: Geology, v. 18, p. 430-434
Halderson, H. H., and Damsleth, E., 1990, Stochastic modeling: Journal of Petroleum Technology, v. 42, p. 404-412
Hallock, P., and Schlager, W., 1986, Nutrient excess and the demise of coral reefs and carbonate platforms: Palaios, v. 1, p. 389-398
Heckel, P. H., 1977, Origin of phosphatic black shale facies in Pennsylvanian cyclothems of midcontinent North America: American Association of Petroleum Geologists, Bulletin, v. 61, p. 1,045-1,068
Heckel, P. H., 1980, Paleogeography of eustatic model for deposition of midcontinent Upper Pennsylvanian cyclothems; in, Paleozoic Paleogeography of the West-Central United States, T. D. Fouch and E. R. Magathan, eds.: Rocky Mountain Section, Society of Economic Paleontologists and Mineralogists, Rocky Mountain Paleogeography Symposium 1, p. 197-216
Heckel, P. H., 1986, Sea-level curve for Pennsylvanian eustatic marine transgressive-regressive depositional cycles along midcontinent outcrop belt, North America: Geology, v. 14, p. 330-334
Imbrie, J., and Imbrie, J. Z., 1980, Modeling the climatic response to orbital variations: Science, v. 207, p. 943-953
Kendall, C. G. St. C., and Lerche, I., 1988, The rise and fall of eustasy; in, Sea-Level Changes-An Integrated Approach, C. K. Wilgus, H. Posamentier, C. A. Ross, and C. G. St. C. Kendall, eds.: Society of Economic Paleontologists and Mineralogists, Special Publication 42, p. 3-17
Klein, G. de V., 1990, Pennsylvanian time scales and cycle periods: Geology, v. 18, p. 455-457
Kluth, C. F., 1986, Plate tectonics of the Ancestral Rocky Mountains; in, Paleotectonics and Sedimentation in the Rocky Mountain Region, United States, J. A. Peterson, ed.: American Association of Petroleum Geologists, Memoir 41, p. 353-369
Kumar, N., and Slatt, R. M., 1984, Submarine-fan and slope facies of Tonkawa (Missourian-Virgilian) sandstone in deep Anadarko Basin: American Association of Petroleum Geologists, Bulletin, v. 689, p. 1,839-1,856
Matthews, R. K., 1984, Oxygen isotopic record of ice-volume history-100 million years of glacio-eustatic sea-level fluctuation; in, Interregional Unconformities and Hydrocarbon Accumulation, J. S. Schlee, ed.: American Association of Petroleum Geologist, Memoir 36, p. 97-107
Mitchum, R. M., Vail, P. R., and Thompson, S., 1977, Seismic stratigraphy and global changes of sea level, pt. 2--the depositional sequence as a basic unit for stratigraphic analysis; in, Seismic Stratigraphy--Applications to Hydrocarbon Exploration, C. E. Payton, ed.: American Association of Petroleum Geologists, Memoir 26, p. 53-62
Petersen, T. F., and Calvert, S. E., 1990, Anoxia vs. productivity--what controls the formation of organic-carbon-rich sediments and sedimentary rocks?: American Association of Petroleum Geologists, Bulletin, v. 74, p. 454-466
Prather, B. E., 1985, An Upper Pennsylvanian desert paleosol in the D zone of the Lansing-Kansas City groups, Hitchcock County, Nebraska: Journal of Sedimentary Petrology, v. 55, p. 213-221
Quinlan, G. M., and Beaumont, C., 1984, Appalachian thrusting, lithospheric flexure, and the Paleozoic stratigraphy of the eastern interior of North America: Canadian Journal of Earth Sciences, v. 21, p. 973-996
Rascoe, B., Jr., and Adler, F. J., 1983, Permo-Carboniferous hydrocarbon accumulations, midcontinent, USA: American Association of Petroleum Geologists, Bulletin, v. 68, p. 979-1,001
Read, J. F., Grotzinger, J. P., Bova, J. A., and Koerschner, W. F., 1986, Models for generation of carbonate cycles: Geology, v. 14, p. 107-110
Ross, C. A. and Ross, J. R. P., 1987, Late Paleozoic sea levels and depositional sequences: Cushman Foundation for Foraminiferal Research, Special Publication 24, p. 137-168
Rossignol-Strick, M., 1987, Rainy periods and bottom water stagnation initiating brine accumulation and metal concentrations--1, the late Quaternary: Paleoceanography, v. 2, p. 333-360
Sarg, J. F., 1988, Carbonate sequence stratigraphy; in, Sea-Level Changes-An Integrated Approach, C. K. Wilgus, H. Posamentier, C. A. Ross, and C. G. St. C. Kendall, eds.: Society of Economic Paleontologists and Mineralogists, Special Publication 42, p. 155-181
Schindel, D. E., 1980, Microstratigraphic sampling and the limits of paleontologic resolution: Paleobiology, v. 6, no. 4, p. 408-426
Schlager, W., 1981, The paradox of drowned reefs and carbonate platforms: Geological Society of America, Bulletin, v. 92, p. 197-211
Turcotte, D. L., and Willemann, J. H., 1983, Synthetic cyclic stratigraphy: Earth and Planetary Science Letters, v. 63, p. 8996
Veevers, J. J., and Powell, C. M., 1987, Late Paleozoic glacial episodes in Gondwanaland reflected in transgressive-regressive depositional sequences in Euramerica: Geological Society of America, Bulletin, v. 98, p. 475-487
Wanless, H. R., and Cannon, J. R., 1966, Late Paleozoic glaciation: Earth Science Review, v. 1, p. 247-286
Wanless, H. R., and Shepard, F. P., 1936, Sea level and climatic changes related to late Paleozoic cycles: Geological Society of America, Bulletin, v. 47, no. 8, p. 1,177-1,206
Watney, W. L., 1979, Gamma ray-neutron cross plots as an aid in sedimentological analysis; in, Geomathematical and Petrophysical Studies in Sedimentology, D. Gill and D. F. Merriam, eds.: Pergamon Press, Oxford, England, p. 81-100
Watney, W. L., 1980, Cyclic sedimentation of the Lansing-Kansas City Groups in northwestern Kansas and southwestern Nebraska: Kansas Geological Survey, Bulletin 220, 72 p. [available online]
Watney, W. L., 1984, Recognition of favorable reservoir trends in Upper Pennsylvanian cyclic carbonates in western Kansas; in, Limestones of the Midcontinent, N. J. Hyne, ed.: Tulsa Geological Society, Special Publication 2, p. 201-246
Watney, W. L., 1985, Resolving controls on epeiric sedimentation using trend surface analysis: Mathematical Geology, v. 17, p. 427-454
Watney, W. L., and French, J., 1988, Characterization of carbonate reservoirs in the Lansing-Kansas City groups (Upper Pennsylvanian) in Victory Field, Haskell County, Kansas; in, Occurrence and Petrophysical Properties of Carbonate Reservoirs in the Rocky Mountain Region, S. M. Goolsby and M. W. Longman, eds.: 1988 Carbonate Symposium, Rocky Mountain Association of Geologists, p. 27-46
Watney, W. L., French, J. A., and Franseen, E. K., 1989, Sequence stratigraphic interpretations and modeling of cyclothems: Kansas Geological Society Guidebook, 41st Annual Field Conference, 211 p.
Watney, W. L., Doveton, J. H., French, J. A., and Collins, D. R., 1990, Petrophysical characterization of Upper Pennsylvanian depositional sequences in western Kansas: Geological Society of America, Abstracts with Programs, v. 22, no. 1, p. 35
Watney, W. L., Newell, K. D., Collins, D. R., and Skelton, L. H., 1989, Petroleum exploration in Kansas--past trends and future options: Proceedings of the 8th Tertiary Oil Recovery Conference, Tertiary Oil Recovery Project, Contribution 10, p. 4-35
Wenger, L. M., and Baker, D. R., 1986, Variations in organic geochemistry of anoxic-oxic black shale--carbonate sequences in the Pennsylvanian of the midcontinent: Organic Geochemistry, v. 10, p. 85-92
Williams, D. F., 1988, Evidence for and against sea-level changes from the stable isotopic record of the Cenozoic; in, Sea-Level Changes--An Integrated Approach, C. K. Wilgus, H. Posamentier, C. A. Ross, and C. G. St. C. Kendall, eds.: Society of Economic Paleontologists and Mineralogists, Special Publication 42, p. 31-36
Kansas Geological Survey
Comments to webadmin@kgs.ku.edu
Web version April 22, 2010. Original publication date 1991.
URL=http://www.kgs.ku.edu/Publications/Bulletins/233/Watney/index.html