Kansas Geological Survey, Open-file Report 2000-31
Kansas Geological Survey, University of Kansas
KGS Open File Report 2000-31
June, 2000
In the early part of June, 2000, a prolonged dry period reduced streamflow and threatened the water supply of the Kickapoo Indian Reservation in Brown County. The Kansas Geological Survey was requested by the Kansas Water Office to work with the Kickapoo Indian tribe in locating sources of water from shallow aquifers within the reservation that could be used to temporarily supplement their dwindling supply. The Kansas Geological Survey responded to this request and conducted a test-hole drilling program to identify potential well sites in the southern part of the reservation. The purposes of this report are to: (1) document the field investigation we conducted on the reservation and (2) present recommendations based on our results.
The Kickapoo Indian Reservation in Brown County relies on surface water from the Delaware River for its water supply (Figure 1). A diversion dam located in the eastern part of Section 32, T. 4 S., R. 16 W. causes the water level in the river to rise slightly, creating a small reservoir. According to the tribe, current water use is estimated to be 113,000 gal/day. In the early part of June, 2000, a prolonged dry period reduced streamflow and threatened the water supply for the reservation. Plans have been formulated to construct a new impoundment upstream on Plum Creek in the next few years. This source is expected to meet the reservation's current water-supply demand. The Kansas Geological Survey was requested by the Kansas Water Office to work with the Kickapoo Indian tribe in locating sources from shallow aquifers within the reservation that could be used to temporarily supplement their dwindling surface-water supply.
Figure 1. Location of the Kickapoo Indian Reservation in southern Brown Co., showing the Delaware River drainage.
The Kansas Geological Survey responded to this request and in the following week conducted a test-hole drilling program to investigate the ground-water resources of the reservation. This resulted in the installation of a number of test wells in the most promising locations. The purposes of this report are to: (1) document the field investigation we conducted on the reservation and (2) present recommendations based on our results.
Several Kansas Geological Survey Bulletins and Open-file Reports have been written on the geology and ground-water resources of this part of northeastern Kansas, including county reports by Bayne and Schoewe (1967) and a companion data compilation by Bayne (1967). Data tabulations and an interpretive report on the hydrogeology and water quality of aquifers in the glacial deposits of northeastern Kansas were written by Denne et al. (1990a,b) and Denne et al. (1998). More recently, regional scale geographic information system coverages of the extent and elevation of the base of the glacial drift aquifer have been developed by the Data Access and Support Center (DASC) at KGS. These coverages were taken directly from a regional scale map of the bedrock surface topography in Denne et al. (1998).
In 1996, the Kickapoo Indian tribe contracted with Ground Water Associates, Inc, Wichita, KS, to locate ground-water sources on the reservation. During the course of that field investigation 31 test holes were drilled and 7 test wells were constructed and pumped in the Delaware River valley and in the glacial drift aquifer in the southwestern part of the reservation (Table 1; Figure 2). From the pumping of the test wells, well yields were estimated and water samples were obtained for chemical analysis. Bob Vincent, Ground Water Associates, Inc., has graciously provided us with copies of the data from this field investigation and we wish to acknowledge his contribution to our efforts at this time. Information from the 1996 test-drilling and pumping can be found in Appendix 1.
Figure 2. Distribution of test holes and test wells from earlier investigations (dots) and the KGS investigation (plusses) in the southern part of the Kickapoo Indian Reservation. A larger version of this figure is available.
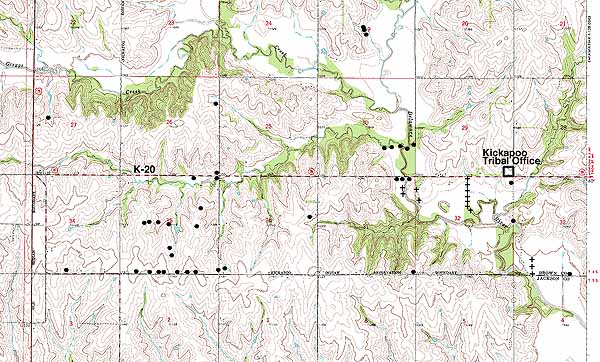
Table 1. Locations of Test Holes and Test Holes drilled in 1996
| Site | Location |
|---|---|
| TH 1-96 | 283'N & 27'E of SW Corner, SE 1/4, Sec 35, T4S, R15E |
| TH 2-96 | 56'N & 360'E of SW Corner, SE 1/4, Sec 35, T4S, R15E |
| TH 3-96 | 1320'N & 93'E of SW Corner, SE 1/4, Sec 35, T4S, R15E |
| TH 4-96 | 56'N & 34'E of Center of Corner, SE 1/4, Sec 35, T4S, R15E |
| TH 5-96 | 1650'N & 34'E of SW Corner, SE 1/4, Sec 35, T4S, R15E |
| TH 6-96 | 30'S & 1275'W of NE Corner, SE 1/4, Sec 35, T4S, R15E |
| TH 7-96 | 119'N & 2023'E of SW Corner, NW 1/4, Sec 35, T4S, R15E |
| TH 8-96 | 120'N & 1423'E of SW Corner, NW 1/4, Sec 35, T4S, R15E |
| TH 9-96 | 119'N & 1797'E of SW Corner, NW 1/4, Sec 35, T4S, R15E |
| TH 10-96 | 150'S & 175'W of NE Corner, Sec 35, T4S, R15E |
| TH 11-96 | 178'S & 1200'W of NE Corner, Sec 35, T4S, R15E |
| TH 12-96 | 541'S & 1360'E of NW Corner, Sec 36, T4S, R15E |
| TH 13-96 | Near center of Sec 19, T4S, R16E |
| TH 14-96 | 165'N of Center of Sec 19, T4S, R16E |
| TH 15-96 | 232'S of Center of Sec 19, T4S, R16E |
| TH 16-96 | 12'N & 264'W of SE Corner, SW 1/4, Sec 35, T4S, R15E |
| TH 17-96 | 15'N & 548'W of SE Corner, SW 1/4, Sec 35, T4S, R15E |
| TH 18-96 | 412'N & 1200'W of SE Corner, NE 1/4, Sec 28, T4S, R15E |
| TH 19-96 | 15'N & 792'W of SE Corner, SW 1/4, Sec 35, T4S, R15E |
| TH 20-96 | 15'N & 1392'W of SE Corner, SW 1/4, Sec 35, T4S, R15E |
| TH 21-96 | 15'N & 1992'W of SE Corner, SW 1/4, Sec 35, T4S, R15E |
| TH 22-96 | 15'N & 1092'W of SE Corner, SW 1/4, Sec 35, T4S, R15E |
| TH 23-96 | 1450'N & 210'W of SE Corner, Sec 30, T4S, R16E |
| TH 24-96 | 1480'N & 980'W of SE Corner, Sec 30, T4S, R16E |
| TH 25-96 | 1480'N & 1380'W of SE Corner, Sec 30, T4S, R16E |
| TH 26-96 | 1480'N & 1595'W of SE Corner, Sec 30, T4S, R16E |
| TH 27-96 | 101'S & 700'W of NE Corner, Sec 31, T4S, R16E |
| TH 28-96 | 99'S & 900'W of NE Corner, Sec 31, T4S, R 16E |
| TH 29-96 | 90'S & 250'W of NE Corner, Sec 31, T4S, R16E |
| TH 30-96 | 1450'N & 500'W of SE Corner, Sec 30, T4S, R16E |
| TH 31-96 | 13'NW of TH 27-96 in Sec 31, T4S, R 16E |
The alluvial aquifer in the Delaware River valley consists of Wisconsinan and Recent alluvial and terrace deposits of gravel, sand, silt and clay (Figure 3). Overall, these deposits are clay and silt dominated and thus the yield to wells is generally small and depends on the thickness and extent of water-saturated sand and gravel deposits. In the 1996 investigation by Ground Water Associates, test-hole drilling was conducted in the Delaware River valley in the SE Section 30 and the NE of Section 31, T. 4 S., R. 16 E. and resulted in the completion of several test wells. Thicknesses of the alluvium from the test drilling ranged from 42-47 ft and yields from the test wells ranged from 8 gallons per minute (gpm) in test well 23-96 to 60 gpm in test well 31-96. Denne et al. (1990) reported an alluvium thickness of 56 ft in a test hole drilled by the Indian Health Service in the Delaware River valley along the south boundary of the reservation in SW SW SE Section 33, T. 4 S., R. 16 E.
Figure 3. Surface geology of the southern part of the Kickapoo Indian Reservation and adjacent northern Jackson County.
The glacial drift in Brown County consists of outwash deposits and till (Bayne and Schoewe, 1967) (Figure 3). Till consists of non-stratified, heterogeneous mixtures of boulders, cobbles, gravel, sand, silt, and clay deposited as a result of glacial activity during the Pleistocene. Lenses of sand and pea-size gravel occur sporadically in these clay-dominated deposits. Glacial outwash consists of poorly to moderately sorted gravel, sand, and silt deposited by glacial meltwater streams.
Water availability in the glacial drift aquifer depends on the proportion and degree of sorting of sand and gravel lenses and the amount of downcutting by streams in the modern drainage. Because the till in Brown County is clay dominated, little or no water is available from these deposits (Bayne and Schoewe, 1967). Bayne and Schoewe also indicate that downcutting into the glacial deposits has drained much of the ground water of these deposits where they are thin. In contrast the glacial outwash deposits are better sorted; yields of wells obtaining water from these deposits range up to 450 gpm. An extensive outwash deposit is located within 4 mi. of the eastern reservation boundary in the western part of T. 4 S., R. 18 E. and the northeastern part of T. 4 S., R. 17 E. Bayne and Schoewe report that the town of Everest in eastern Brown County relies on this source for its water supply.
None of the test-hole drilling reported in Bayne and Schoewe (1967) indicates significant water-saturated outwash deposits on the reservation. This is confirmed by the reports of Denne et al. (1990, 1998) and the further drilling by Ground Water Associates. Extensive test-hole drilling was done by Ground Water Associates along the south boundary of the reservation in Section 35, T. 4 S., R. 14 E. (Appendix 1 and Figure 2). At this location the till fills a tributary of a NW-SE trending buried valley system in northern Jackson and Nemaha counties. The till thickness reported in the Ground Water Associates test drilling logs ranges up to more than 150 ft near the center of the south line of Section 35. However, the logs indicate very little sand and gravel in a clay-dominated till. Ground Water Associates also drilled several test holes in Section 19, T. 4 S., R.16 E. and found very little if any permeable, water-saturated deposits in the till.
The near surface bedrock units in the southern part of the reservation are (from oldest to youngest) the Pennsylvanian Wabaunsee Group and the Permian Admire Group (Figure 3). Within these units, thin lenticular sandstones and sandy shales reportedly provide very small amounts of water to wells (Bayne and Schoewe, 1967).
Yields of wells drilled on the Kickapoo Indian Reservation range up to 40 gpm (Bayne and Schoewe, 1967; Denne et al., 1990). However, most of the well yields reported are lower by an order of magnitude. Of the well yields reported in the publications cited above, 13 wells produced 0-5 gpm, 2 wells produced 6-10 gpm and 2 wells produced 11-20 gpm, and one well produced between 21-40 gpm. The highest yield reported was for a test well in the alluvial aquifer in the Delaware River valley near the south boundary of the reservation in the SW quarter of Section 33, T.4 S., R. 16 W.
Because of the need for a quick response to the water-supply problems of the Kickapoo Indians on the reservation, potential drilling sites were selected based on a review of Bayne and Schoewe (1967), Bayne (1967), Denne et al., (1990; 1998), and the data supplied by Ground Water Associates. In the selection process an attempt was made to locate test-drilling sites that had not been investigated in the previous Ground Water Associates field investigation. As a result, our attention focused on the alluvial aquifer in the Delaware River valley. Sites were selected in the valley where the river crosses the south boundary along the south line of Section 33, T. 4 S., R. 16 E., south of Kansas Highway 20 and north of the river in Section 32, T. 4 S., R. 16 E., and south of Kansas Highway 20 in NE quarter of Section 31, T. 4 S., R. 16 E. (Figure 2). This last area is in the vicinity of where the earlier test pumping of Ground Water Associates indicated a potentially important ground-water resource. All of these areas selected for test drilling are within approximately one mile of the water treatment plant for the reservation in the NE quarter of Section 32, T. 4 S., R. 16 E.
Test drilling began in two of the three areas in the afternoon of June 5 using two truck-mounted auger units and the Geoprobe® unit. This equipment was selected for use in the project because each of the areas could be covered more quickly than would be possible with conventional mud rotary drilling methods. On June 6 installation of a test well began at a site on the east bank of the Delaware on the south boundary of the reservation and at sites in the north half of Section 32, T. 4 S., R. 16 E. Some of the test drilling continued through June 6-7 at sites on the east bank of the Delaware River in NE quarter of Section 31, T. 4 S., R. 16 E. Test wells were eventually installed on June 7 at a site 50 ft south of the centerline of Kansas State Highway 20 in NW corner of the NE quarter of Section 32, T. 4 S., R. 16 E., and at a site on the west bank of the Delaware River approximately 315 ft south of Ground Water Associates Test Well 31-96 in NE quarter of Section 31, T. 4 S., R. 16 E. An additional monitoring well was installed using the Geoprobe® unit 315 ft south of the KGS test well.
In the test-well installation phase of the project, an 11-in. diameter borehole was drilled to bedrock using one of the auger units. Sections of machine-slotted well screen (0.020 in. slot screen) with a bottom cap and blank riser pipe were assembled by screwing them together. The assembled sections were lowered into the central open space of the auger flights and down to the bottom of borehole, adjacent to what was believed to be a permeable zone. Silica sand was then placed around the well up to a level above the screened interval to act as a filter pack to keep the fine sediment out of the well. During this process the auger flights were gradually being removed from the borehole. The borehole was then logged for natural gamma-ray activity by lowering the measuring probe to the bottom of the well and winching it up to surface while measurements were being recorded. Bentonite chips were then added to the open annular space of the borehole up to the surface to prevent contaminants from moving down the borehole outside of the well casing to the aquifer. Following installation, the test wells were developed using airlift methods to remove any accumulated fines and establish good hydraulic connection between the well bore and the adjacent aquifer. Later, well development was continued as a preparatory step to the collection of samples for characterizing the water quality.
Water samples were collected from the Delaware River, Test Well 31-96 of Ground Water Associates, and three of the KGS test wells. Temperature and specific conductance were measured during the pumping of the wells. Water was pumped for collecting samples for laboratory analysis using a Grundfos pump. All samples were filtered through a 0.45 µm membrane filter cartridge placed on-line from a small tube splitting flow from the main hose. Each sample set included 500 mL of unacidified sample and 100 mL acidified with 1 mL of hydrochloric acid. Samples were placed in a cooler with ice until they were transferred to a refrigerator at the KGS for laboratory analysis.
All of the test-drilling done for this project was either in the alluvium or the adjacent terrace deposits. Nine test-holes were drilled using the auger units and nine holes were completed by the Geoprobe®. This method of test-drilling was selected because under most circumstances more drilling can be accomplished in the same period of time using these techniques than with conventional mud rotary methods. Unfortunately, the character of the materials penetrated by the auger units and the Geoprobe® cannot be determined from samples of the drilled materials returning to the surface. This is especially true when the auger is penetrating water-saturated materials below the water table. However, the behavior of the auger rig while the borehole is being advanced can be a clue about the nature of the materials being penetrated. In the case of the Geoprobe® unit, a log of bulk electrical conductivity of the sediments is generated in real time as the probe on the end of the drill pipe is advanced into the subsurface. This provides clues as to the nature of the sediments in the subsurface. Clay and silt are more electrically conductive and have higher conductivity than sand. Likewise, water-saturated sediments are more electrically conductive than dry sediments. Using this information, it is possible to distinguish low conductivity wet sandy deposits from high conductivity clay and silt with a fair degree of accuracy.
Along the south boundary of the Kickapoo Indian Reservation in the Delaware River valley 7 test holes were drilled by the auger units (Figure 2). Five test holes were drilled along the east-west section-line road and 2 additional holes were drilled along a north-south lane between two planted fields near the river. The depth to bedrock (considered equivalent to an inability to penetrate further into the subsurface) varied from 38-41 ft. The test-drilling results indicate that all of the upper part of the alluvium consists of a heavy, dark gray to brown clay that grades downward to brown silt and eventually to thin, water-saturated sand deposits just above the bedrock surface. The average thickness of sand penetrated is probably less than 10 ft. However, in the test hole nearest the river, the auger did penetrate 10 ft of sand before refusal at the bedrock surface (inability of the auger to penetrate further into the subsurface).
Test drilling was done with the Geoprobe® approximately along the west line of the NE quarter of Section 32, T. 4 S., R. 16 E. from Kansas Highway 20 southward toward the river at 7 sites in the terrace and the alluvial deposits. Depth to bedrock (considered equivalent to an inability to penetrate further into the subsurface) varied appreciably along the transect from 26-46 ft (Figures 4-6). The conductivity logs suggest that the upper part of the alluvial and terrace deposits consists of variable amounts of high conductivity silt and clay that grade downward to low conductivity sands near the bottom of the unconsolidated sediments. Approximately 20 ft of sand was penetrated at Geoprobe® site Kickapoo 1a from 18 ft below surface to bedrock at 38 ft, the most at any of the locations we drilled. During the installation of Test Well 2, a stiff blue clay impregnated with pea-size gravel was recovered from the bit on the bottom flight of the auger at 31 ft. This suggests that there may be two distinct sand bodies separated by a thin clay at this site. At this site there were some electrical problems with the conductivity probe on the Geoprobe® unit. In the conductivity log shown in Figure 4 for site Kickapoo la the clay is poorly indicated by a low amplitude spike occurring at about 31 ft below surface.
Figure 4. Ground conductivity logs from Geoprobe® Sites 1a through 1c from a traverse along the west line of the NE section 32, T. 4 S., R. 16 W.
Figure 5. Ground conductivity logs from Geoprobe® Sites 1d through 1f from a traverse along the west line of the NE section 32, T. 4 S., R. 16 W.
Figure 6. Ground conductivity logs from Geoprobe® Sites 1g from a traverse along the west line of the NE section 32, T. 4 S., R. 16 W.
Along the Delaware River in the NW quarter of Section 32 (east bank of the river) and in the NE quarter of Section 31, T. 4 S., R. 16 E. (west bank of the river), test drilling was done to determine the southward extent of the sand and gravel aquifer found in the test drilling that was done by Ground Water Associates at their Test Well 31-96 (Figure 2). Two sites were augered on the east bank of the river, one on what appeared to be a terrace and the other, to the south near the river bank. The surficial materials at both sites were coarser than what had been observed elsewhere which suggested the possibility of sand at depth. Refusal occurred at 17 ft and 22 ft in the test holes at the terrace location and next to the river on the east bank. At the terrace location, the auger penetrated sandy sediments down to bedrock, but the dry recovered sediments from the terrace test hole and the dry auger flights indicated no saturated thickness at this location. At the site near the river bank, the upper part of the hole penetrated clayey silt grading downward to silt and eventually 4 ft of water-saturated sand near at the bottom of the hole.
Prior to test-hole drilling with the Geoprobe® unit on the west bank of the river, the Ground Water Associates Test Well 31-96 was logged to obtain a gamma-ray profile of the alluvium and the Geoprobe® was used to generate a conductivity profile of the subsurface a few feet away from the test well. Figure 7 is a comparison of the driller's log with the gamma-ray and the conductivity logs at Test Well 31-96. The figure shows that both geophysical logs compare favorably in their overall characteristics to the driller's log of the test well. As in the other test holes in the valley, the alluvium consists of fining upward sequence with sands and pea gravel at the bottom and heavy silty clay near the top.
Figure 7. A comparison of the driller's log from test well 31-96 with a gamma-ray log of the well bore and a ground conductivity profile from a nearby Geoprobe® sounding.
The Geoprobe® unit was used at locations 315 ft and 630 ft south of Test Well 31-96 (Figure 8). The logs in both Geoprobe® soundings are similar to the log from the probing a few feet away from the test well. In this series of test drills sand thickness is greatest in the sounding taken 315 ft south of the test well and the sand and gravel lens thins with the concomitant rise in the bedrock surface from this site southward to the Geoprobe® site at 630 ft.
Figure 8. Interpreted ground conductivity profiles at two Geoprobe® sites south of test well 31-96. A large version of this figure is available.
Four test wells were installed based on the test drilling results. Test well #1 was installed near the Delaware River on the south boundary of the reservation in SE quarter of the SW quarter of the SW quarter of Section 33, T. 4 S., R. 16 E. Test Well #2 was installed approximately 50 ft south of Kansas Highway 20 near the northwest corner NE quarter of Section 32, T. 4 S., R. 16 E. Test Well 3 was installed 315 ft south of Ground Water Associates test well 31-96 in NE quarter of Section 31, T. 4 S., R. 16 E. Construction details for test wells #1-3 are given in Figures 9-11. A Geoprobe® monitoring well was installed 615 ft south of Ground Water Associates Test Well 31-96. The 1.25 in. diameter well is 39 ft deep and is screened from 36-39 ft. The top of the steel well casing is 3 ft above land surface.
Figure 9. Well construction details for test well #1 near the Delaware River along the south boundary of the Kickapoo Indian Reservation in the SE corner SW quarter of the SW quarter of Section 33, T. 4 S., R. 216 E. The natural gamma-ray log was generated from a sounding taken in the well before bentonite was added to the annular space between the well and the borehole. A large version of this figure is available.
Figure 10. Well construction details for test well #2 south of state highway 20 near the NW corner of the NE quarter of Section 32, T. 4 S., R. 16 E. The natural gamma-ray log was generated from a sounding taken in the well before bentonite was added to the annular space between the well and the borehole. A large version of this figure is available.
Figure 11. Well construction details for test well #3 near the Delaware River 315 ft south of test well 31-96 in the NE quarter of Section 33, T. 4 S., R. 16 E. The natural gamma-ray log was generated from a sounding taken in the well before bentonite was added to the annular space between the well and the borehole. A large version of this figure is available.
In the early part of the well development process by airlift only Test Well #1 could not be developed. The well only produced 15-20 gallons of water. The flow of water from the aquifer was insufficient to maintain the water level in the well causing poor air-lift performance. Test Well #2 produced approximately 250 gallons of water during this phase of development and the produced water was relatively sediment-free at completion. Likewise, approximately 350 gallons of water was produced from Test Well #3 and at the end of this phase of development this well was producing relatively sediment-free water.
On completion of the initial, airlift development process, further clean up of the produced water was done using a 3-in. submersible or a Grundfos pump prior to sampling for water quality. As in the previous phase, Test Well #1 was only able to produce a little water (on the order of 0.08 gpm). In test well #2 the static water level was 1.36 ft below the top of the casing. The initial pumping rate was 21 gpm which had to be throttled back to 10 gpm after 15 min. of pumping to reduce the rate of drawdown in the well. After 30 min the pumping rate was again reduced to about 6.7 gpm. This allowed to the water level in the well to partially recover to within 10 ft of the top of the casing. However in the following 55 min of pumping, the water level in the well did not stabilize, but continued to decline from 11.2 to 13.22 ft below top of casing. In Test Well #3 the static water level in the well was 16.83 ft below the top of casing prior to starting the next phase of development. The well was pumped at approximately 21 gpm for 75 min and the water level in the well declined down to 30.55 ft and did not stabilize. The Geoprobee monitoring well was developed by airlifting and purged. The static water level in this well was 13.9 ft below top of casing. During pumping of the Test Well #3, the water level in this monitoring well declined 0.7 ft.
Test Well 31-96 was also pumped with a 3-in. submersible pump. The static water level in the well prior to pumping was 19.78 ft below the top of the casing. After 30 minutes of pumping at 21 gpm, the water level in this test well had been drawn down 10.85 ft.
Upon arrival at the KGS analytical laboratory, the water samples were again filtered through 0.45 µm membrane filters before measurement of dissolved constituent concentrations to ensure removal of most of the suspended solids. The KGS determined laboratory conductance, pH, and concentrations of the dissolved constituents calcium, magnesium, sodium, potassium, strontium, bicarbonate, sulfate, chloride, fluoride, nitrate, boron, iron, and manganese (Table 3). The values of total dissolved solids in the table were computed from the sum of dissolved constituents (bicarbonate multiplied by 0.4917 to reflect that portion that equates to carbonate), and the hardness was calculated from the calcium and magnesium contents. Total dissolved solids (TDS) concentrations were estimated from field specific conductance measurements for those waters for which samples were not collected. The estimates are based on a linear regression (Figure 12) for the dissolved solids and conductance data in Table 3.
Figure 12. Total dissolved solids concentration versus specific conductance for the test well waters in Table 3. The TDS and conductance relationship was used to estimate TDS from field conductance measurements.
Table 3. Chemical properties and concentrations of dissolved constituents n test wells at the Kickapoo Indian Reservation. All analyses are by the Kansas Geological Survey.
| Site name | Units | KGS Test Well #2 | KGS Test Well #2 | KGS Test Well #3 | KGS Test Well #3 | GWA Test Well 31-96 |
|---|---|---|---|---|---|---|
| Legal location | T.R.S. | 4S-16E-31ABB | 4S-16E-31ABB | 4S-16E-31AAA | 4S-16E-31AAA | 4S-16E-31AAB |
| Sample date | m/d/yr | 6/9/00 | 6/9/00 | 6/9/00 | 6/9/00 | 6/9/00 |
| Sample time | 24 hr | 15:31 | 15:52 | 12:20 | 12:27 | 13:58 |
| Field conductance | µS/CM | 673 | 673 | 749 | 749 | 1166 |
| KGS Lab number | 000109 | 000110 | 000107 | 000108 | 000111 | |
| Lab specific conductance | µS/cm | 672 | 672 | 722 | 720 | 1140 |
| Total dissolved solids | mg/L | 394 | 398 | 433 | 433 | 669 |
| Lab pH | units | 7.20 | 7.30 | 7.05 | 7.05 | 7.25 |
| Total hardness as CaCO3 | mg/L | 287 | 293 | 332 | 328 | 537 |
| Silica, SiO2 | mg/L | 18.5 | 18.7 | 31 | 30.6 | 30.8 |
| Calcium, Ca | mg/L | 89.5 | 91.3 | 98.6 | 97.3 | 161 |
| Magnesium, Mg | mg/L | 15.5 | 15.7 | 20.9 | 20.7 | 32.9 |
| Sodium, Na | mg/L | 36.1 | 36.3 | 25.4 | 25.2 | 33.3 |
| Potassium, K | mg/L | 0.8 | 0.7 | 0.7 | 0.7 | 1.3 |
| Strontium, Sr | mg/L | 0.35 | 0.36 | 0.59 | 0.58 | 1.00 |
| Bicarbonate, HCO3 | mg/L | 409 | 410 | 368 | 372 | 536 |
| Sulfate, S04 | mg/L | 22.6 | 22.7 | 23.2 | 23.3 | 20.8 |
| Chloride, Cl | mg/L | 9.4 | 9.8 | 38.5 | 39.3 | 108 |
| Fluoride, F | mg/L | 0.25 | 0.24 | 0.37 | 0.36 | 0.35 |
| Nitrate, N03-N | mg/L | 0.05 | 0.07 | 0.29 | 0.27 | 0.43 |
| Boron, B | mg/L | 0.111 | 0.109 | 0.083 | 0.082 | 0.132 |
| Iron, Fe | mg/L | <0.026 | <0.026 | 10.23 | 10.26 | 12.24 |
| Manganese, Mn | mg/L | 0.132 | 0.170 | 0.846 | 0.849 | 1,472 |
| TDS/Sp.C. | 0.587 | 0.592 | 0.599 | 0.602 | 0,587 |
Test Well #I: After pumping the well until the Grundfos pump would no longer produce water, the well was left to recover. However, after about 45 min there was still not enough water in the well to allow the pump to produce any water. The water that was pumped was muddy. The specific conductance of the water pumped was 917 µS/cm. No water could be pumped to allow collection of a sample through the filtration apparatus. The estimated dissolved solids content of the water is 541 mg/L.
Test Well #2: The well was first pumped with a 3-in. submersible then pumped with the Grundfos pump. The temperature remained constant at 13.2 °C during the pumping. The conductance remained nearly constant during pumping, rising only from 671 to 673 µS/cm from the start of pumping with the 3-in. submersible pump to near the end of the Grundfos pumping. Two sets of samples were collected, one at 32 min and one at 53 min of pumping with the Grundfos pump. The results of the chemical analyses (Table 3) indicate that the quality of the water for the two sample sets remained the same (within the estimated analytical error). Thus, the samples collected are representative of the water expected in the aquifer. The water is fresh, is very hard, and has a very low nitrate concentration. Although the dissolved iron content is less than the recommended level for drinking waters of 0.3 mg/L, the manganese is somewhat above the recommended level of 0.05 mg/L.
Test Well #3: The well was first pumped with a 3-in. submersible then pumped with the Grundfos pump. The temperature of the water remained constant at 13.3 °C. The specific conductance of the water rose slightly from 738 µS/cm at 6 min to 749 µS/cm at 81 min after start of pumping with the 3-in. submersible pump. Two sets of samples were collected, one after 18 min and one at 25 min of pumping with the Grundfos pump. The results of the chemical analyses (Table 3) indicate that the quality of the water for the two sample sets remained the same (within the estimated analytical error). Thus, the samples collected are representative of the water expected in the aquifer. The water is fresh, is very hard, and has a very low nitrate concentration. Both the dissolved iron and manganese contents are substantially greater than the recormnended level for drinking waters of 0.3 mg/L and 0.05 mg/L, respectively.
Test Well 31-96: The well was pumped with a 3-in submersible for 21 min and then with the Grundfos pump. The temperature of the water was 13.8 °C. However, the temperature of the ground water is probably about a-half degree cooler because the location required that a substantial section of the hose from the well lie in the sun on a day when the air temperature was about 30 °C. The specific conductance of the water was 1,166 µS/cm. One sample set was collected 13 min after start of pumping with the Grundfos pump. The data in Table 3 indicate that the water is fresh, is very hard, and has a very low nitrate concentration. Both the dissolved iron and manganese contents are substantially greater than the recommended level for drinking waters of 0.3 mg/L and 0.05 mg/L, respectively. The water contains a higher dissolved solids concentration than the waters from Test Wells #2 and #3. The major dissolved constituents that are in substantially greater concentrations than in waters from Test Wells #2 and #3 are calcium, bicarbonate, and chloride.
Surface Water from the Delaware River: The specific conductance of Delaware River water was measured below the Route 20 bridge near Test Well #3 (954 µS/cm) and just to the southwest of Test Well #2 (925 µS/cm). The estimated dissolved solids concentrations for Delaware River water near Test Wells #2 and #1 are 562 mg/L and 545 mg/L, respectively. The flow in the Delaware River was estimated to be between 1 and 2 cfs at the Test Well #2 location.
All of the ground and surface waters sampled or for which specific conductance was measured are fresh (contain less than 1,000 mg/L TDS). The ground water with the highest dissolved solids content is from the Test Well 31-96. This well is only about 300 ft north-northwest of Test Well #3 that yields water with a substantially lower TDS concentration. The water from Test Well #2 is the freshest. The low flow of the Delaware River contains a higher TDS content than the ground water from Test Wells #2 and #3. This probably reflects slightly mineralized ground water flowing from the Permian bedrock into the river and into the alluvium upstream that discharges water to the river. Higher flows of the river would be expected to be much fresher based on water-quality data for Kansas.
All of the ground waters analyzed are very hard but have very low nitrate concentrations. The major dissolved constituents that vary with increasing TDS are calcium, bicarbonate, and chloride. Dissolved iron concentrations are much greater than the recommended level of 0.3 mg/L for drinking water in Test Wells #3 and 31-96, whereas manganese contents are greater than the recommended level of 0.05 mg/L in waters from all test wells sampled. The main problems from high iron and manganese concentrations are the reddish-brown to brown color of the iron and manganese oxides and oxyhydroxides that can precipitate from the water, and the potential plugging of the water wells and the water system from these precipitates. Although removal of the iron and manganese during the treatment of the water before use could solve the problem of the stain coloring, the precipitation and clogging of the well screens in the subsurface could be a considerable maintenance problem. The formation of the iron and manganese oxide scale on well screens is aided by iron and manganese bacteria. The bacterial and n-Lineral mat can substantially reduce well yields if the wells are not routinely treated to prevent the iron and manganese bacteria from growing and causing the formation of the bacterial and mineral scale.
On the basis of the earlier Ground Water Associates investigation in 1996 and the present KGS field study, the most productive ground-water source on the reservation appears to be in the Delaware River valley. However, Ground Water Associates did not evaluate the glacial drift in the northern part of the reservation and based on our literature review, the KGS concluded that test drilling in these materials would be time consuniing and very costly. As a result we chose to focus more on the Delaware River valley near the water-treatment facility for the reservation.
Although the results from Test Well #1 are disappointing, this does not rule out the possibility that a wellfield could be located in this part of the valley. Well development was a problem which could have been exacerbated by the tendency for plugging of the borehole wall by fine sediment from the augering of the borehole. In our case the well was not producing water at a sufficient rate to remedy the plugging of the borehole adjacent to the well screen. This can be a problem for wells installed using hollow-stem augers. Thus, this area merits further investigation.
In the other two areas KGS investigated, potential ground-water supplies are available for development. However, based on our limited drilling and testing a number of issues need to be resolved before proceeding with wellfield construction. It is clear from our drilling and from the work of Ground Water Associates that a productive sand and gravel aquifer exists at the base of the alluvium in the NE quarter of Section 31 and the SE quarter of Section 30, T. 4 S., R. 16 E. However, the extent of this aquifer is unknown and its hydraulic connection to the river was not investigated and should be. If a source that will augment surface water supplies from the river is desired and if there is good hydraulic connection between the aquifer and the river, then pumping will draw water into the aquifer and reduce surface-water flow upstream of the diversion dam. This will not result in a net gain of water to the reservation. If on the other hand the hydraulic connection between the aquifer and the river is poor, then the aquifer is confined and pumpage will most likely exceed natural and possibly induced recharge to the aquifer. This may predispose the aquifer to depletion. Following directly from these issues is the question of how best to design the wellfield. It is clear from our pumping that drawdowns are large even at low pumping rates over short periods of time. This suggests that batteries of very low yielding wells would have the least impact on the water resource and might allow at least short-term use of this source for water supply.
Alternatively, other more prolific, water producing zones have been documented in nearby Atchison, Jackson, and Nemaha counties (Figure 13). Denne et al. (1998) indicates the presence of a major buried valley system within a few miles of southwest comer of the reservation that extends across northern Jackson, and most of Nemaha counties. Several public water supplies use the sand and gravel deposits near the base of the glacial deposits. The well locations for these public water supplies are indicated on the map of the subsurface bedrock topography. Many of the wells producing from these aquifers report sustained yields on the order of 100 gpm or more. To the east of the reservation, Bayne and Schoewe (1967) mapped a glacial outwash deposit that extends through the western part of T. 4 S., R. 18 E. and into the northweast part of T. 4 S., R. 17 E. They reported that the community of Everest has a well in these deposits in Atchison County that is capable of producing. water at 250 gpm with only 9 ft of drawdown. In Figure 13, the trend of these deposits, taken from the Bayne and Shoewe report, is indicated by a dashed line.
Figure 13. Map of the subsurface bedrock topography in Nemaha, Brown, western Doniphan, northern Jackson, western Atchison, and northwestern Jefferson counties in northeastern Kansas from Denne et al (1998). A major northwest-southeast trending buried valley system is present beneath the glacial deposits in Nemaha and northern Jackson counties. The axis of this buried valley system is within a few miles of the southwestern edge of the Kickapoo Indian Reservation. Shown on the map as dots are the public water-supply well locations taken from the WWC-5 records of water-well completion. The numbers next to the dots indicate the number of wells at each location. Shown by a dashed line also is the trend of a glacial outwash deposit in Brown County taken from Bayne and Schowe (1967). A large version of this figure is available.
Bayne, C.K., and Schoewe, W.H., 1967, Geology and ground-water resources of Brown County, Kansas: Kansas Geological Survey, Bulletin 186, 68 p. [available online]
Bayne, C.K., 1967, Supplemental sample logs of test holes Brown County, Kansas: Kansas Geological Survey, Open-File Report 67-1.
Denne, J.E., Miller, R.E., Hathaway, L.R., and O'Connor, H.G., 1990a, Hydrogeology and geochemistry of glacial deposits in northeastern Kansas: test-hole and well data: Kansas Geological Survey, Open-File 90-23a, 145 p. [available online]
Denne, J.E., Miller, R.E., Hathaway, L.R., and O'Connor, H.G., 1990b, Hydrogeology and geochemistry of glacial deposits in northeastern Kansas: water quality data: Kansas Geological Survey, Open-File 90-23b, 55 p. [available online]
Denne, J.E., Miller, R.E., Hathaway, L.R., and O'Connor, H.G., 1998, Hydrogeology and geochemistry of glacial deposits in northeastern Kansas: Kansas Geological Survey, Bulletin 229, 127 p. [available online]
Ground Water Associates, 1996, Test-hole, test-well, and water-quality data from an investigation of groundwater resources on the Kickapoo Indian Reservation.
Test-hole logs and test-hole results from Ground Water Associates, Inc., Wichita, KS
SW corner of SE1/4--Brown County
Sec. 35, T. 4 S., R. 15 E.
283' N of Center Road
27' east of fence line
| View Page 1--Tests 1, 2, and 3 | View Page 2--Tests 4, 5, 6, and 7 | View Page 3--Tests 8, 9, 10, and 11 | ||
| View Page 4--Tests 12, 13, 14, and 15 | View Page 5--Tests 16 and 17 | View Page 6--Tests 18 and 19 | ||
| View Page 7--Tests 20 and 21 | View Page 8--Tests 22, 23, 24, 25 | View Page 9--Tests 26, 27, and 28 | ||
| View Page 10--Tests 29, 30, and 31 | ||||
Kansas Geological Survey, Geohydrology
Placed online December 2000
Comments to webadmin@kgs.ku.edu
The URL for this page is HTTP://www.kgs.ku.edu/Hydro/Publications/OFR00_31/index.html