![]()
Prev Page--Geology || Next Page--Recharge, Discharge, and Permeability
Ground Water
Principles of Occurrence
The following discussion on the occurrence of ground water has been adapted from Meinzer (1923, pp. 2-102), and the reader is referred to his report for a more complete discussion of the subject. A summary of considerations on this subject is also given by Moore and others (1940, pp. 1-34).
Hydrologic Properties of Water-bearing Materials
The principal hydrologic properties of water-bearing materials are permeability and specific yield. Permeability is a measure of the ability of a material to transmit water; specific yield is a measure of the quantity of water that the material will yield when it is drained. The permeability and specific yield are dependent upon the size and distribution of the pore spaces of the material, which in turn are dependent upon the size and distribution of the particles composing the material. The properties--interstices and porosity--that control the specific yield and permeability of rocks will be discussed in the following pages. Specific yield of rocks is taken up in the latter part of this section; permeability of rocks will be discussed in a later section.
Porosity
The rocks and rock materials that form the crust of the earth contain many open spaces or voids called interstices, which are the receptacles that hold the water that is found below the surface of the land and that is recoverable through springs and wells. There are many kinds of rocks and rock materials in Jewell County--limestone, sandstone, shale, and alluvium--and they differ greatly in the number, size, shape, and arrangement of their interstices; hence, they differ greatly in their properties as containers of water. The occurrence of water in the rocks is therefore determined by the character, distribution, and structure of the rocks--that is, by the geology of the rocks. Most rocks have many interstices of very small size; however, some limestones are characterized by a few large openings, such as joints or caverns. In most rocks the interstices are connected, and the water can move through the rocks by percolating from one interstice to another; but in some rocks the interstices are largely isolated, and the water has little opportunity to percolate. The interstices are generally irregular in shape, and different kinds of rocks have different types of irregularities. The differences in rock interstices result from the differences in the minerals from which the rocks are composed and from the diversity of geologic processes by which they were produced or later modified.
The porosity of a rock is expressed quantitatively as the percentage of the total volume of the rock that is occupied by interstices--not occupied by solid rock material. The porosity of a sedimentary deposit depends chiefly on the shape and arrangement of its particles, the degree of assortment of its particles, the cementation and compacting to which it has been subjected since its deposition, and the fracturing of the rock resulting in joints and other openings. Well-sorted deposits of uncemented gravel, sand, or silt have a high porosity regardless of whether they consist of large or small grains. A material will have the same porosity whether it consists of large or small grains if other conditions are the same. If the material is poorly sorted, small particles occupy the spaces between the larger ones and the porosity is greatly reduced. Relatively soluble rock, such as limestone, though originally dense, may become cavernous as a result of the removal of part of its substance by the solvent action of percolating water. Hard, brittle rock, such as the Fort Hays limestone member, may acquire large interstices through fracturing resulting from shrinkage, deformation of the rocks, or other agencies.
A correlation need not exist between the porosity and permeability of a material; a rock may contain many large but disconnected interstices and thus have a high porosity yet a low permeability. A clay may have a very high porosity (higher than some gravels) but a very low permeability.
Specific yield
Not all the water in the interstices is available for recovery through wells--a fact of great practical importance in making ground-water developments in Jewell County where the water supplies are obtained largely from storage and depend on periodic replenishment from precipitation. A part of the water in the interstices will drain into wells, and a part will be retained by the rock formations. The part that will drain into wells is called the specific yield, and the part that is retained by the rocks is called the specific retention. The specific yield and specific retention are expressed in percentages of the total volume of material. The specific yield and the specific retention of a rock or soil are together equal to the porosity. The porosity, however, is not an index to the specific yield. Clayey or silty formations may contain large amounts of water and yet be unproductive and worthless as a source of water supply, whereas a compact but fractured rock may contain much less water but yield abundantly.
Lugn and Wenzel (1938, p. 90) report that the loess in the Platte River valley, Nebraska, has a specific yield of about 20 percent. They reported that the Pleistocene sand and gravel near Grand Island, Kearney, and Lexington has a specific yield of about 24 percent. Two samples of soil collected near Lexington had specific yields of 4.4 and 21.7, respectively. R. C. Cady stated in an unpublished report on the geology and ground-water resources of Franklin, Webster, and Nuckolls counties, Nebr., that a sample of Loveland loess collected in the Republican River valley in Nebraska had a specific yield of 10 percent and that the alluvium beneath the river flood plain has a specific yield of about 18 percent.
The Cretaceous shales in Jewell County yield essentially no water. Data are not available for making a reliable estimate of the specific yield of the Niobrara formation and the surficial deposits in Jewell County, but it is probably very low--possibly 10 percent or less.
Classification of Subsurface Water
Water occurs underground in two major zones classified according to their water content. The lower zone is called the zone of saturation, and the voids in this zone are filled with water. It is this zone that furnishes water directly to springs and wells. Between the zone of saturation and the land surface, the interstices generally are only partly filled with water. This unsaturated zone is called the zone of aeration.
The upper surface of the zone of saturation in permeable soil or rock is called the water table. Where the upper surface is formed by impermeable rock, there is no water table. When a well is sunk, it yields no water until it reaches a saturated zone.
The zone of aeration varies in thickness from place to place according to the depth to the water table. In swampy tracts it is absent, the zone of saturation being about at the surface. In many places in Jewell County the water table is absent, and the zone of aeration extends down to the underlying shale.
The zone of aeration is divided according to the occurrence and circulation of its water into three belts--the belt of soil water, the intermediate belt, and the capillary fringe. The belt of soil water consists of soil and other materials that lie near enough to the surface to discharge water into the atmosphere in perceptible quantities through plants or by soil evaporation. The capillary fringe is the belt immediately above the water table that contains water drawn up from the zone of saturation by capillary action; the lower part of the fringe is saturated but the water is under tension and will not enter a well. Thus the "zone of saturation" as used in this report is that beneath the level at which the water is at atmospheric pressure--the water table. The intermediate belt lies between the capillary fringe and the belt of soil water. Where the water table lies near the surface, the capillary fringe and the belt of soil water join, and the intermediate belt is absent.
In Jewell County, ground water is derived almost entirely from precipitation in the form of rain or snow. Part of the water that falls as rain or snow is carried away by surface runoff and flows into streams, part of it evaporates, and part of it is absorbed by the soil and later transpired into the atmosphere by vegetation. The part that escapes surface runoff, evaporation, and transpiration percolates downward through the zone of aeration until it reaches the water table. According to Meinzer, percolation from the zone of aeration to the zone of saturation ceases when the amount of unsaturated pore spaces in the zone of aeration is equivalent to the specific yield; or, the amount of water retained in the zone of aeration is equal to the specific retention. The amount of water in the soil zone may be reduced below the specific retention by evaporation and transpiration; however, the definition of specific retention is based on the assumption that the water content in the intermediate belt becomes less than the specific retention only through long-continued slow evaporation, not through drainage.
The Water Table and Movement of Ground Water
Shape and Slope
The water table is not a level static surface. It fluctuates in response to recharge to and discharge from the zone of saturation; also, it has irregularities comparable with and related to those of the land surface, although it is less rugged. The shape of the water table, which in turn determines the direction of movement of ground water, is controlled by many factors--the differences in permeability of the water-bearing materials, topography, the configuration of the underlying Cretaceous floor, amount and distribution of precipitation, and the method of discharge of the ground water.
The water table is not continuous throughout Jewell County. Many test holes have been drilled to the impervious underlying shales without penetrating a saturated zone. Some producing water wells are within 10 feet of dry holes. In the areas tested, the underlying shale was generally within 50 feet of the land surface. The dry holes are caused partly by local differences in permeability. Some are caused by high rates of discharge by transpiration in local areas. The field work of this investigation was done during the growing season and many of the test holes that were dry then might not have been dry in more favorable seasons.
Other things being equal, the slope of the water table in general varies inversely with the permeability of the water-bearing material; that is, the water assumes a steeper gradient in flowing through fine material than through coarse material providing the same quantity of water per unit area is moving through both types of material. This is shown by the following law governing the movement of ground water:
Q = PIA
where Q is the quantity of water moving through a given cross-sectional area, P is a coefficient of permeability which gives the quantity of water moving through a unit area under unit hydraulic gradient, I is the hydraulic gradient, and A is the total cross-sectional area through which the water is moving. If Q and A in the equation are held constant, I must increase as P decreases. Thus, in loess, which has a low permeability, the hydraulic gradient will be much greater than it would be in a clean gravel if the same quantity of water per unit area is transmitted.
The water table follows in a general way the configuration of the land surface. Thus in Jewell County the ground water moves from the uplands towards the streams, and if not intercepted by transpiration, it joins with the ground water from the opposite side of the valley and percolates downstream. The water table in Jewell County is generally a few feet below the stream bed. With the exception of Republican River and White Rock Creek, the streams generally receive no ground-water seepage.
An investigation was made at Formoso to determine the direction of movement of the ground water in order to determine whether the municipal wells would receive recharge from a new city reservoir and to aid in the location of new municipal wells. A water-table contour map of the area (Fig. 9), is based on the elevation of the water levels in 26 wells. The data from which this illustration is drawn are given in Table 7. Each contour line has been drawn through points on the water table having approximately the same altitude. The altitude of the water surface in each of the wells used in compiling the map has been referred to sea-level datum. Ground water moves in the direction of maximum slope, which is at right angles to the contours. Sufficient wells were not available near the city reservoir to complete the contours in that area. However, available wells in Formoso show that the ground water at Formoso is moving in a southwesterly direction toward East Marsh Creek. The ground water at the municipal wells comes from the northeast and not from the north and northwest, as generally believed by many residents of the area. Only three wells were measured west of the creek, but they tend to show that the direction of movement of the ground water west of the creek is in general toward the creek, where it joins the ground water moving in from the east side of the creek and then moves down the valley. Seepage water from the reservoir percolates to the south along the stream channel. In order to intercept the ground-water recharge from the reservoir, a well would have to be near the creek. Additional wells along the 1,460-foot contour line on the water table would intercept the ground water moving from the north and east.
Figure 9--Water-table contours and direction of movement of ground water at Formoso.
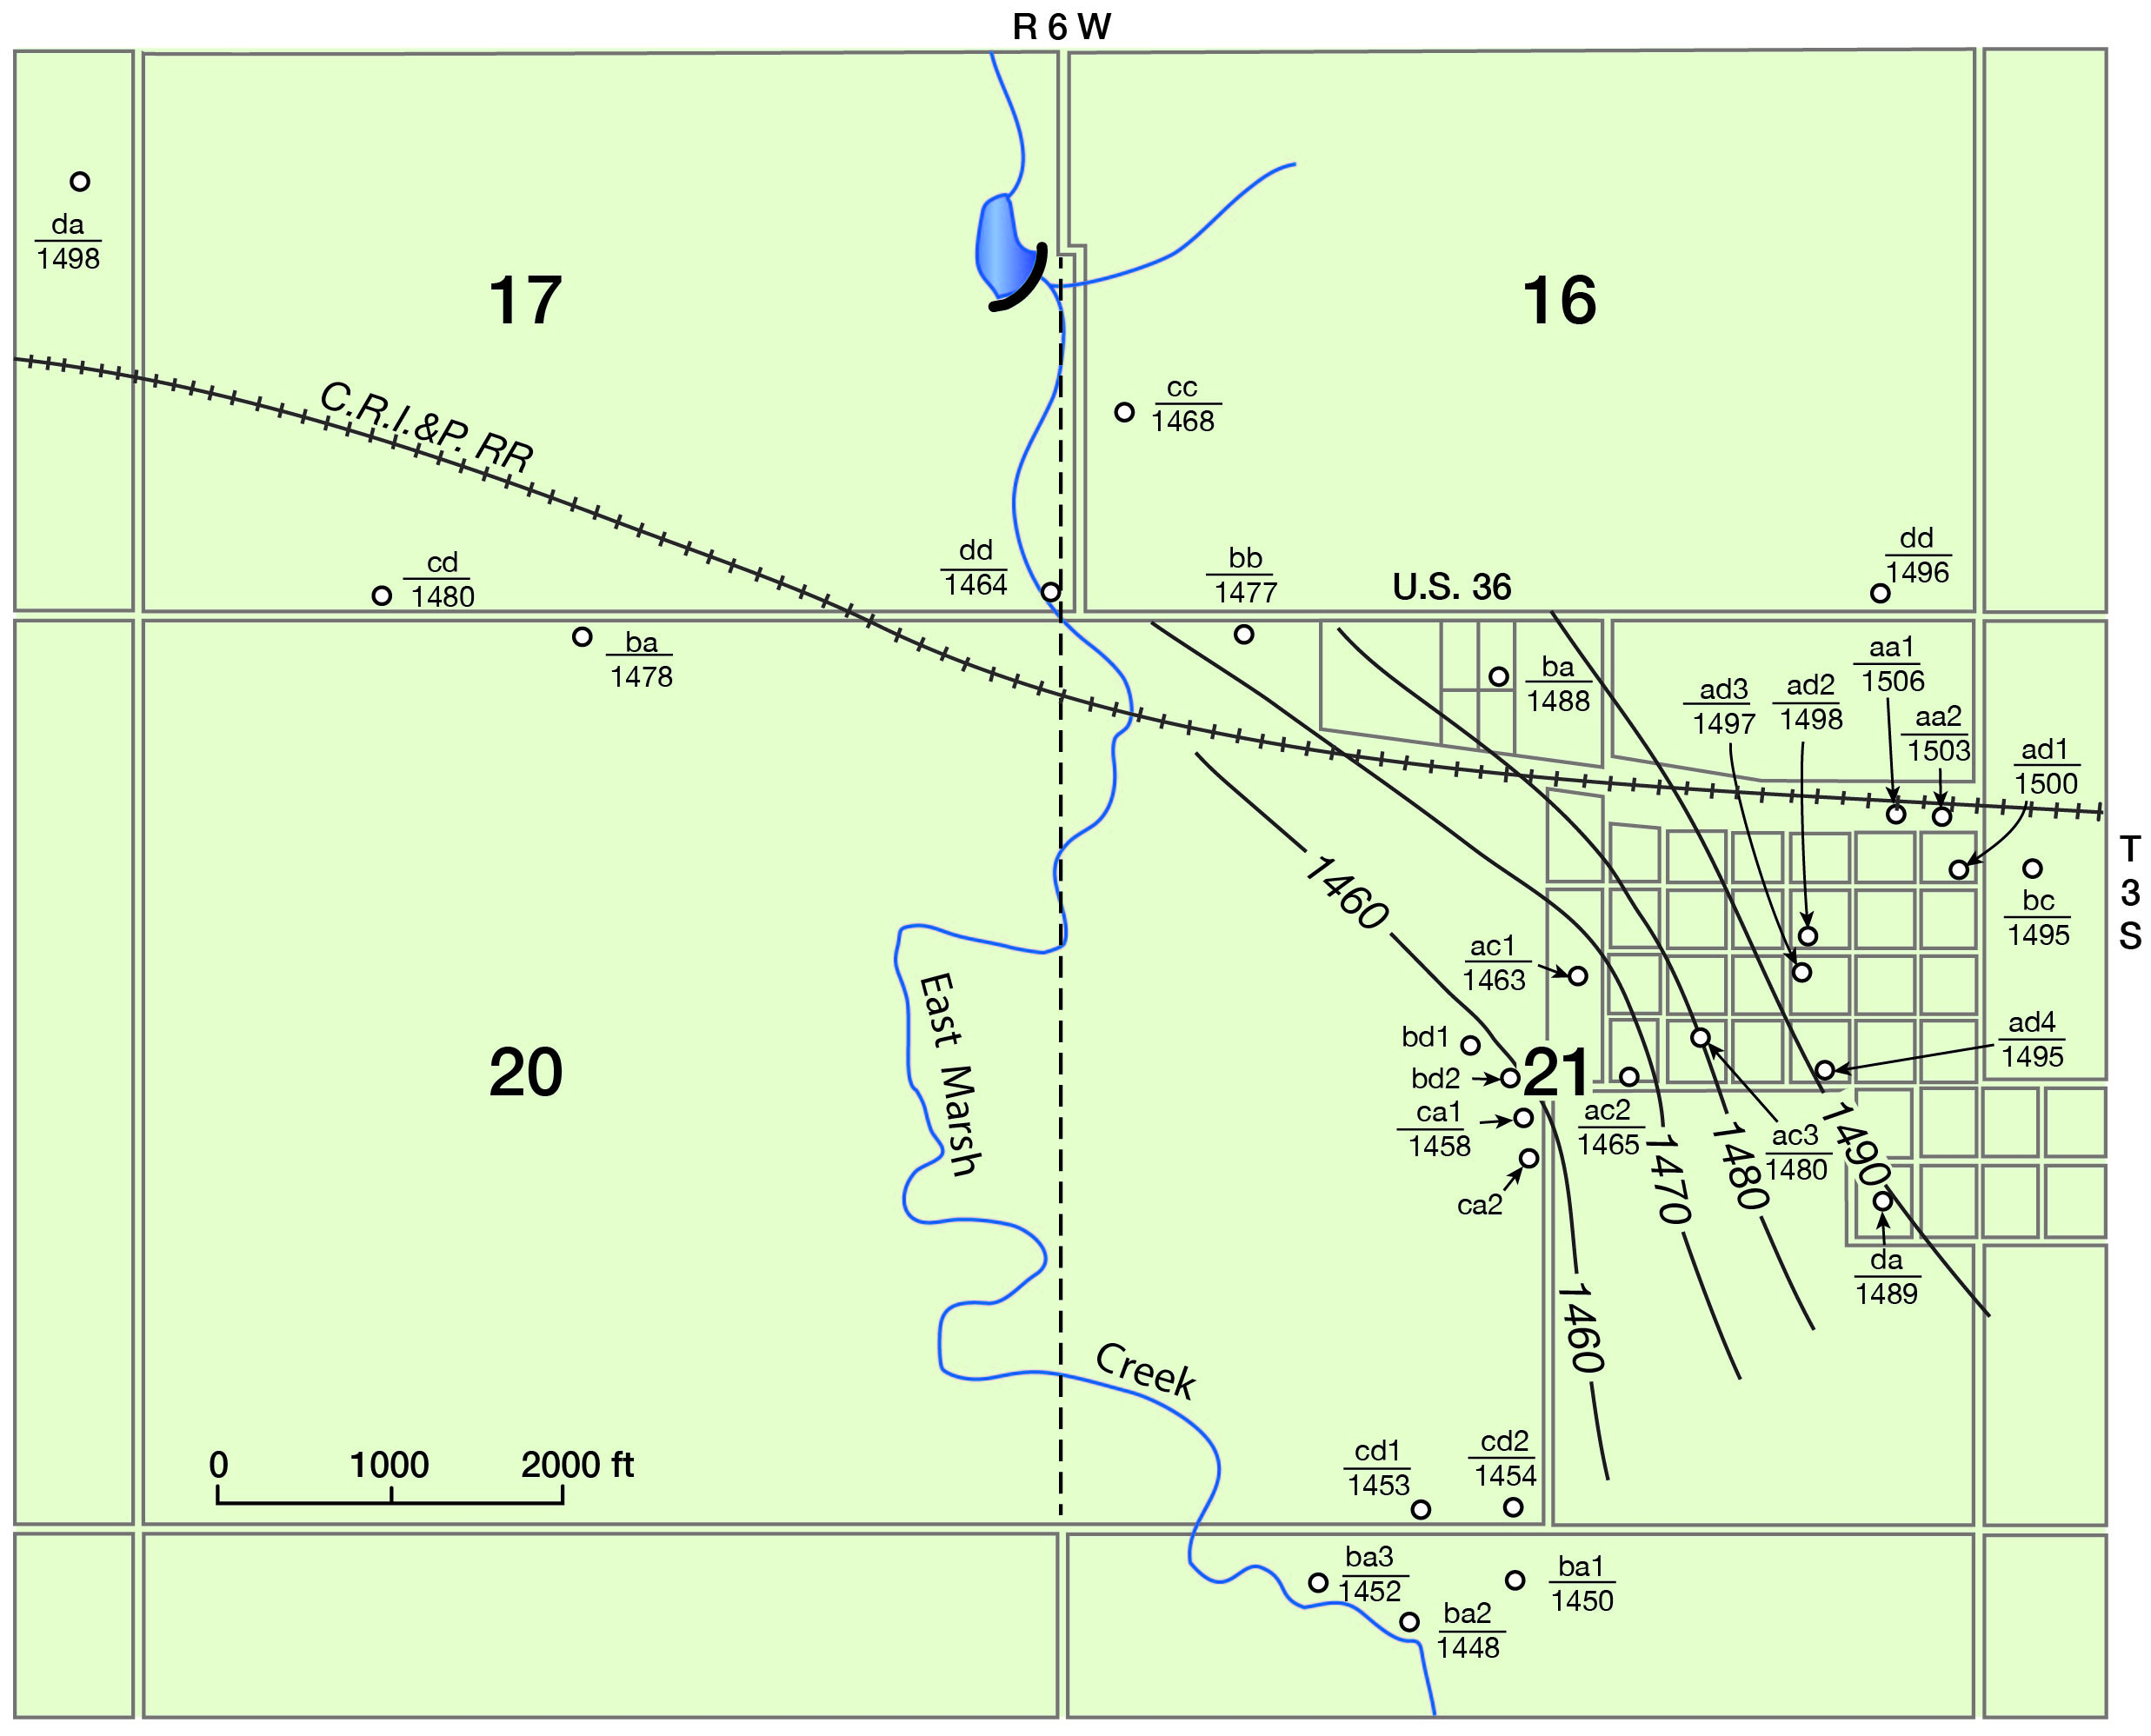
Table 7--Altitude of measuring points and water levels of wells near Formoso. More complete records of these wells are given in Table 17.
| Well No. | Owner | Date October, 1941 |
Height of measuring point above sea level, feet |
Height of water level above sea level, feet |
|---|---|---|---|---|
| 3-6-16dd | Don Keeler | 22 | 1,522.00 | 1,496.38 |
| 3-6-16cc | Robert McCune | 23 | 1,499.08 | 1,467.83 |
| 3-6-17cd | John Magnusson | 22 | 1,489.34 | 1,479.54 |
| 3-6-17dd | R. C. Allen | 22 | 1,483.65 | 1,463.86 |
| 3-6-18da | I. S. Cullen | 23 | 1,506.87 | 1,498.38 |
| 3-6-20ba | Hale Estate | 22 | 1,486.50 | 1,478.40 |
| 3-6-21aa1 | C. R. I. & P. Ry | 22 | 1,515.75 | 1,505.62 |
| 3-6-21aa2 | C. R. I. & P. Ry | 22 | 1,510.69 | 1,503.24 |
| 3-6-21ba | Williams | 22 | 1,510.98 | 1,487.84 |
| 3-6-21bb | W. F. Logen | 22 | 1,500.58 | 1,476.83 |
| 3-6-21ac1 | John Lebhart | 22 | 1,503.55 | 1,463.12 |
| 3-6-21ac2 | Mrs. John Briggs | 22 | 1,494.52 | 1,465.21 |
| 3-6-21ad1 | H. E. Sloan | 22 | 1,509.86 | 1,480.17 |
| 3-6-21ada | Bob Means | 22 | 1,508.63 | 1,499.90 |
| 3-6-21ad2 | Dr. C. W. Inge | 22 | 1,527.87 | 1,498.47 |
| 3-6-21ad3 | T. H. Shedden | 22 | 1,526.16 | 1,497.10 |
| 3-6-21ad4 | Mrs. Pantier | 22 | 1,514.53 | 1,495.18 |
| 3-6-21da | Mrs. J. T. Marr | 22 | 1,518.15 | 1,488.86 |
| 3-6-21ca | Walter Joerg | 22 | 1,494.12 | 1,457.54 |
| 3-6-22bc | Mrs. George Young | 22 | 1,499.22 | 1,494.55 |
| 3-6-21cd1 | Edd Patterson | 23 | 1,468.88 | 1,452.94 |
| 3-6-21cd2 | Edd Patterson | 23 | 1,481.84 | 1,454.16 |
| 3-6-28ba1 | Edd Patterson | 23 | 1,475.03 | 1,450.41 |
| 3-6-28ba2 | Edd Patterson | 23 | 1,467.11 | 1,448.16 |
| 3-6-28ba3 | Edd Patterson | 23 | 1,468.31 | 1,451.78 |
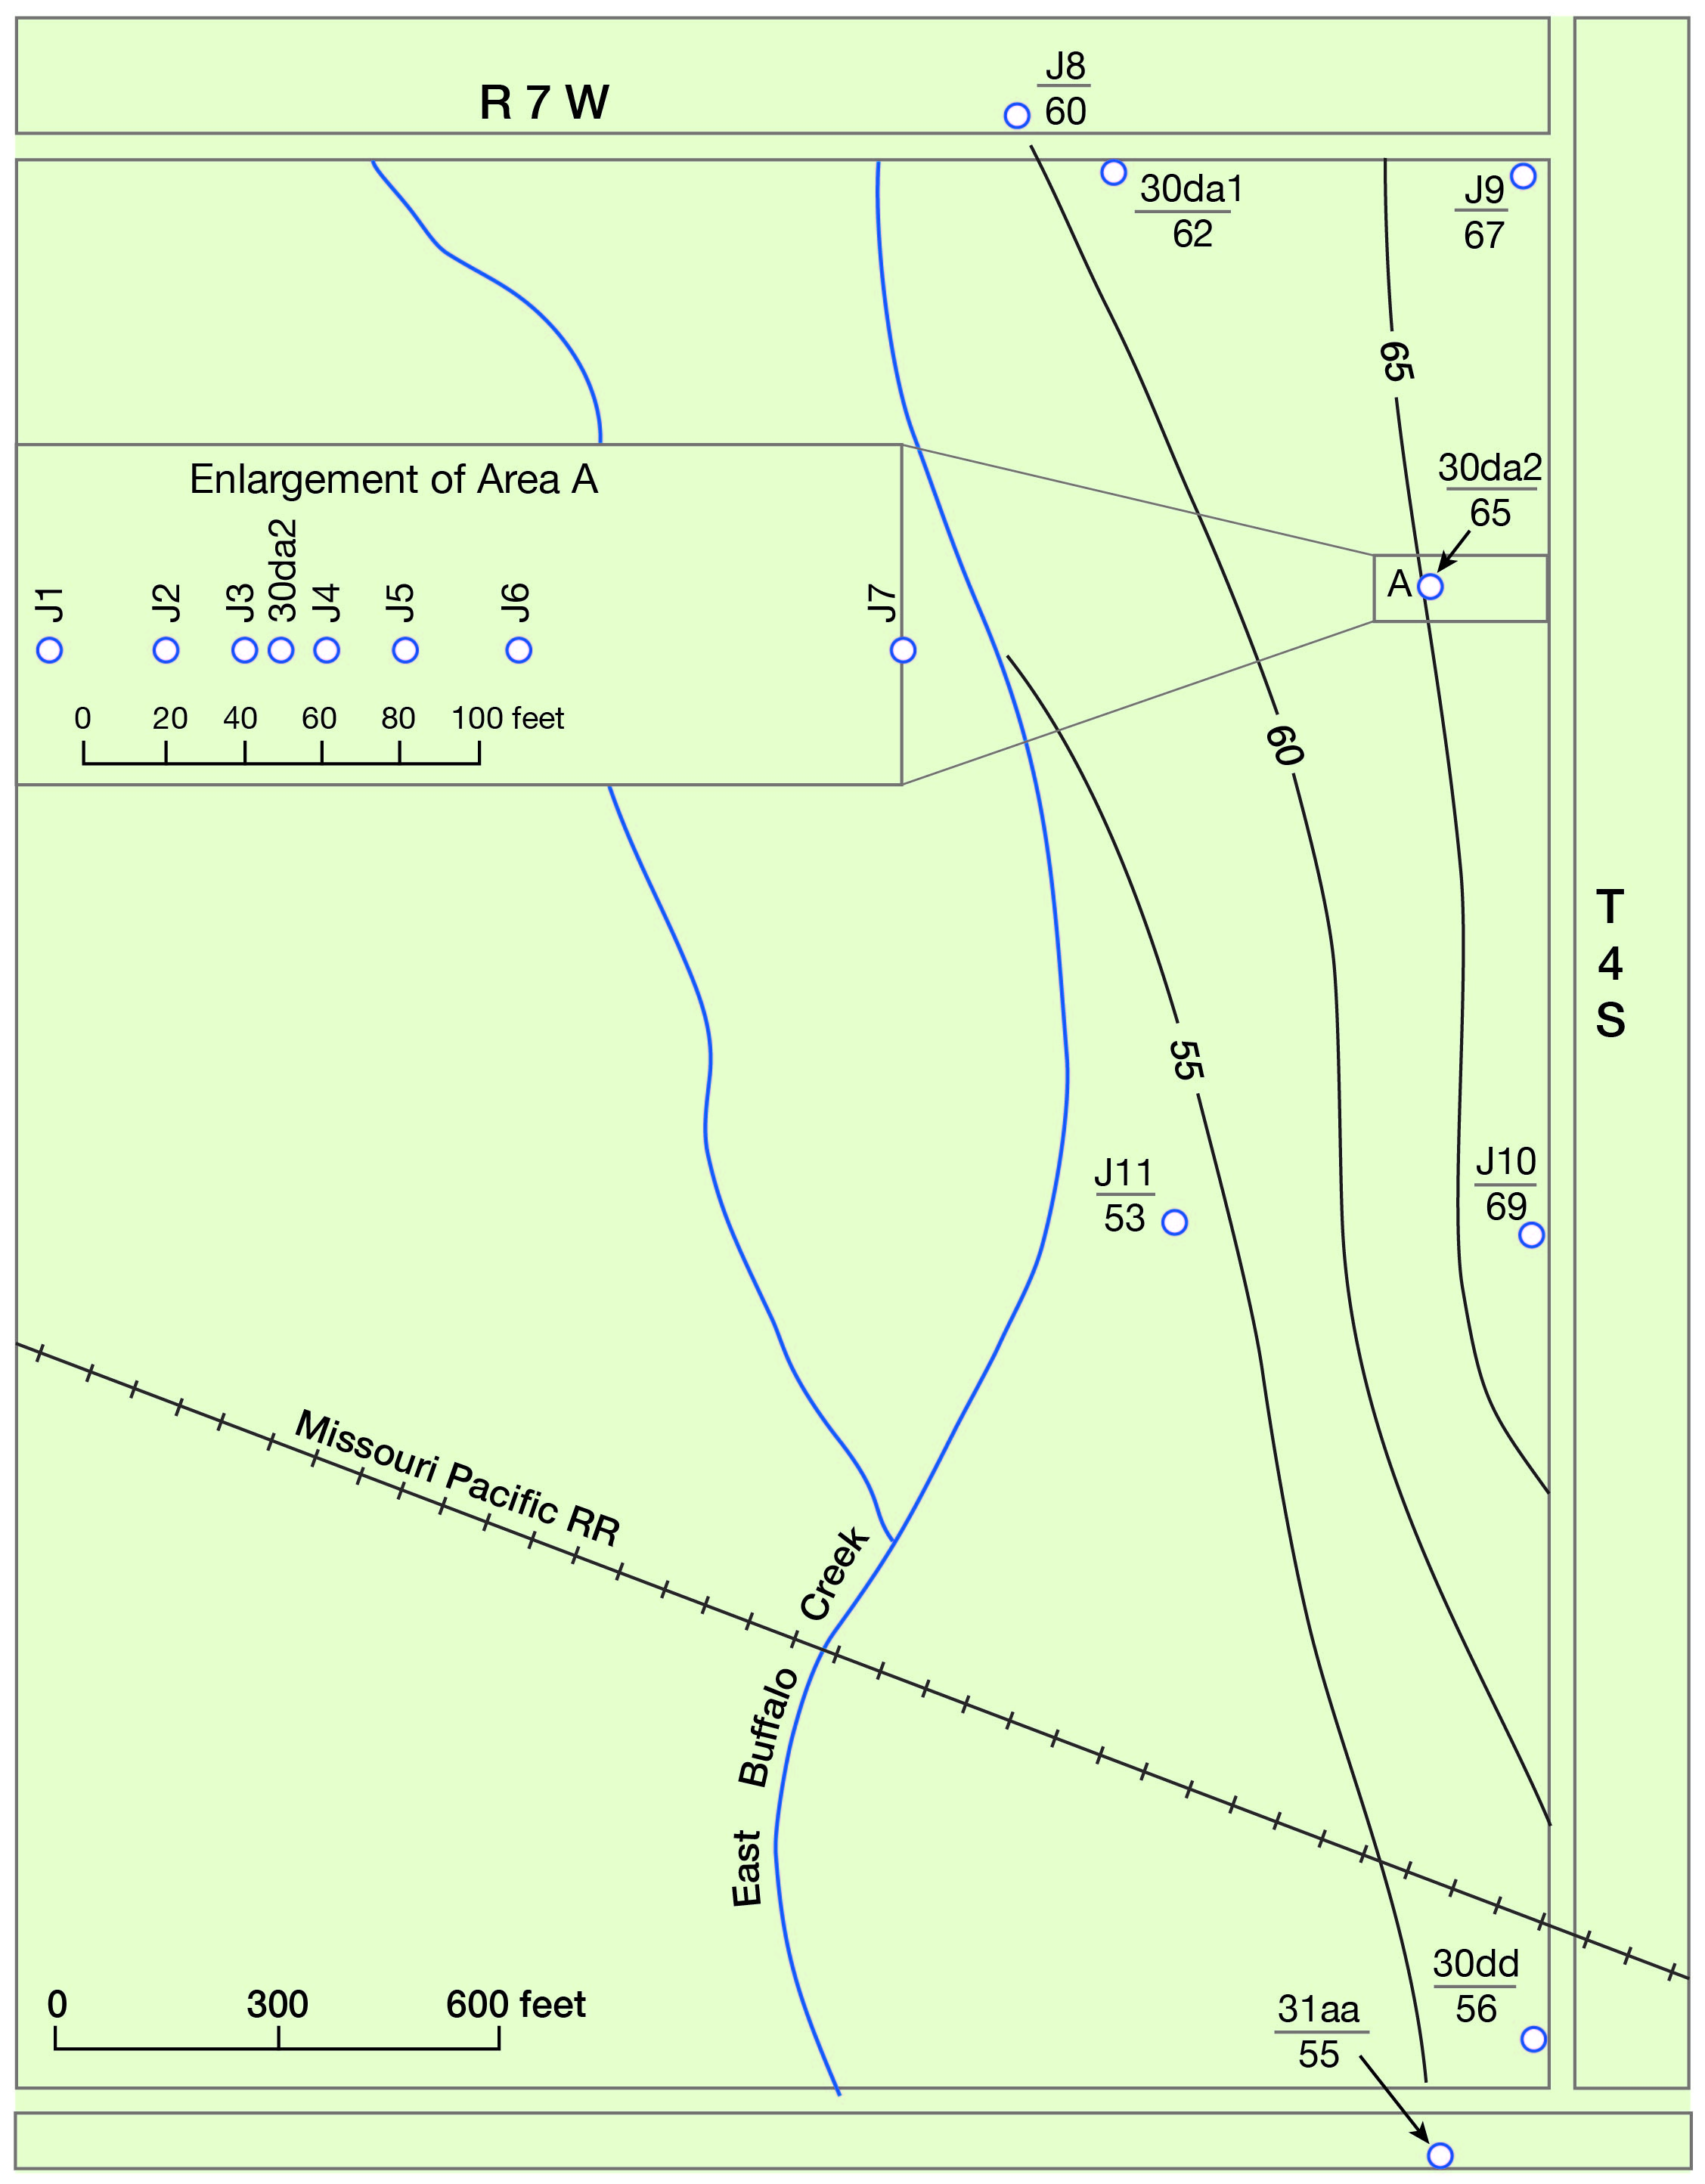
An investigation was made at Jewell City in the municipal well field east of town to determine the permeability of the water-bearing materials and the availability of ground-water supplies. A water-table contour map of the area is shown in Figure 10. The data from which this illustration is drawn are given in Tables 14 and 16. The water-table contours show that the ground water is moving in a southwesterly direction toward the creek and that it has a slope of approximately 85 feet to the mile. The data upon which the map is based were collected in September 1941 when much ground water near the creek was being transpired by trees. During seasons of no transpiration, the water table probably slopes less toward the creek, and the ground water moves in a more southerly direction down the valley.
Figure 10--Water-table contours and direction of movement of ground water in well field at Jewell City.
Other observations in Jewell County show that, in general, the ground water is moving from the uplands toward the valleys. This is contrary to a very prevalent belief among the residents that most of the ground-water recharge comes from seepage from the streams. If the recharge were derived chiefly from streams, the water table would slope from the valleys toward the uplands. The streams do contribute much ground-water recharge during the periods of surface runoff, but the recharge affects the water table only a short distance laterally from the streams, and much of the water drains back into the streams rather soon after their levels fall.
Relation to Topography
In this area the water table follows in a general way the configuration of the surface; it rises under the hills and sinks under the valleys. Its slope nearly everywhere is less than that of the land. Its depth ranges from less than 10 feet along some of the streams to a maximum of about 125 feet in the uplands in the northeastern part of the county.
The relation of the water table to topography is affected and often obscured by variations in the permeability of the underlying rocks. An impervious layer may bring the water table to the surface on a hillside and result in a seep or spring. During periods of heavy precipitation, ground water has been observed to percolate down hillsides from the Fort Hays limestone member which overlies the impervious Carlile shale. The permeability of the material in the zone of aeration under a high hill determines the rate of movement of the soil moisture down to the water table. A thick column of material of low permeability retards ground-water recharge, and, as a result, the water table is lower during wet periods and higher during dry periods than it would be if the material had a high permeability.
Fluctuations in Water Level
The water table is not a stationary surface but a surface that fluctuates much like the water level in a lake or reservoir. Approximate equilibrium existed between the amount of water that was added annually to the ground-water storage and the amount that was discharged annually by natural means prior to any artificial discharge. The addition of considerable artificial discharge to the natural discharge tends to displace the equilibrium and results in a decline of the water table. In general, the water table rises when the amount of recharge exceeds the amount of discharge and declines when the discharge is greater than the recharge. Changes in the water levels in wells indicate whether the ground-water reservoir is being depleted or replenished.
The principal factors controlling the rise of the water table in Jewell County are the amount of rainfall infiltration and the amount of water added to the underground reservoir by seepage from ponds and from streams during periods of flood flow. The principal factors controlling the decline of the water table are the amount of water lost through transpiration and evaporation in stream valleys, the amount percolating back into the streams after periods of high flow, the amount of water pumped from wells, and the amount of water leaving the county beneath the surface by percolation down the valleys. Some ground water discharges into White Rock Creek and Republican River. The other streams in the county receive only surface runoff.
An observation-well program was begun in the Limestone Creek area in 1934. Originally 30 wells were selected for observation; however, as the investigation progressed, new wells were added and several of the original wells were abandoned. A total of 52 wells have been under observation for various intervals. Prior to July 1939 the measurements were made weekly; from July 1939 to 1943 the measurements were made monthly or semimonthly; since 1943 the measurements have been less frequent. The water-level measurements have been published annually by the U. S. Geological Survey (1936-54). Table 8 correlates the observation-well numbers used in this report with those used in the annual water-supply papers. The location and description of each well are given in the table of well records at the end of this report.
Table 8--Observation-well numbers used in this report and corresponding numbers given in annual series of U. S. Geological Survey Water-supply Papers. (U. S. Geological Survey, 1936-54)
| Well No. in this report |
Well No. in water-supply papers |
|---|---|
| 3-8-6cd | 64 |
| 3-9-5aa | 4 |
| 3-9-5ac | 49 |
| 3-9-5cd | 6 |
| 3-9-17cb | 8 |
| 3-9-23dd | 65 |
| 3-9-24dd | 14 |
| 3-9-30 (1) | 12 |
| 3-9-31 (1) | 50 |
| 3-10-18dd1 | 34 |
| 3-10-18dd2 | 34A |
| 3-10-18dd3 | 34B |
| 3-10-18dd4 | 34C |
| 3-10-29ed | 18 |
| 4-9-8dc1 | 52 |
| 4-9-8dc2 | 53 |
| 4-9-8dc3 | 54 |
| 4-9-8dc4 | 55 |
| 4-9-8dc5 | 56 |
| 4-9-8dc6 | 57 |
| 4-9-8dc7 | 58 |
| 4-9-8dc8 | 59 |
| 4-9-8dc9 | 60 |
| 4-9-13cd | 44 |
| 4-9-15bd | 40 |
| 4-9-17ab1 | 51 |
| 4-9-17ab2 | 61 |
| 4-9-17ab3 | 62 |
| 4-9-17ab4 | 63 |
| 4-9-28ca | 30 |
| 4-10-23cc | 48 |
| 4-10-24ca | 45 |
| 5-9-3cd | 47 |
| 5-9-6 (1) | 67 |
| 5-9-6 (2) | 41 |
| 5-9-7 | 69 |
| 5-9-10ab | 22 |
| 5-9-19 | 46 |
| 5-9-25dc | 43 |
| 5-9-29bb | 25 |
| 5-10-1ad | 66 |
| 6-9-27ab | 42 |
Fluctuations caused by precipitation
A relation, made complex by many factors, exists between the amount of water falling as rain or snow and the level at which the water stands in wells. Other things being equal, the greater the precipitation for a given period, the greater the rise in the water level. However, after a prolonged dry spell, the water contained in the soil becomes depleted; then when rain occurs, it must first replenish the soil moisture before any of the water can percolate down to the water table. The temperature also has an influence, for rain that falls on frozen ground is hindered from reaching the water table, and part of the water that falls during the hot summer months is evaporated directly into the air. With the coming of spring, vegetation begins to make heavy demands on soil moisture, and where the roots and trees and other vegetation extend to the water table, they draw water directly from the zone of saturation. Thus, although the rainfall is greater during the summer, the water table generally declines owing to the high consumption of water by vegetation. When the first killing frost occurs in the fall, transpiration of water ceases and, even though there may be no appreciable precipitation, the water level in wells on lowlands may rise. During the winter, at times when the ground is not frozen, precipitation may percolate downward with little loss from evaporation and transpiration; and when the soil moisture has been replenished, a moderate amount of precipitation may cause an appreciable rise in the water table.
Graphs of the fluctuations of the water levels in 12 wells and the cumulative departure from normal precipitation at Burr Oak are shown in Figures 11, 12, and 13. The average height of the water levels in the 12 wells and the cumulative departure from normal precipitation are shown in Figure 14. These graphs show diverse types of water-level fluctuations. The water level in well 4-9-28ca has an annual fluctuation caused by precipitation. The water level declines during the growing season when the amount of water that escapes the roots of the vegetation is very small even though most of the precipitation occurs during the growing season. Beginning about September or October, the amount of infiltration exceeds the transpiration and the excess percolates down to the water table. The water table then rises gradually until the beginning of the next growing season. These annual cycles are broken by abnormally low or high amounts of precipitation. Thus, few of the water levels showed a rise in 1934 when the precipitation was very low. In 1941 and 1942, when the precipitation was high, the water levels rose considerably.
Figure 11--Hydrographs showing fluctuations of the water levels in four observation wells in Jewell County
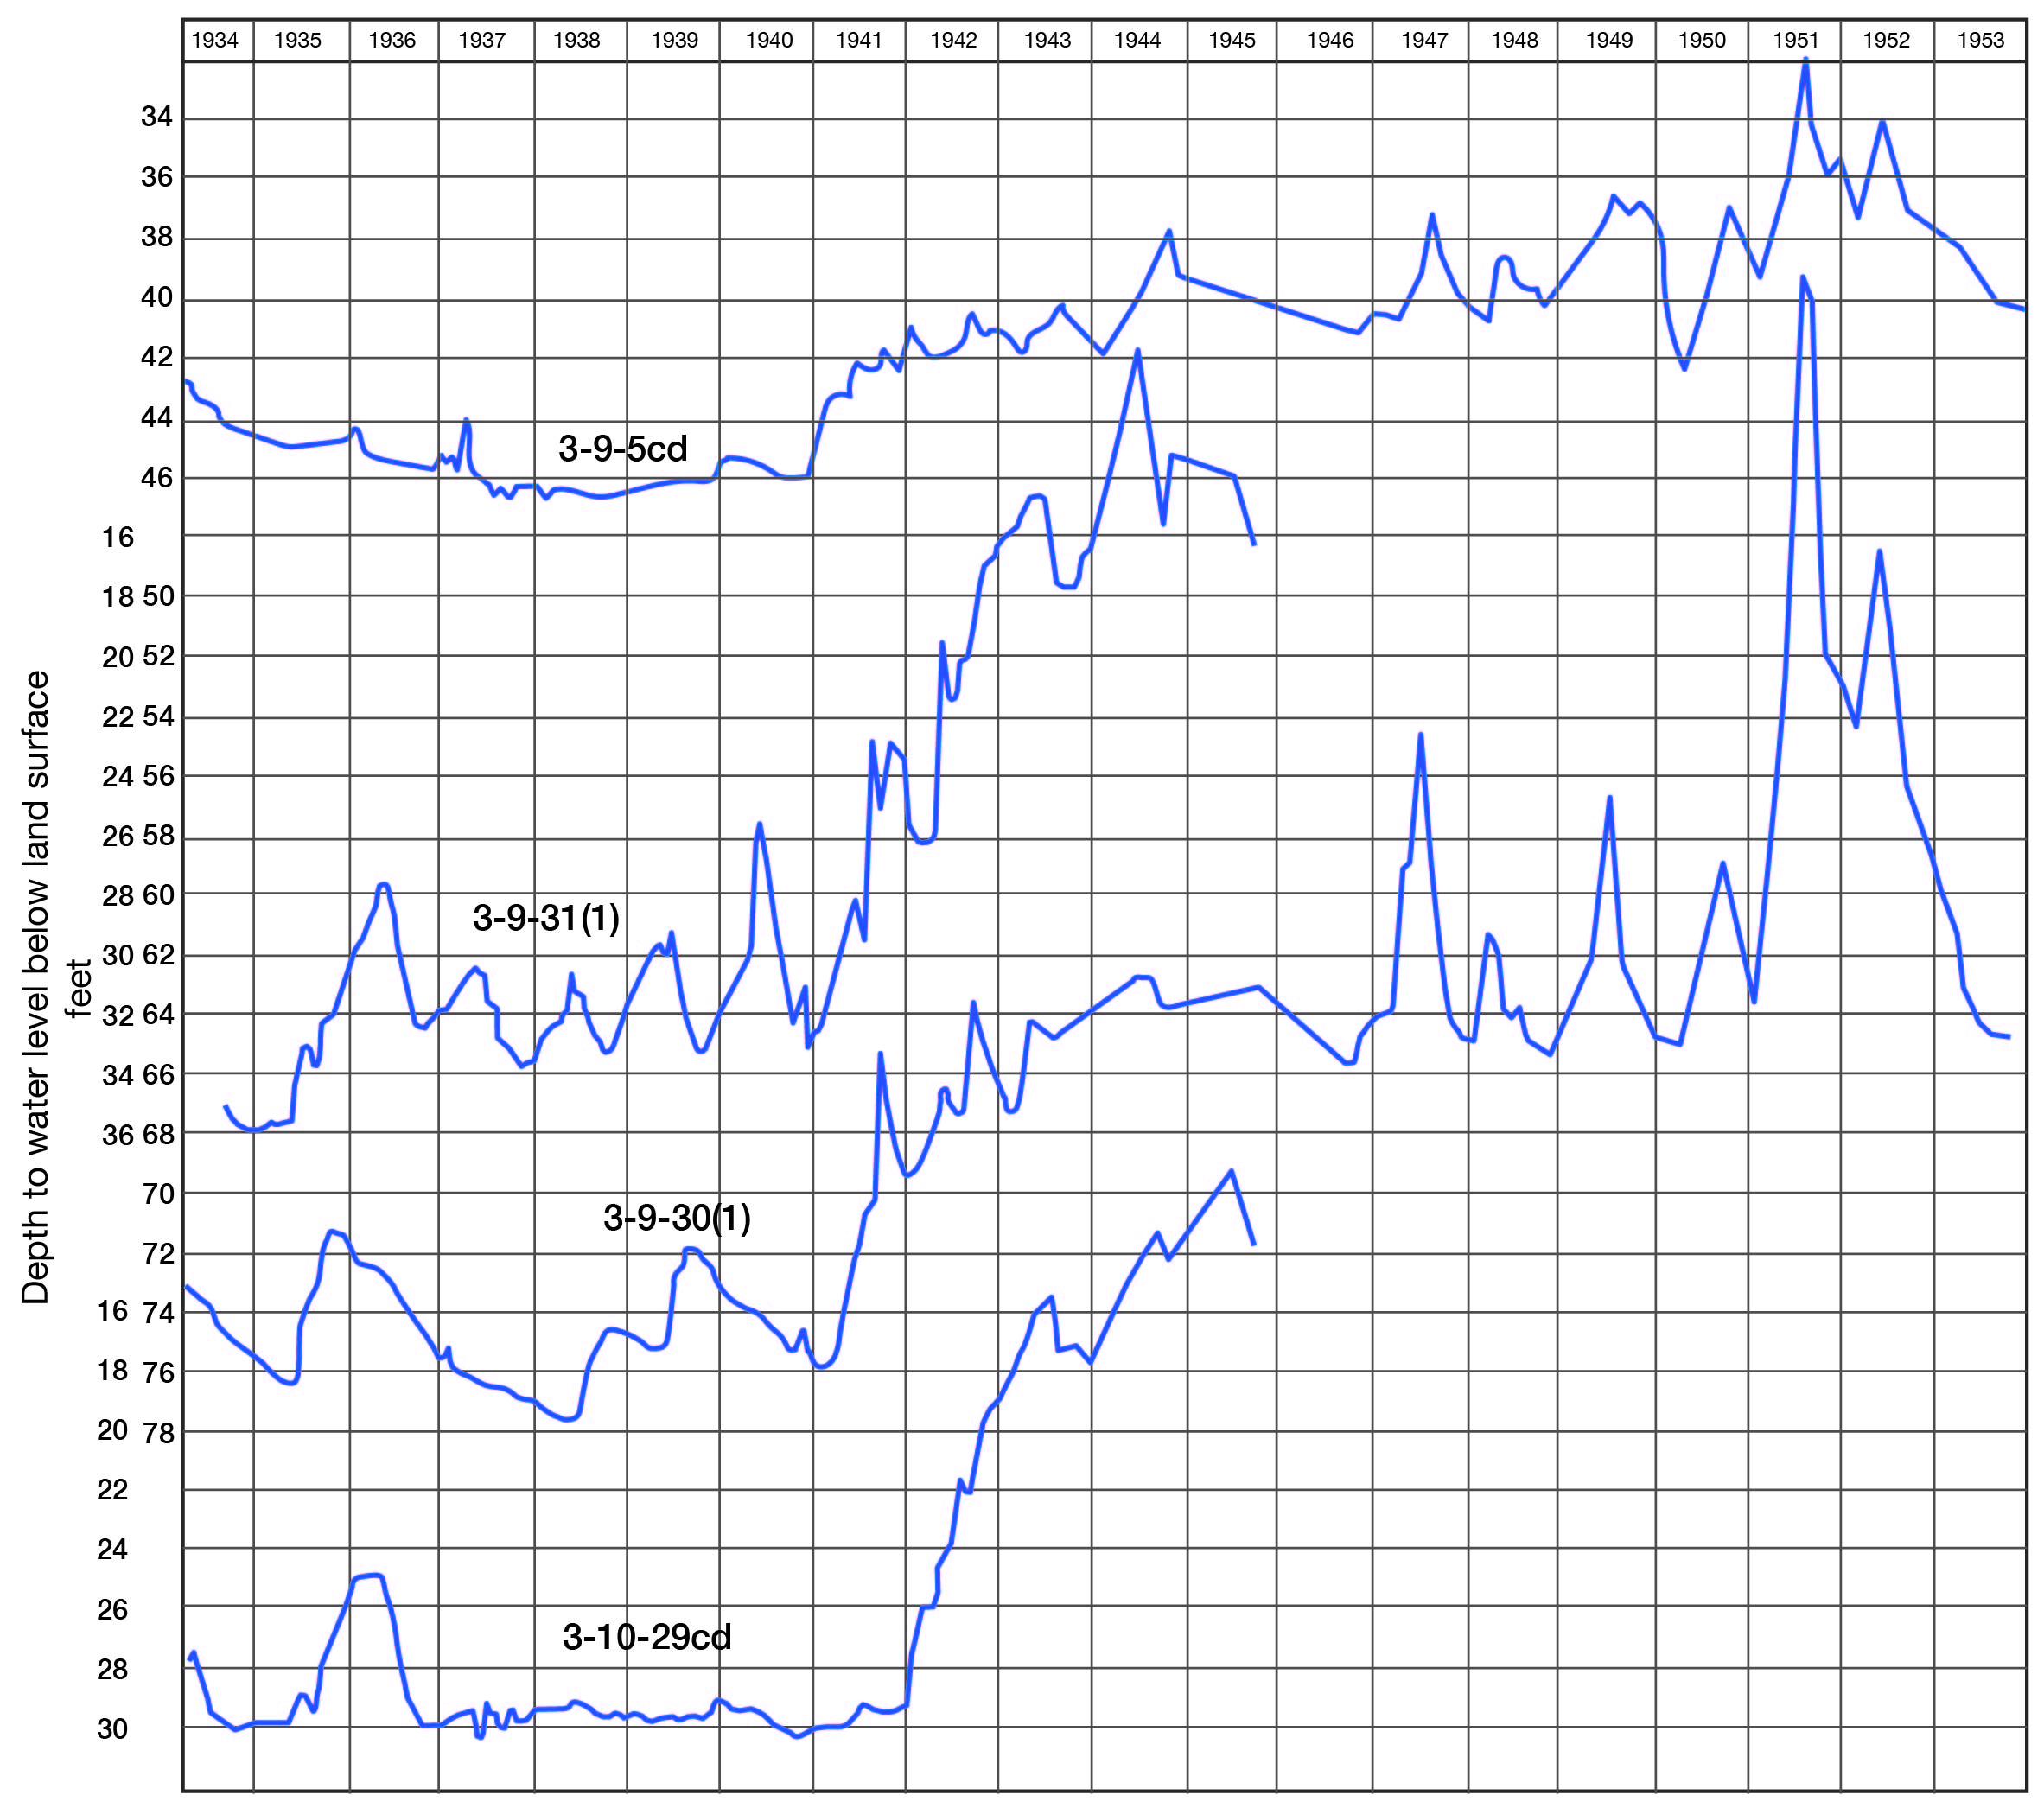
Figure 12--Hydrographs showing fluctuations of the water levels in four observation wells in Jewell County
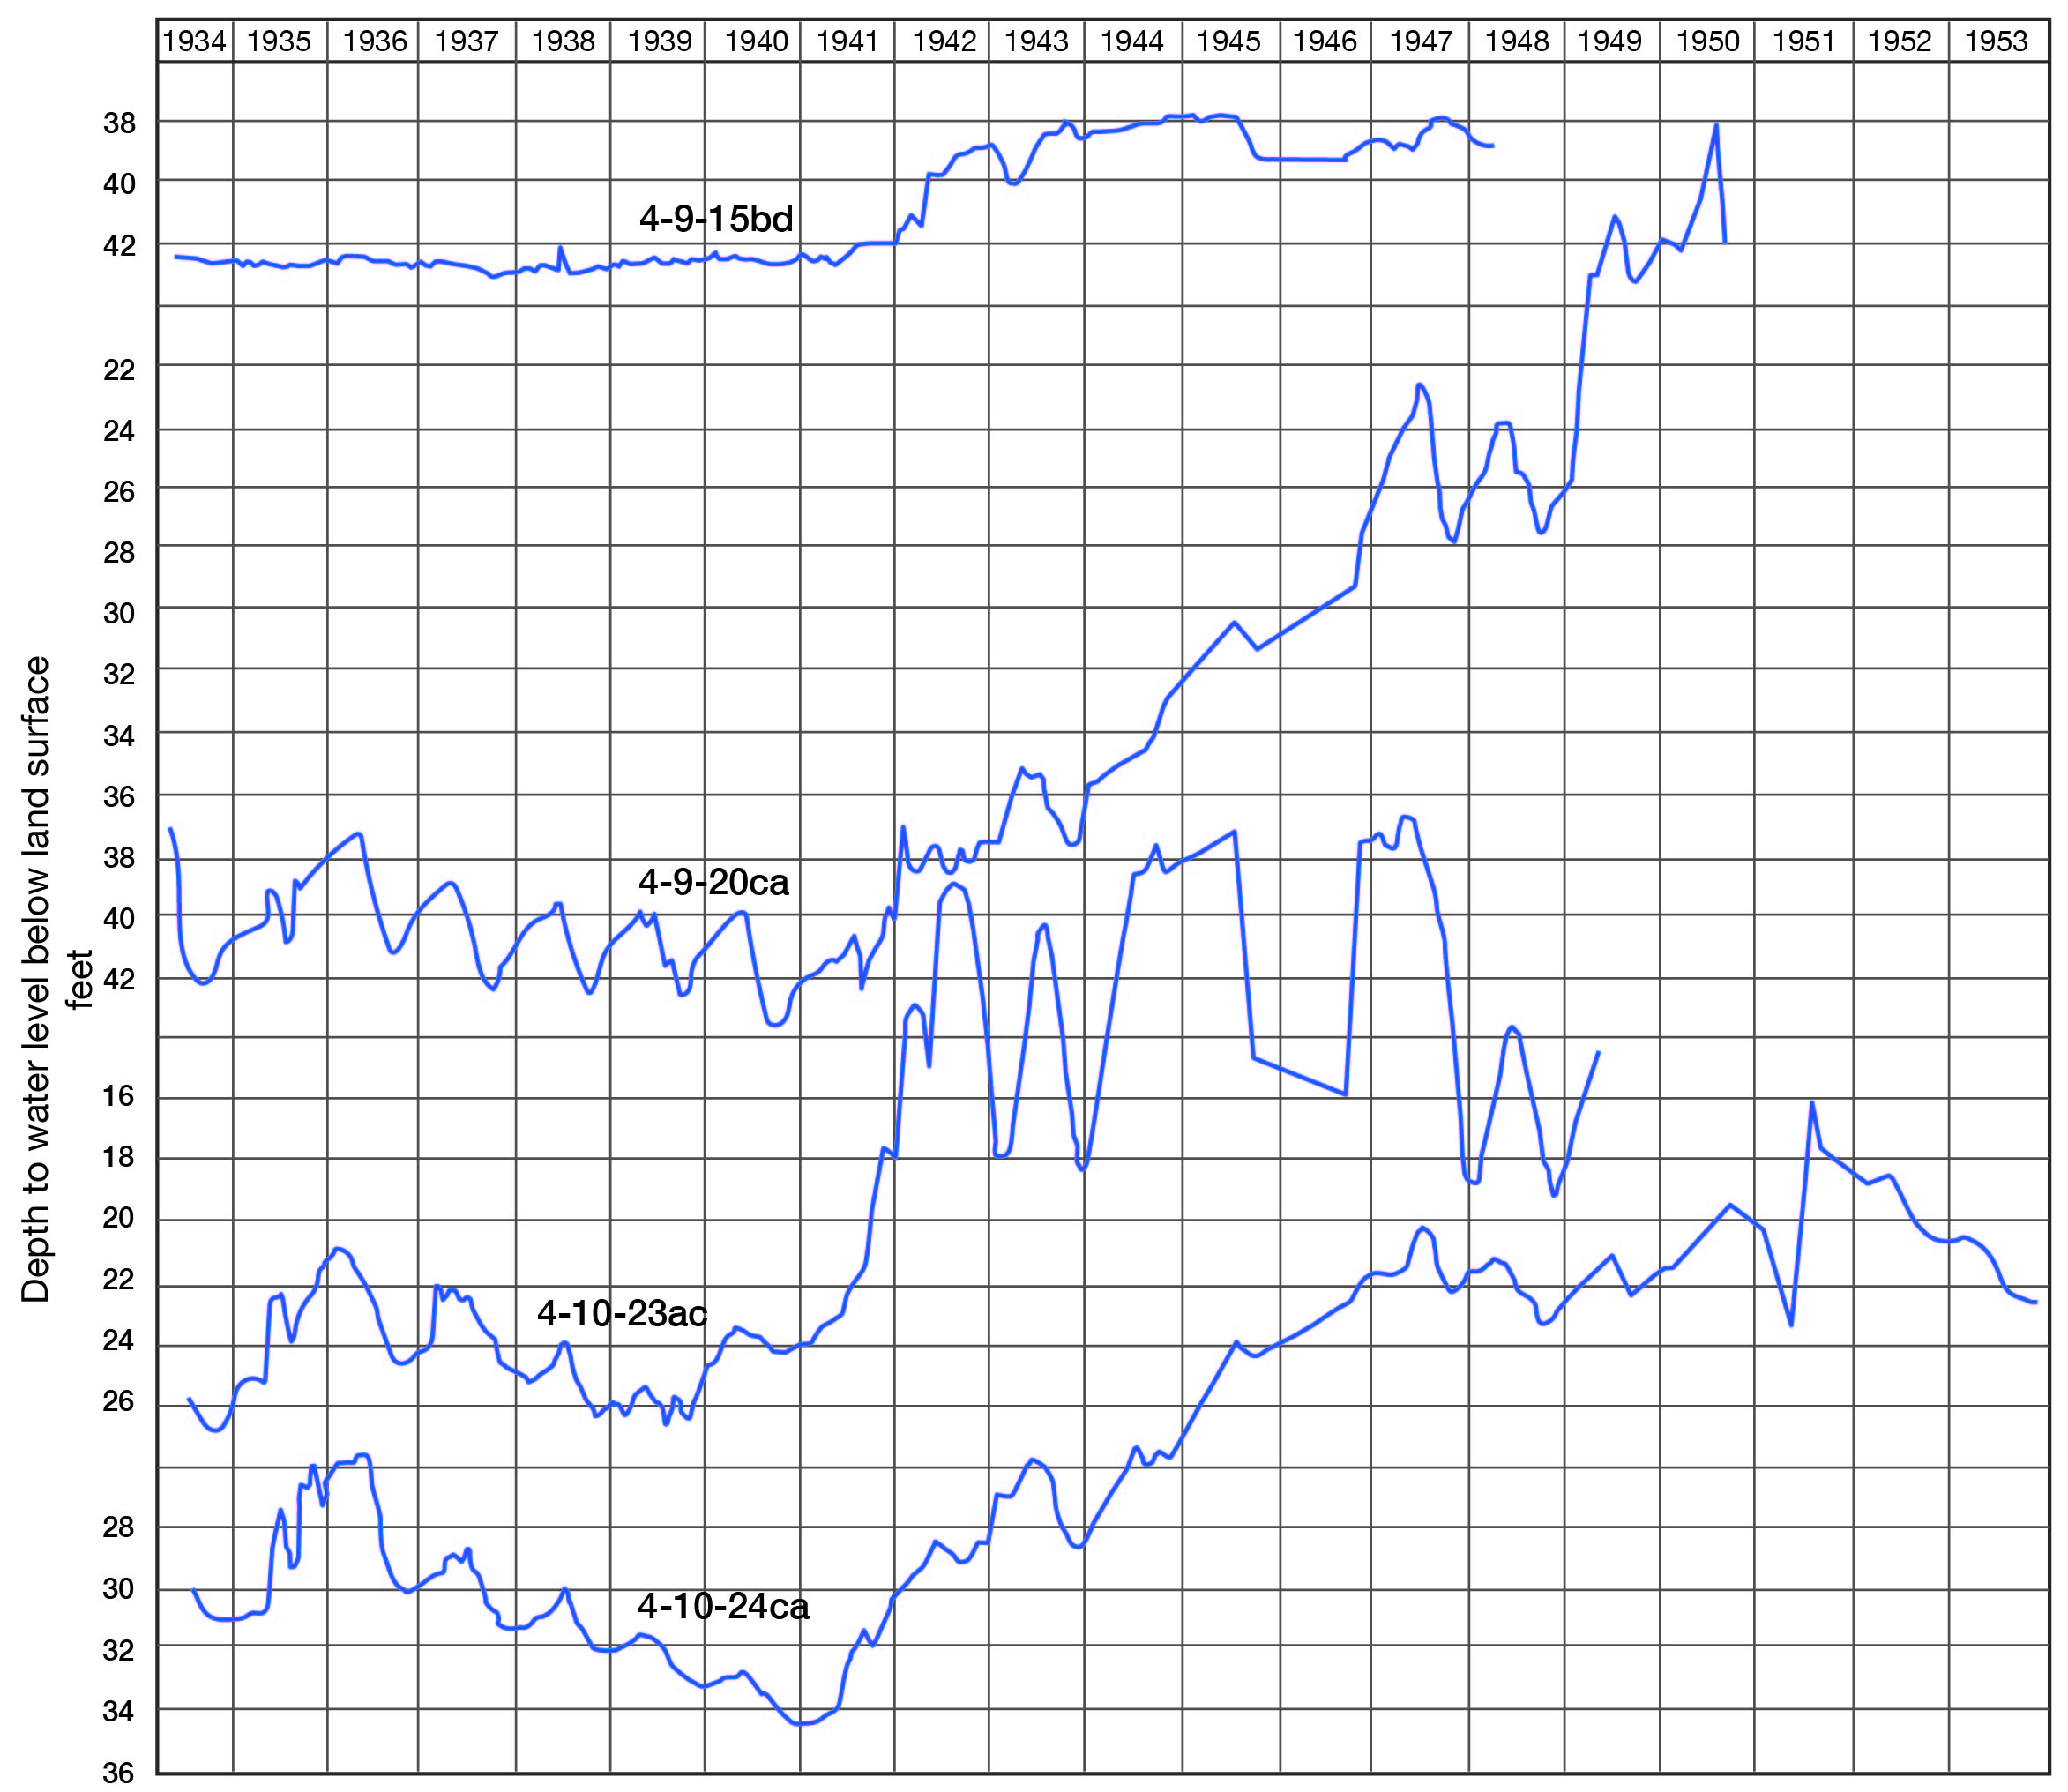
Figure 13--Hydographs showing fluctuations of the water levels in four observation wells in Jewell County and the cumulative departure from normal precipitation at Burr Oak.
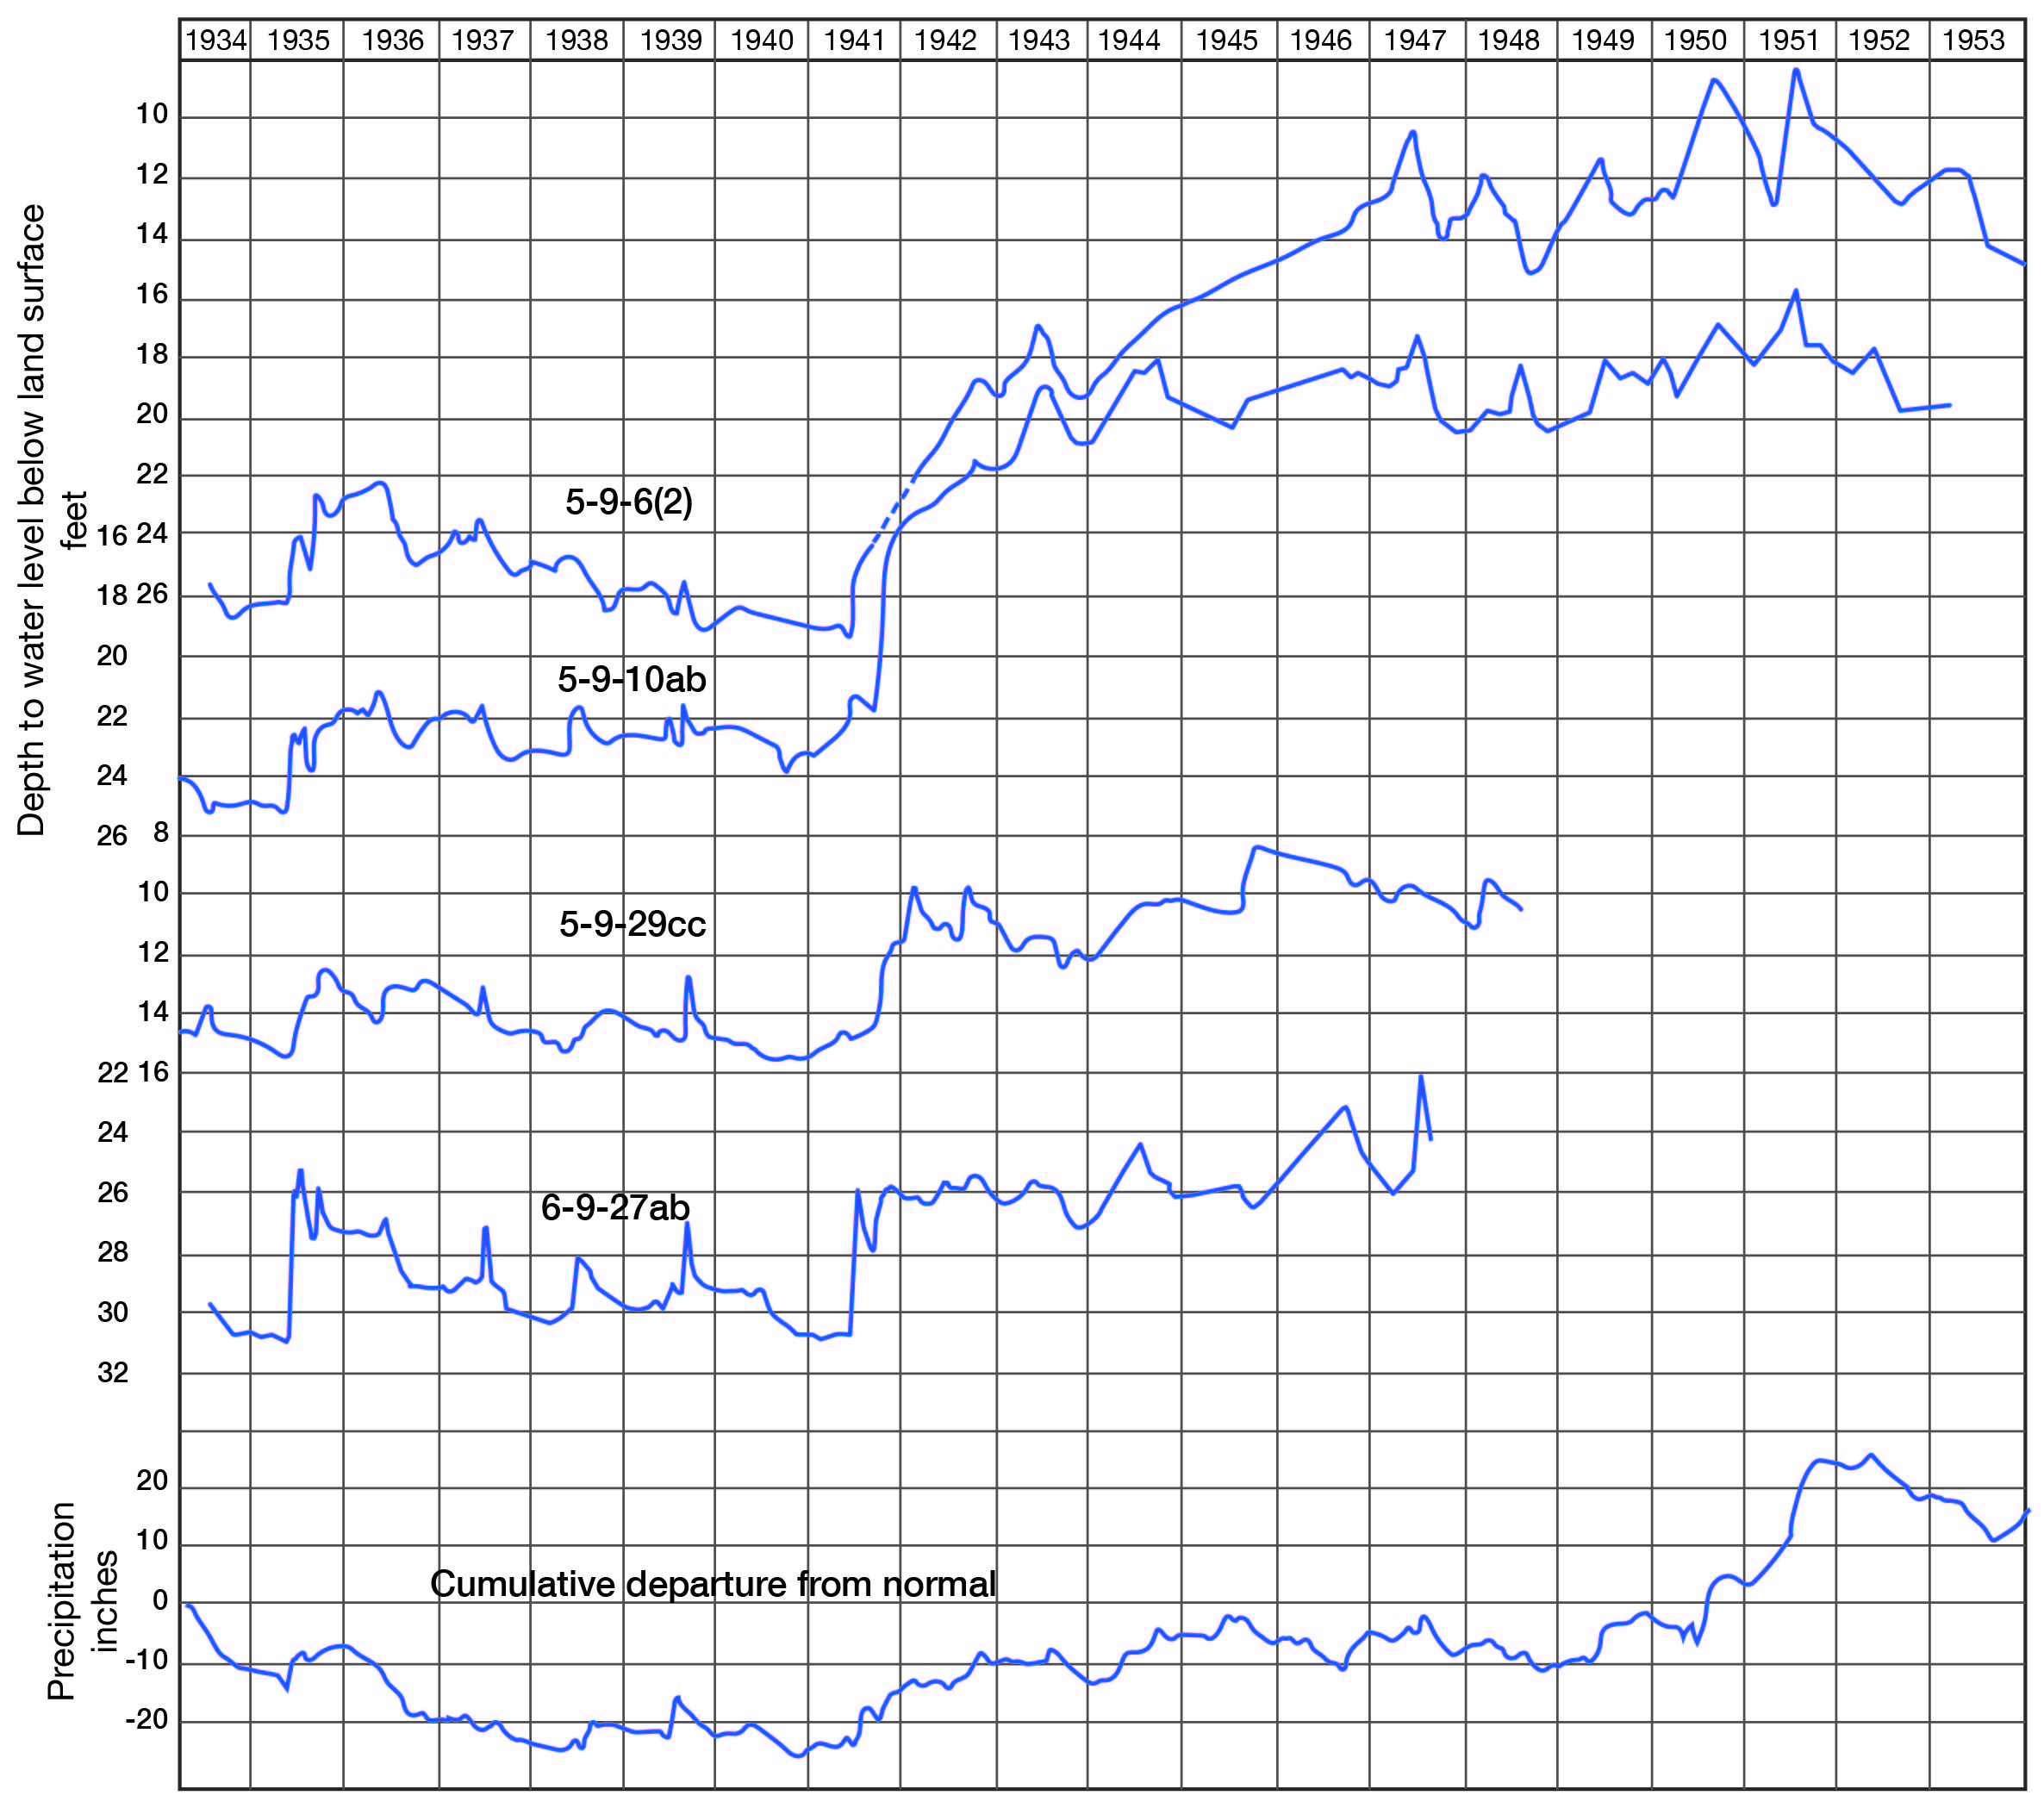
During years of normal precipitation, the water levels in some wells have only minor fluctuations. During a period of abnormally high precipitation, the amount of infiltration exceeds the amount of transpiration, all soil-moisture deficiency is satisfied, and the excess water percolates down to the water table and causes a large rise of the water level. The water level in well 4-9-15bd generally has only minor fluctuations. From 1934 to 1941, the fluctuations were generally less than half a foot a year, but in 1941 and 1942, the water level rose nearly 4 feet. In 1935 and 1942, conditions were favorable for large rises of the water level in well 3-10-29cd. The rise in 1942 was more than 10 feet. At other times during the period of record, the annual rise of water level in this well was less than a foot.
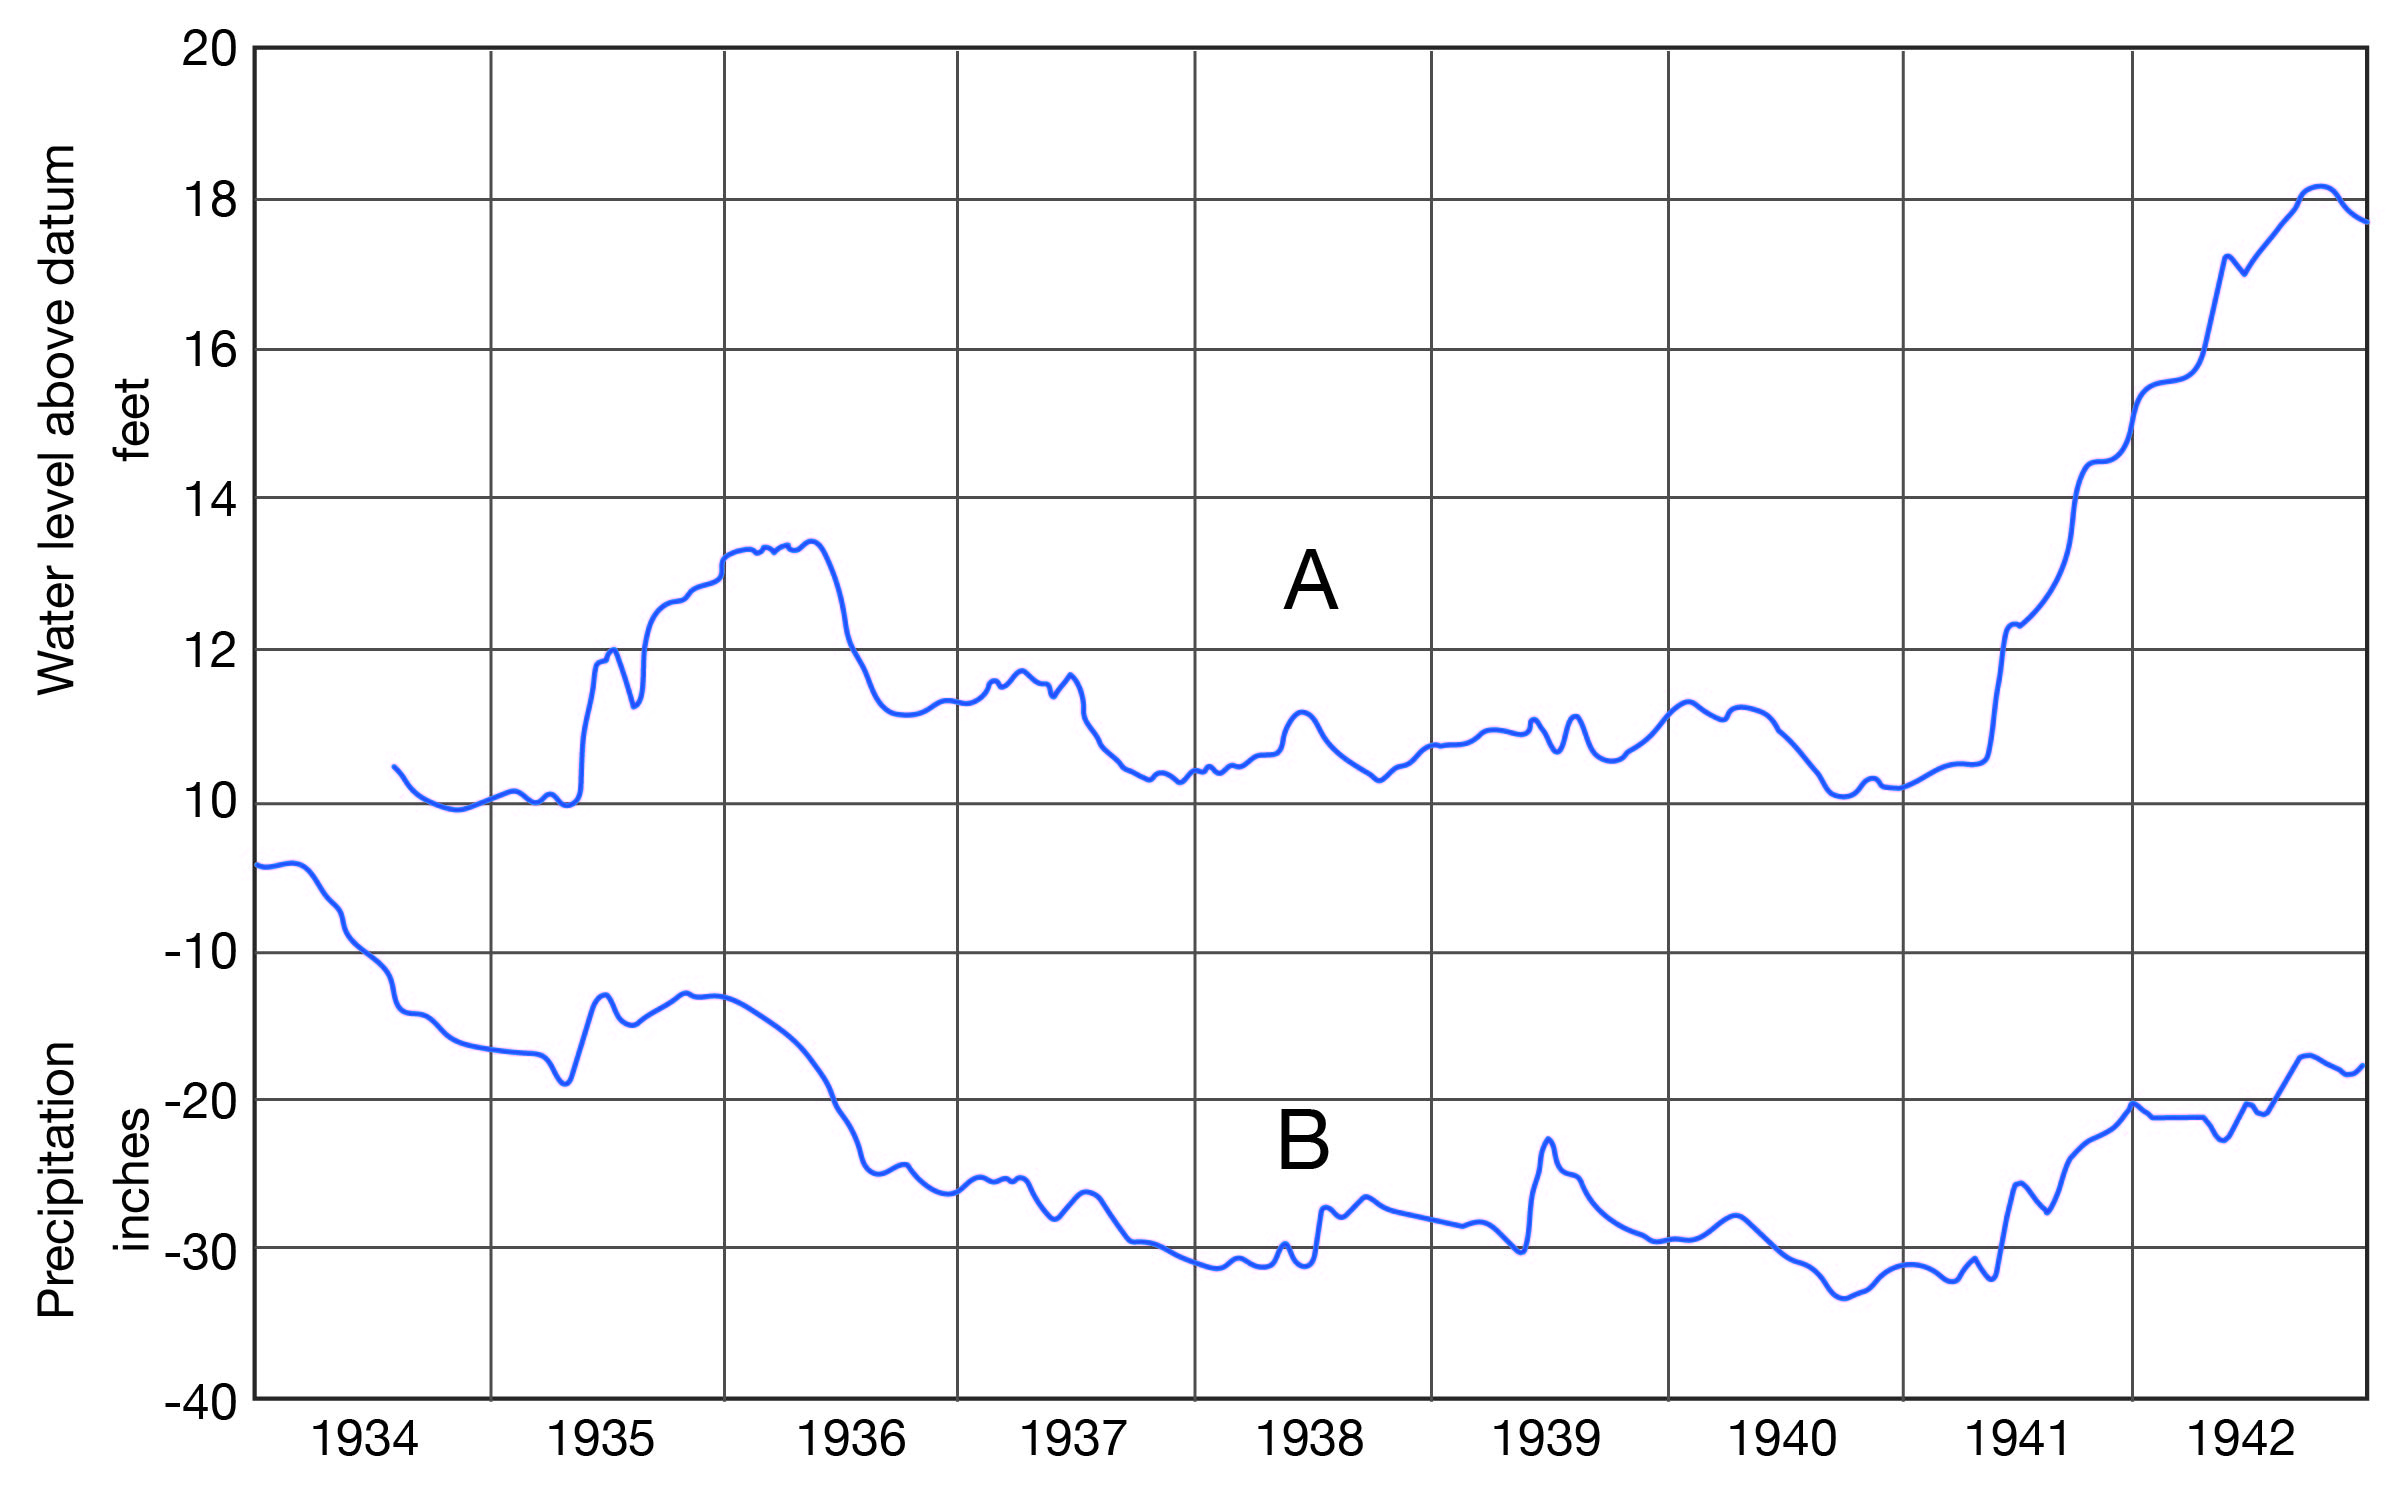
The general trend of the water levels resulting from a balance between recharge from precipitation and discharge is shown in Figure 14. During 1934 and the first part of 1935, the precipitation was below normal. During this time, the water levels reached their lowest average level for the period of record. High precipitation in 1935 and early 1936 caused the water levels to rise an average of 3.5 feet by May 15, 1936. Low precipitation during the latter part of 1936 resulted in a decline of 2.4 feet by October 23. The precipitation in 1937 was 4.60 inches below normal and, as a result, the water levels had an average net decline of 0.98 foot; however, in 1938, when the precipitation was 2.23 inches above normal, the water levels had an average net rise of 0.27 foot. The amounts of precipitation in 1939 and 1940 were 1.08 and 1.96 inches below normal, respectively. The water levels rose 0.14 foot in 1939, then declined 0.78 foot in 1940. The precipitation was 10.63 inches above normal in 1941 and 3.13 inches above normal in 1942. In response to this high precipitation, the water levels rose 4.50 feet in 1941 and 3.26 feet in 1942. The high stage reached by the water levels in, 1942 was 10 feet higher than the low stage in 1934.
Figure 14--Hydrograph of average water level in 12 observation wells in Jewell County and the cumulative departure from normal precipitation at Burr Oak, 1934-42.
Fluctuations caused by transpiration
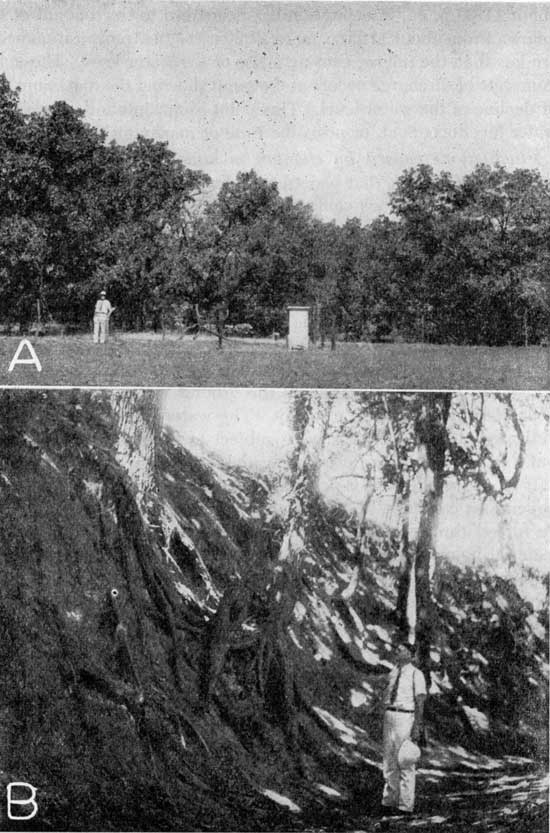
Water-stage recorders were operated intermittently on some of the wells and continuously on others in the Limestone Creek basin during the period from March 1934 to December 1938. Daily fluctuations of the water level caused by transpiration in many wells were observed during the growing season. The water levels rose during the night and declined during the day. Figure 15 is a hydrograph of well 4-9-28ca for the period July 26-29, 1937, showing the fluctuations of the water level caused by transpiration of oak trees. This well is about 50 feet from Elm Creek in the NE SW sec. 28, T. 4 S., R. 9 W. The shelter covering the well, near-by trees that are causing the fluctuations, and a picture taken in the dry bed of Elm Creek just north of the well are shown in Plate 6. The observation well is an abandoned stock well, 10 inches in diameter and 52.6 feet deep. The water level was approximately 42 feet below the land surface in July 1937.
Figure 15--Hydrograph of well 4-9-28ca showing fluctuations of the water level caused by transpiration.
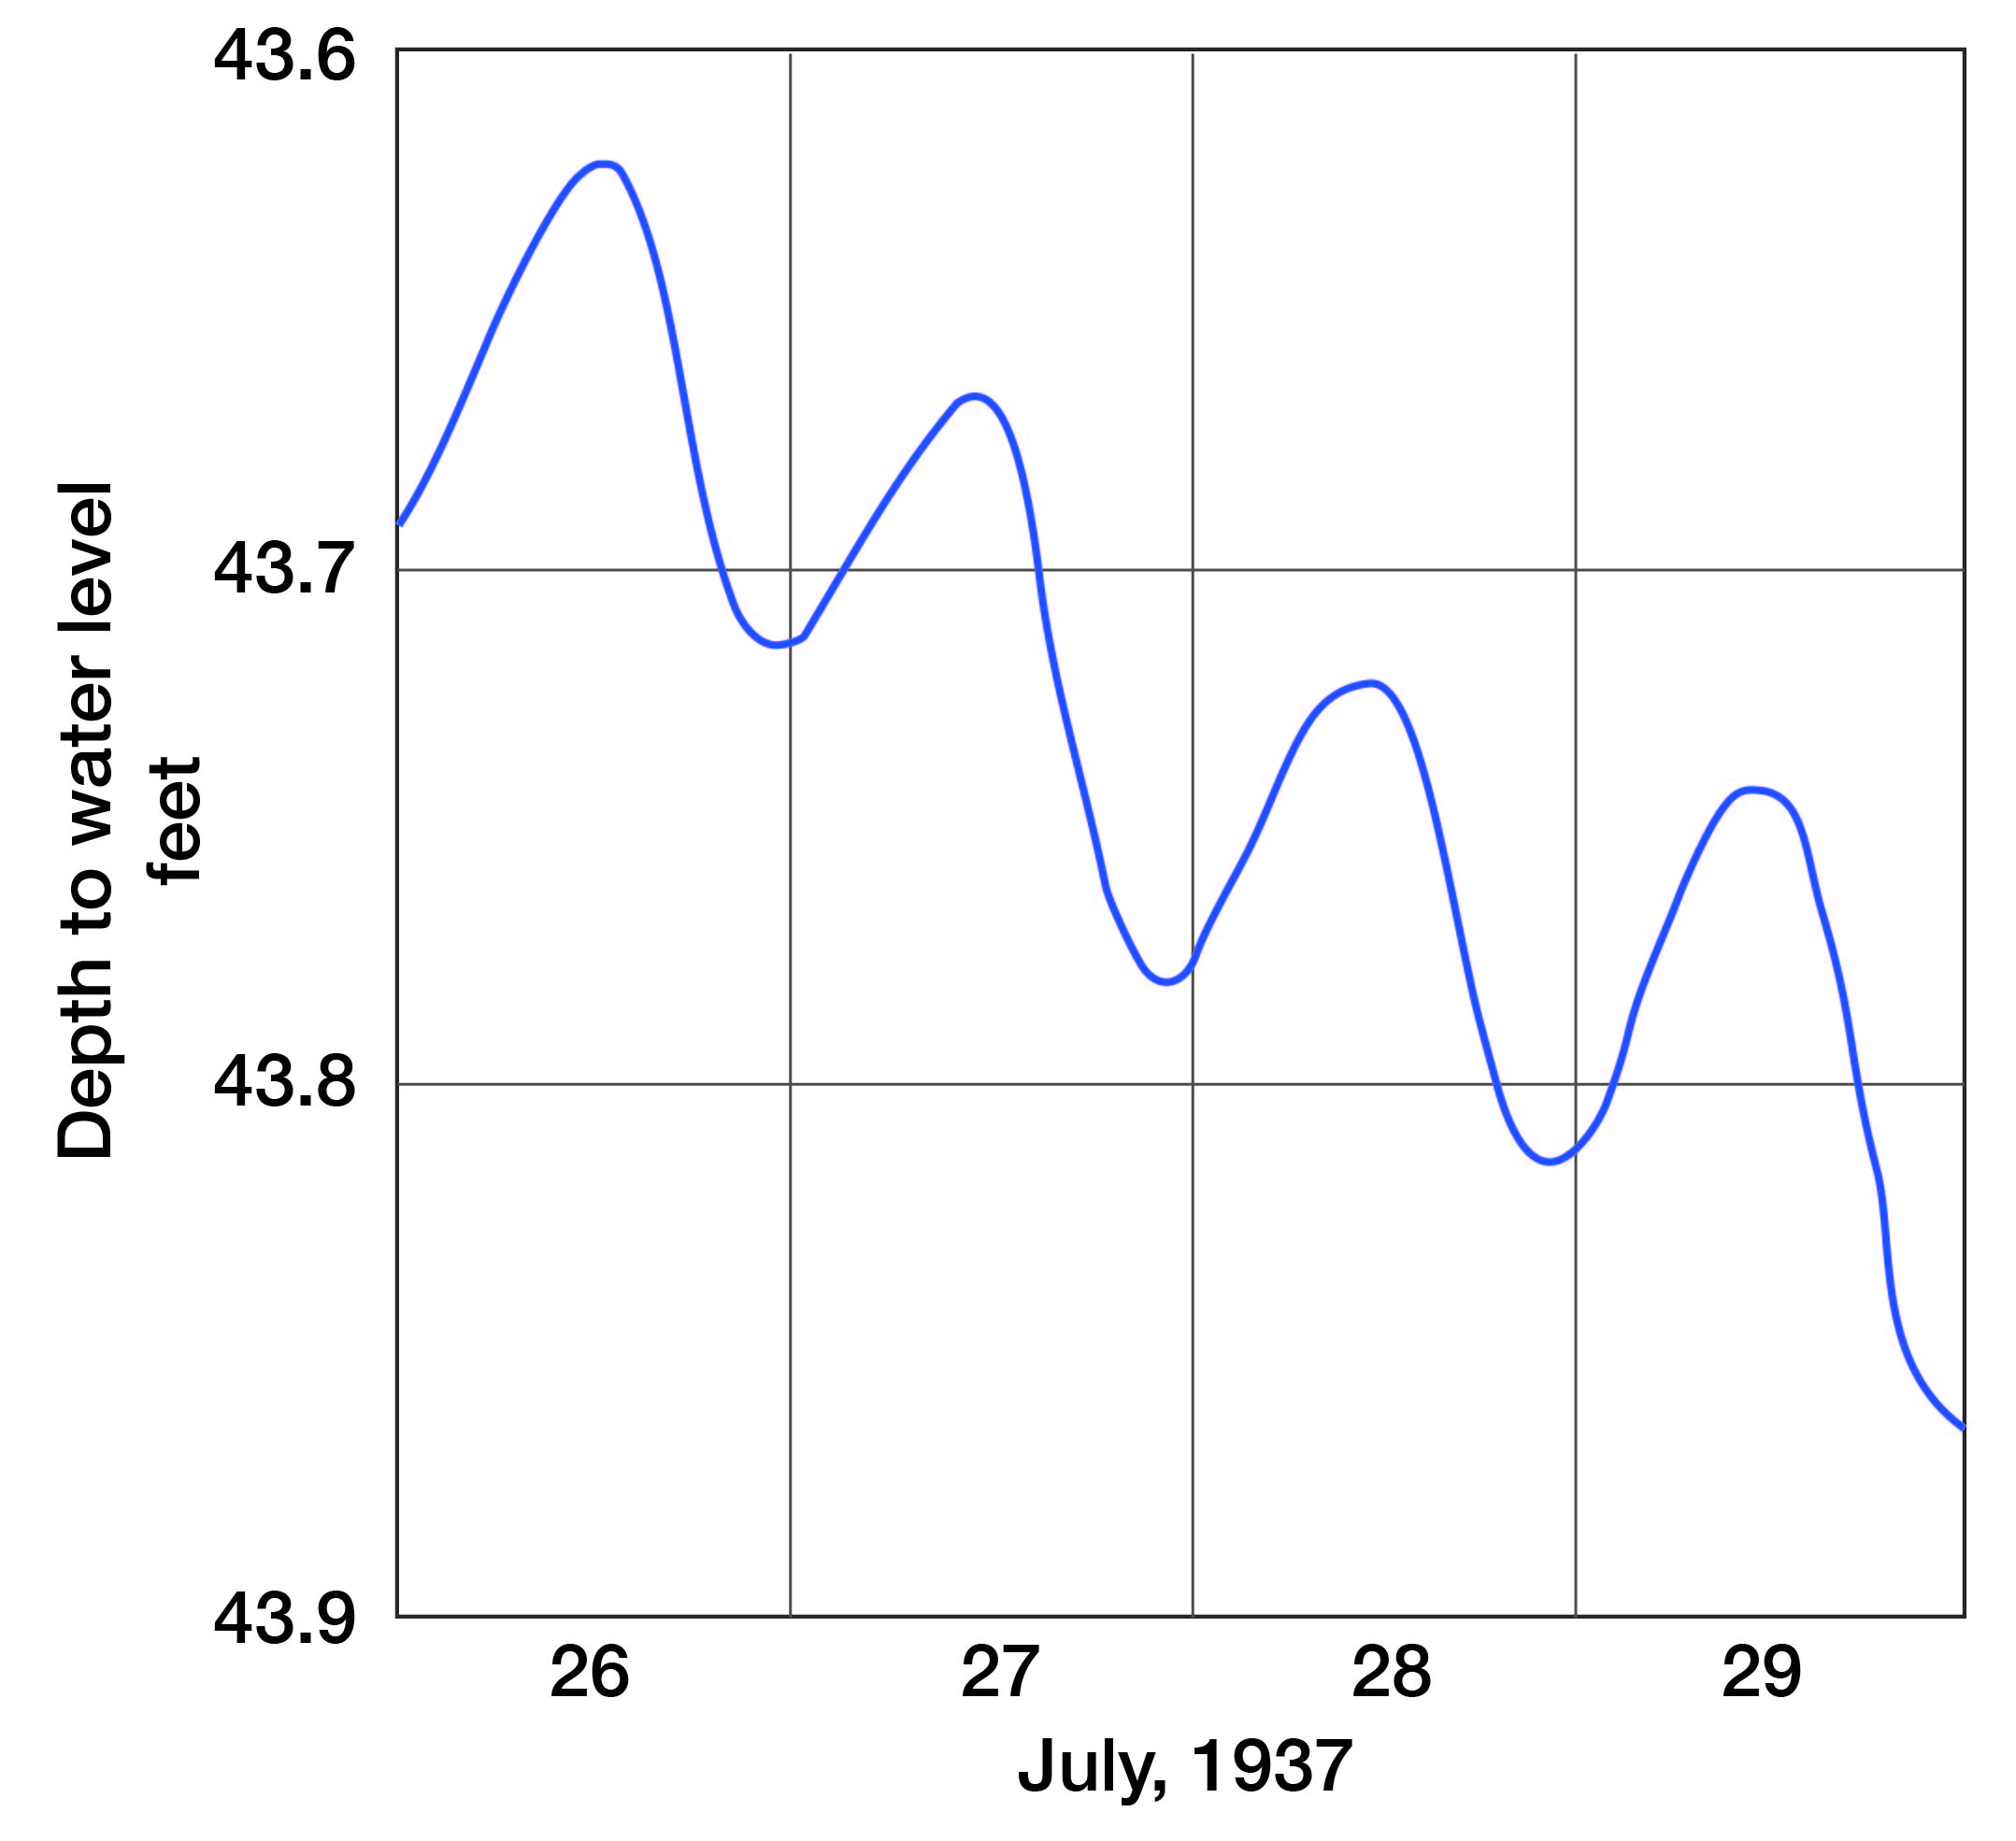
Plate 6--A, Observation well in the NE SW sec. 28, T. 4 S., R. 9 W. B, Limestone Creek just north of observation well. Water level, about 40 feet below land surface, affected by transpiration. Hydrograph shown in Figure 15. Photographs by S. W. Lohman.
The hydrograph (Fig. 15) represents a cumulative curve of the rates of ground-water inflow (plus) and the transpiration use (minus). The ground water to supply the needs of the vegetation can be drawn from the inflow to the area or from ground-water storage, or from both.
An analysis of the hydrograph shows that at about 10:00 a.m. the water level remains unchanged for a short period. During this period, the ground-water inflow is sufficient to supply all the transpiration needs. From 10:00 a.m. to about 11:00 p.m. the use of water by transpiration exceeds the ground-water inflow and water is drawn from storage resulting in a decline of the water level. By about 11:00 p.m., transpiration has decreased to the amount of the inflow. From about 11:00 p.m. to 10:00 a.m., the transpiration needs are less than the inflow, causing a rise of the water level. The maximum rate of discharge occurs at the point showing the maximum rate of decline of the water level. This point of maximum decline of the water level occurs at, or near, the time of maximum temperature.
Fluctuations caused by changes in atmospheric pressure
The water levels in wells that penetrate water-bearing formations having a relatively impervious confining bed above the zone of saturation may fluctuate in response to changes in atmospheric pressure. The pressure on the water surface in a well increases with an increase of atmospheric pressure. If this increase in pressure is not transmitted uniformly to the entire ground-water body but acts only on the exposed water surface in the well, the water level in the well fluctuates according to the changes in pressure. However, if the pressure is transmitted freely through the pore spaces of the soil above the zone of saturation to the ground water, the water level does not fluctuate barometrically. The water-stage recorder charts indicated that many wells were subject to barometric fluctuations, but a barograph record was not available for comparison.
If the casing in wells is perforated between the water table and an impervious confining bed lying above an unsaturated zone, air may be forced through the well into the interstices of the unsaturated material below the impermeable layer when the atmospheric pressure increases, and out through the well when the atmospheric pressure decreases (Wenzel and Waite, 1941, p. 44). This may cause an appreciable amount of air to move into or out of the well at its top, which in some wells is of sufficient velocity to cause a whistling or roaring sound. The water level in such wells fluctuates only slightly, if at all, in response to changes in atmospheric pressure. Locally, these wells are known as "blowing" and "sucking" wells. This phenomenon was observed in well 1-6-20da in the NE SE sec. 20, T. 1 S., R. 6 W.
Prev Page--Geology || Next Page--Recharge, Discharge, and Permeability
Kansas Geological Survey, Geology
Placed on web Nov. 21, 2008; originally published Oct. 1955.
Comments to webadmin@kgs.ku.edu
The URL for this page is http://www.kgs.ku.edu/General/Geology/Jewell/05_gw.html