![]()
Back to Fluctuations of Water Table...
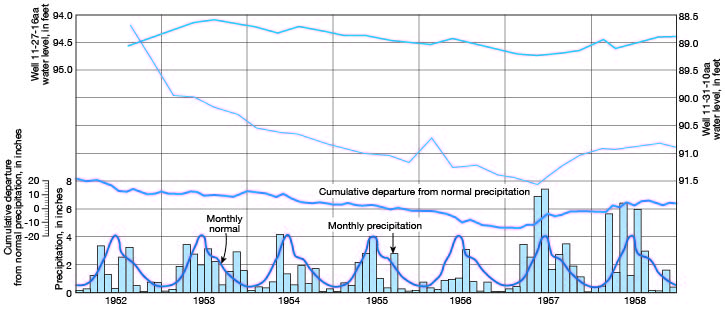
Figure 9
Figure 9--Hydrographs showing fluctuations of water levels in two wells in Ogallala Formation, and graphs showing monthly precipitation, normal precipitation, and cumulative departure from normal precipitation in Gove County.
Back to Fluctuations of Water Table...
Kansas Geological Survey, Geology
Placed on web Sept. 30, 2008; originally published June 1960.
Comments to webadmin@kgs.ku.edu
The URL for this page is http://www.kgs.ku.edu/General/Geology/Gove/fig9.html