![]()
Prev Page--Ground-water Principles, Recharge, Discharge || Next Page--Formations
Ground Water, continued
Utilization
Data on 242 wells in Gove County were obtained during the course of this investigation. Only part of the domestic and stock wells were visited but records were made for all municipal and irrigation wells known to exist in the county at the time of this investigation in the summer of 1956. Information regarding these wells is listed in Table 11. The principal uses of ground water in the county are listed below.
Domestic and Stock Supplies
One of the chief uses of ground water in Gove County is for domestic and stock purposes, for which a total of about 800 acre-feet of ground water is pumped annually. Nearly all domestic and stock supplies in the rural part of Gove County are obtained from wells, although in southern Gove County where in many places ground water is difficult to obtain, ponds made by the construction of dams across hillside watercourses provide water for some stock supplies. Most domestic and stock wells in the county are drilled wells in which standard-size galvanized casing has been set and are equipped with displacement-type pumps in which the cylinder is below the water level. Most pumps are operated by windmills; others are operated by electric motors, by gasoline engines, or by hand.
Municipal Supplies
Brief descriptions of cities in Gove County and their water supplies are given below; details of well construction are given in the table of wells and logs at the end of the report. Analyses of water from municipal wells are given in Table 7. Privately owned wells, most of which have individual pressure systems, are used for businesses, homes, and grade and high schools in Park, which has no municipal water supply.
Quinter--Quinter (population about 730) obtains its water supply from eight drilled wells deriving water from the Ogallala Formation. Most of the wells are southwest of the city, where the saturated thickness of the Ogallala Formation is greater (Fig. 18). Pertinent remarks regarding individual wells and details of well construction are given in Table 11. The wells are equipped with electrically driven turbine pumps. Water is pumped directly into the mains, the excess going into an elevated 50,000-gallon tank. An average daily use of about 300,000 gallons of water was reported by the city engineer.
Grainfield--Grainfield (population about 370) obtains its water supply from two drilled wells deriving water from the Ogallala Formation. The wells have 12-inch steel casings and are equipped with electrically driven turbine pumps. Water is pumped directly into the mains, the excess going into an elevated 50,000-gallon tank. An average daily use of 75,000 gallons of water was reported by the city engineer.
Gove--Gove (population about 200) obtains its water supply from a drilled well in Hackberry Creek alluvium at the south edge of town. The well has a 16-inch steel casing and is equipped with an electrically driven turbine pump, which pumps water into a 750-gallon pressure tank from which the water flows into the mains. An average daily use of 20,000 gallons of water was reported by the city engineer.
Grinnell--Grinnell (population about 390) obtains its water supply from two drilled wells deriving water from the Ogallala Formation. The wells are at the north edge of town in the SW SW sec. 36, T. 10 S., R. 30 W., in Sheridan County. Electrically driven deep-well turbines pump water directly into the mains, the excess going into an elevated 50,000-gallon tank. An average daily use of 60,000 gallons of water was reported by the city engineer.
Irrigation Supplies
There were 43 irrigation plants pumping ground water in Gove County in the summer of 1956. Most were single irrigation wells but a few plants in the valley of Hackberry Creek were pumping from batteries of two to ten wells.
Nearly half of the irrigation plants in Gove County are in Hackberry Creek valley. Pumping rates of these plants average about 325 gpm each. An estimated 2,000 acre-feet of ground water is pumped annually from this valley, which is relatively narrow. The alluvial fill is about one-third mile wide and contains 50 to 60 feet of alluvial deposits in the deepest part. Water-table contours on Plate 1 show that ground water is draining from the Ogallala Formation into the valley, especially in the western part of the county.
Although only seven irrigation wells in Gove County were obtaining ground water from the Ogallala Formation at the time of this investigation, further development of irrigation in the Ogallala is anticipated. The volume of ground water in storage in the Ogallala Formation in the northern two-fifths of the county was estimated by use of a saturated-thickness map prepared by superimposing a contour map of the water table upon a contour map of the bedrock surface and drawing contours through points of equal saturated thickness. On the basis of an effective porosity of 15 per cent for the saturated deposits, approximately 1.2 million acre-feet of ground water would be in storage in this part of Gove County. Of this volume only a small part could be withdrawn economically by wells, however. Because saturated thickness in the Ogallala is not great in much of this area and because transmissibility is only moderate, ground-water yields can not be expected to exceed 500 gpm and in many places yields will be much less. In addition, depth to water in the Ogallala is greater than in the valley alluvium, hence pumping costs are greater.
Irrigation wells in the Smoky Hill valley are considerably larger than those in other parts of Gove County, yielding as much as 2,000 gpm and averaging about 800 gpm. The relatively small amount of tillable land in the valley has restricted development of irrigation in this part of Gove County, however.
Quality of Ground Water
The chemical character of ground water in Gove County is indicated in Table 6 by analyses of water from the principal aquifers. Also included in the table is an analysis of water from Smoky Hill River. Because most of the samples from municipal supplies are composite samples of water from more than one well, analyses of municipal supplies are given in a separate table (Table 7). The analyses of water samples were made by H. A. Stoltenberg, Chemist, in the Sanitary Engineering Laboratory of the Kansas State Board of Health. The analyses show only the dissolved mineral contents and do not indicate the sanitary conditions of the water. The concentration of mineral constituents is given in parts per million in Table 6 and 7, and in equivalents per million in Figure 13. To convert parts per million to equivalents per million, the valence of each mineral constituent is divided by its atomic weight; then this factor (listed in Table 8) is multiplied by the parts per million for each mineral constituent. A summary of the chemical character of samples of water from wells in Gove County is given in Table 9.
Table 6--Analyses of water from typical wells in Gove County, Kansas Analyzed by H. A. Stoltenberg. Dissolved constituents given in parts per million. One part per million is equivalent to one pound of substance per million pounds of water or 8.33 pounds per million gallons of water.
| Well Number | Depth, feet |
Geologic source | Date of collection |
Temp. (°F) |
Dissolved solids |
Silica (SiO2) |
Iron (Fe) |
Calcium (Ca) |
Magnesium (Mg) |
Sodium and Potassium (Na + K) |
Bicarbonate (HCO3) |
Sulfate (SO4) |
Chloride (Cl) |
Fluoride (F) |
Nitrate (NO3) |
Hardness as CaCO3 | ||
|---|---|---|---|---|---|---|---|---|---|---|---|---|---|---|---|---|---|---|
| Total | Carbonate | Non- carbonate |
||||||||||||||||
| 11-26-12cc | 75 | Ogallala Formation | 3-19-1956 | 57 | 306 | 34 | 0.25 | 65 | 16 | 17 | 254 | 26 | 16 | 0.7 | 6.2 | 228 | 208 | 20 |
| 11-26-33bb | 73.4 | Ogallala Formation | 7-21-1953 | 59 | 319 | 25 | .36 | 72 | 16 | 17 | 270 | 18 | 17 | .6 | 20 | 246 | 222 | 24 |
| 11-27-7ca | 108.1 | Ogallala Formation | 7-21-1953 | 65 | 314 | 28 | .05 | 65 | 18 | 17 | 249 | 31 | 19 | .6 | 12 | 236 | 204 | 32 |
| 11-28-29da | 94 | Ogallala Formation | 7-21-1953 | 65 | 285 | 23 | .37 | 60 | 16 | 19 | 257 | 15 | 15 | .7 | 9.3 | 216 | 210 | 6 |
| 11-29-11dd | 104.9 | Ogallala Formation | 7-21 53 | 60 | 311 | 27 | .29 | 58 | 18 | 24 | 239 | 32 | 20 | 1.0 | 13 | 218 | 196 | 22 |
| 11-30-7cb | 100 | Ogallala Formation | 3-19-1956 | 57 | 301 | 30 | 12 | 44 | 21 | 30 | 244 | 28 | 14 | 1.0 | 13 | 196 | 196 | 0 |
| 11-30-27dc1 | 156 | Ogallala Formation | 10-1-1956 | 283 | 17 | .07 | 50 | 18 | 28 | 249 | 23 | 15 | 1.1 | 8.4 | 199 | 199 | 0 | |
| 11-30-28da | 124.3 | Ogallala Formation | 3-18-1956 | 58 | 302 | 33 | 1.1 | 46 | 21 | 28 | 249 | 28 | 14 | 1.1 | 8.4 | 202 | 202 | 0 |
| 11-31-27ad | 69.7 | Ogallala Formation | 7-21-1953 | 58 | 375 | 24 | 4.0 | 70 | 21 | 36 | 317 | 36 | 25 | .8 | 5.8 | 261 | 260 | 1.0 |
| 12-26-10cc | 48 | Alluvium | 7-21-1953 | 55 | 426 | 33 | .13 | 101 | 19 | 24 | 366 | 39 | 26 | .5 | 4.0 | 330 | 300 | 30 |
| 12-26-11bb1 | 92 | Ogallala Formation | 10-4-1956 | 286 | 38 | .09 | 58 | 15 | 18 | 251 | 19 | 11 | .6 | 3.0 | 206 | 206 | 0 | |
| 12-26-33bb | 74.0 | Ogallala Formation | 7-21-1953 | 59 | 305 | 31 | .08 | 70 | 15 | 14 | 244 | 22 | 25 | .4 | 8.0 | 236 | 200 | 36 |
| 12-27-7bb | 105 | Ogallala Formation | 3-18-1956 | 58 | 246 | 36 | .87 | 55 | 12 | 10 | 227 | 7.4 | 6.0 | .5 | 7.1 | 186 | 186 | 0 |
| 12-27-10da | 74.0 | Ogallala Formation | 3-19-1956 | 57 | 332 | 42 | 5.0 | 70 | 16 | 18 | 256 | 37 | 19 | .8 | 2.8 | 240 | 210 | 30 |
| 12-2S-34dd | 43.0 | Terrace deposits | 3-19-1956 | 55 | 939 | 34 | .09 | 225 | 23 | 39 | 293 | 397 | 40 | .7 | 36 | 656 | 240 | 416 |
| 12-29-24da | 60.0 | Ogallala Formation | 3-19-1956 | 56 | 240 | 18 | 18 | 35 | 16 | 28 | 189 | 24 | 18 | .9 | 7.1 | 154 | 154 | 0 |
| 12-30-1bb | 103.5 | Ogallala Formation | 7-21-1953 | 58 | 393 | 29 | .89 | 67 | 26 | 28 | 238 | 54 | 40 | 1.2 | 31 | 274 | 195 | 79 |
| 12-30-14db | 35 | Alluvium | 10-2-1956 | 700 | 44 | 1.1 | 111 | 42 | 66 | 378 | 190 | 59 | 1.0 | 1.1 | 450 | 310 | 140 | |
| 12-30-27dd1 | 39 | Alluvium | 10-2-1956 | 737 | 40 | 1.1 | 137 | 26 | 65 | 294 | 293 | 29 | 1.1 | 1.3 | 449 | 241 | 208 | |
| 12-31-13ab | 84.2 | Ogallala Formation | 3-18-1956 | 56 | 306 | 27 | 2.5 | 49 | 23 | 26 | 259 | 21 | 20 | 1.0 | 11 | 216 | 212 | 4 |
| 13-26-29ab | 50 | Terrace deposits | 7-20-1953 | 70 | 989 | 39 | .16 | 196 | 36 | 72 | 329 | 425 | 56 | .5 | 2.4 | 637 | 270 | 367 |
| 13-27-4ab | 11.9 | Alluvium | 3-19-1956 | 493 | 24 | .12 | 97 | 21 | 40 | 294 | 119 | 20 | .9 | 26 | 328 | 241 | 87 | |
| 13-27-16ca2 | 64 | Alluvium | 10-4-1956 | 527 | 39 | .11 | 119 | 15 | 30 | 271 | 140 | 23 | .5 | 27 | 358 | 222 | 136 | |
| 13-27-27bb | 51.0 | Alluvium | 3-19-1956 | 56 | 428 | 28 | 2.7 | 121 | 13 | 11 | 383 | 26 | 9.0 | .3 | 31 | 356 | 314 | 42 |
| 13-29-4ba | 65 | Alluvium | 10-2-1956 | 752 | 41 | 2.8 | 124 | 36 | 78 | 354 | 228 | 68 | .8 | 1.7 | 458 | 290 | 168 | |
| 13-29-14dd | 79.0 | Ogallala Formation | 3-19-1956 | 57 | 320 | 28 | .32 | 73 | 15 | 16 | 266 | 25 | 14 | .7 | 17 | 244 | 218 | 26 |
| 13-30-2bd | 68 | Ogallala Formation | 3-18-1956 | 57 | 400 | 45 | .22 | 76 | 17 | 31 | 257 | 69 | 23 | .8 | 12 | 260 | 210 | 50 |
| 13-30-8ab2 | 80 | Terrace deposits | 10-2-1956 | 353 | 39 | .08 | 69 | 18 | 24 | 254 | 51 | 22 | .7 | 4.1 | 246 | 208 | 38 | |
| 13-30-35ca | 54.5 | Colluvium | 3-18-1956 | 58 | 2,290 | 16 | 8.4 | 504 | 63 | 115 | 314 | 1,390 | 38 | 2.0 | 5.8 | 1,520 | 260 | 1,260 |
| 13-31-2dd | Terrace deposits | 7-21-1953 | 65 | 968 | 28 | .22 | 227 | 16 | 57 | 261 | 459 | 35 | 1.0 | 17 | 632 | 214 | 418 | |
| 14-26-7cd | 18.0 | Colluvium | 3-19-1956 | 54 | 352 | 20 | .36 | 93 | 9.7 | 17 | 278 | 58 | 7.0 | .7 | 10 | 272 | 228 | 44 |
| 14-26-14dc | 696 | Dakota Formation | 7-20-1953 | 65 | 1,130 | 10 | .20 | 4.5 | 2.2 | 434 | 562 | 176 | 213 | 5.6 | 4.4 | 20 | 20 | 0 |
| 14-26-29cc | 64 | Terrace deposits | 7-20-1953 | 61 | 303 | 31 | 2.5 | 57 | 16 | 27 | 264 | 24 | 16 | 1.0 | .7 | 208 | 208 | 0 |
| 14-26-30dd2 | 64.0 | Terrace deposits | 7-20-1953 | 63 | 422 | 46 | .15 | 80 | 22 | 27 | 288 | 41 | 29 | .8 | 34 | 290 | 236 | 54 |
| 14-26-35dc | 70 | Alluvium | 10-2-1956 | 1,310 | 32 | 6.2 | 242 | 54 | 86 | 220 | 772 | 18 | 1.1 | 1.6 | 826 | 180 | 646 | |
| 14-27-7cc | 47 | Terrace deposits | 3-19-1956 | 56 | 427 | 32 | .76 | 97 | 14 | 26 | 242 | 95 | 35 | .4 | 8.4 | 300 | 198 | 102 |
| 14-27-11dc | 717 | Dakota Formation | 10-1-1956 | 923 | 10 | 1.6 | 2.4 | .5 | 370 | 620 | 86 | 137 | 7.5 | 4.0 | 8.0 | 8.0 | 0 | |
| 14-27-12cd | 340 | Codell Sandstone | 10-1-1956 | 409 | 23 | 2.1 | 99 | 14 | 21 | 288 | 48 | 20 | .5 | 42 | 304 | 236 | 68 | |
| 14-29-26da | 43.5 | Colluvium | 3-17-1956 | 57 | 1,950 | 13 | 15 | 519 | 36 | 24 | 254 | 1,220 | 10 | 1.0 | 7.1 | 1,440 | 210 | 1,230 |
| 14-29-29bb | 17.1 | Colluvium | 3-18-1956 | 56 | 1,430 | 37 | .08 | 286 | 42 | 104 | 292 | 765 | 52 | .6 | 1.2 | 886 | 240 | 646 |
| 14-31-27cc | 47.5 | Colluvium | 3-18-1956 | 57 | 2,870 | 32 | .18 | 599 | 120 | 99 | 298 | 1,830 | 32 | 1.2 | 8.8 | 1,990 | 240 | 1,750 |
| 15-26-32cd | 68.0 | Terrace deposits | 3-19-1956 | 57 | 411 | 31 | .42 | 123 | 10 | 8.0 | 384 | 17 | 9.0 | .3 | 24 | 348 | 315 | 33 |
| 15-26-36ba2 | 400 | Codell Sandstone | 10-4-1956 | 898 | 7.0 | 2.9 | 15 | 8.9 | 316 | 495 | 221 | 81 | 4.0 | 1.3 | 74 | 74 | 0 | |
| 15-28-2bc | 45 | Terrace deposits | 7-20-1953 | 55 | 601 | 22 | .18 | 146 | 25 | 25 | 396 | 129 | 24 | .6 | 34 | 467 | 324 | 143 |
| 15-28-24aa | 98 | Alluvium | 7-20-1953 | 59 | 1,240 | 27 | 2.9 | 239 | 49 | 77 | 205 | 716 | 34 | 1.2 | 1.3 | 798 | 168 | 630 |
| 15-29-11ad | 22.5 | Alluvium | 3-17-1956 | 53 | 2,740 | 31 | .16 | 455 | 140 | 181 | 242 | 1,760 | 47 | 1.0 | 3.5 | 1,710 | 200 | 1,510 |
| 15-29-14da | Smoky Hill River | 3-19-1956 | 52 | 1,150 | 15 | .26 | 237 | 43 | 57 | 188 | 678 | 21 | 1.0 | 1.3 | 768 | 154 | 614 | |
| 15-29-18db | 90 | Alluvium | 10-4-1956 | 7,180 | 27 | 36 | 319 | 614 | 1,030 | 329 | 4,860 | 162 | 2.6 | 3,6 | 3,320 | 270 | 3,050 | |
| 15-30-9cb | 16.3 | Alluvium | 3-18-1956 | 56 | 1,970 | 24 | 5.0 | 338 | 98 | 136 | 302 | 1,190 | 37 | 1.3 | 2.5 | 1,250 | 250 | 1,000 |
Table 7--Analyses of composite samples of water from municipal supplies in Gove County, Kansas Analyzed by H. A. Stoltenberg. Dissolved constituents given in parts per million. One part per million is equivalent to one pound of substance per million pounds of water or 8.33 pounds per million gallons of water.
| Municipal supply |
Geologic source | Date of collection |
Dissolved solids |
Silica (SiO2) |
Iron (Fe) |
Calcium (Ca) |
Magnesium (Mg) |
Sodium and Potassium (Na + K) |
Bicarbonate (HCO3) |
Sulfate (SO4) |
Chloride (Cl) |
Fluoride (F) |
Nitrate (NO3) |
Hardness as CaCO3 | ||
|---|---|---|---|---|---|---|---|---|---|---|---|---|---|---|---|---|
| Total | Carbonate | Non- carbonate |
||||||||||||||
| Quinter | Ogallala Formation | 2-18-1955 | 281 | 30 | .05 | 59 | 14 | 23 | 244 | 28 | 12 | 0.8 | 9.3 | 204 | 200 | 4 |
| Grainfield | Ogallala Formation | 9-12-1955 | 318 | 33 | .11 | 54 | 19 | 25 | 238 | 31 | 18 | 1.1 | 13 | 212 | 195 | 17 |
| Grinnell | Ogallala Formation | 9-12-1955 | 271 | 28 | .12 | 46 | 18 | 22 | 239 | 16 | 12 | 1.0 | 7.5 | 189 | 189 | 0 |
| Gove | Alluvium | 3-14-1955 | 674 | 32 | 5.3 | 120 | 30 | 65 | 361 | 200 | 41 | .6 | 1.5 | 423 | 296 | 127 |
Figure 13--Graphic representation of chemical analyses of samples of water from wells in principal aquifers and from Smoky Hill River.
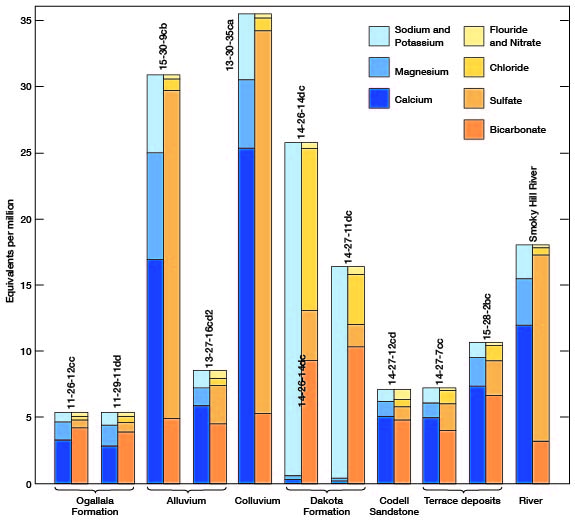
Table 8--Factors for converting parts per million to equivalents per million.
| Mineral constituent | Chemical symbol | Factor |
|---|---|---|
| Calcium | Ca++ | 0.0499 |
| Magnesium | Mg++ | .0822 |
| Sodium | Na+ | .0435 |
| Potassium | K+ | .0256 |
| Carbonate | CO3-- | .0333 |
| Bicarbonate | HCO3- | .0164 |
| Sulfate | SO4-- | .0208 |
| Chloride | Cl- | .0282 |
| Fluoride | F-- | .0526 |
| Nitrate | NO3-- | .0161 |
Table 9--Summary of chemical character of samples of water from wells in Gove County.
| Range in parts per million |
Geologic source and number of samples | |||||
|---|---|---|---|---|---|---|
| Ogallala Formation |
Alluvium | Terrace deposits |
Colluvium | Dakota Formation |
Codell Sandstone |
|
| Dissolved solids | ||||||
| 200-300 | 7 | |||||
| 301-400 | 14 | 2 | 1 | |||
| 401-500 | 3 | 3 | 1 | |||
| 501-1 000 | 5 | 4 | 1 | 1 | ||
| 1,001-5:000 | 4 | 4 | 1 | |||
| More than 5,000 | 1 | |||||
| Hardness | ||||||
| 0-50 | 2 | |||||
| 51-150 | 1 | |||||
| 151-200 | 5 | |||||
| 201-300 | 16 | 4 | 1 | |||
| 301-500 | 8 | 2 | 1 | |||
| 501-1,000 | 2 | 3 | 1 | |||
| More than 1,000 | 3 | 3 | ||||
| Nitrate | ||||||
| 0-5.0 | 2 | 10 | 3 | 1 | 2 | 1 |
| 5.1-10 | 10 | 1 | 4 | |||
| 11-20 | 8 | 1 | ||||
| 21 -40 | 1 | 3 | 4 | |||
| More than 40 | 1 | |||||
| Fluoride | ||||||
| 0-0.5 | 2 | 3 | 3 | 1 | ||
| 0.6-1.0 | 15 | 5 | 6 | 3 | ||
| 1.1-1.5 | 4 | 4 | 1 | |||
| More than 1. 5 | 1 | 1 | 2 | 1 | ||
| Chloride | ||||||
| 0-10 | 1 | 1 | 1 | 2 | ||
| 11-15 | 8 | |||||
| 16-25 | 11 | 3 | 3 | 1 | ||
| 26-35 | 3 | 3 | 1 | |||
| 36-50 | 1 | 3 | 1 | 1 | ||
| More than 50 | 3 | 1 | 1 | 2 | 1 | |
| Iron | ||||||
| 0-0.30 | 10 | 4 | 6 | 2 | 1 | |
| 0.31-1.0 | 5 | 2 | 1 | |||
| 1.1-2.0 | 1 | 2 | 1 | |||
| 2.1-4.0 | 2 | 3 | 1 | 2 | ||
| 4.1-10 | 1 | 3 | 1 | |||
| 11 20 | 2 | 1 | ||||
| More than 20 | 1 | |||||
| Sulfate | ||||||
| 0-25 | 10 | 2 | ||||
| 26-50 | 9 | 2 | 1 | 1 | ||
| 51-100 | 2 | 2 | 1 | 1 | ||
| 101-200 | 4 | 1 | 1 | |||
| 201-300 | 2 | 1 | ||||
| 301-500 | 3 | |||||
| 501-800 | 2 | 1 | ||||
| More than 800 | 3 | 3 | ||||
Chemical Constituents in Relation to Use
The following discussion of the chemical constituents of ground water in relation to use has been adapted in part from publications of the U. S. Geological Survey and the State Geological Survey of Kansas.
Dissolved solids--The residue left after a natural water has evaporated consists mainly of the mineral constituents but may also include some organic material and water of crystallization. Water containing less than 500 ppm (parts per million) of dissolved solids generally is satisfactory for domestic and many industrial purposes. Water containing more than 1,000 ppm of dissolved solids generally has enough of certain constituents to produce a disagreeable taste and to make the water unsuitable in other respects.
The dissolved solids in samples of water from wells in Gove County ranged from 240 to 7,180 ppm; 31 samples contained less than 500 ppm but 10 samples contained more than 1,000 ppm (Table 9). Water from the Ogallala Formation characteristically contains only a small amount of dissolved solids; that from the alluvium characteristically contains appreciably more.
Hardness--Hardness of water is indicated most commonly by the amount of soap needed to produce a lather or suds and by an insoluble scum that forms during washing processes. Calcium and magnesium cause almost all the hardness of water and are the constituents that form most of the scale in steam boilers and other containers in which water is heated or evaporated. The tables of analyses (Tables 6 and 7) show carbonate hardness and noncarbonate hardness in addition to total hardness. Calcium and magnesium bicarbonates cause carbonate hardness, which is sometimes called temporary hardness because the hardness can be virtually removed by boiling the water. Noncarbonate hardness, which is sometimes called permanent hardness because it cannot be removed by boiling, is caused by calcium and magnesium salts of sulfate, chloride, nitrate, and fluoride. Both types of hardness react similarly with soap.
Water that has a hardness of 50 ppm or less is regarded as soft. Water that has a hardness of 50 to 150 ppm is satisfactory for most purposes, but the hardness does increase the amount of soap needed, and treatment of such water by a softening process generally is essential for laundries. Water having a hardness in the upper part of this range will cause scale in steam boilers. Hardness of more than 150 ppm is generally obvious, and water that has a hardness of 200 or 300 ppm is undesirable for household use unless it is treated by a softening process. Where municipal water supplies are softened, the hardness generally is reduced to about 100 ppm.
Total hardness (carbonate and noncarbonate) in samples of water from wells in Gove County ranged from 8 to 3,320 ppm. Only 3 samples had a hardness of less than 150 ppm, and 23 samples had a hardness of more than 300 ppm (Table 9). Water from the Dakota Formation is characteristically soft because of a natural softening process that it undergoes in this formation. Water from the Ogallala Formation is moderately hard, the hardness ranging from 154 to 274 ppm. Water from the alluvium in Gove County is hard, and water from the alluvium of the Smoky Hill valley is very hard.
Nitrate--The nitrate content of different waters differs greatly and in many waters seemingly is not related to the geologic formation. Although some nitrate may be derived from nitrate-bearing rocks and minerals in the water-bearing formation, strong concentrations of nitrate probably are due to other sources. Nitrates are dissolved readily from soils that contain concentrations of nitrate derived from plants, animal waste, or nitrifying action. Because privies, cesspools, and barnyards are sources of organic nitrogen, a large amount of nitrate in well water may indicate the presence of harmful bacteria or prior pollution.
Nitrate in concentrations greater than about 45 ppm is undesirable because of the possible toxic effect that it may have on infants (Metzler and Stoltenberg, 1950). This effect, known as cyanosis, may result when water containing excessive nitrate is used in the preparation of the baby's formula. The Kansas State Board of Health regards 45 ppm as the safe limit of nitrate (as NO3). This is equivalent to 10 ppm of nitrate nitrogen. Water containing as much as 90 ppm of nitrate generally is regarded as very dangerous to infants, and water containing as much as 150 ppm may cause severe cyanosis. Nitrate in drinking water does not cause cyanosis in older children or adults but may be responsible for certain digestive disorders. Nitrate cannot be removed from water by boiling.
The nitrate content of samples of water from wells in Gove County ranged from 0.7 to 42 ppm. All samples contained less than the 45 ppm limit set by the State Board of Health.
Fluoride--Fluoride generally is present only in small concentrations in ground water, but it is important to know the amount of fluoride in water used by children. Too much fluoride in water has been shown to be associated with the dental defect known as mottled enamel, which may appear on the teeth of children who, during the period when permanent teeth are forming, drink water containing too much fluoride (Dean, 1936, p. 1270). Although too much fluoride may have a detrimental effect, later studies have shown that moderate concentrations of fluoride (1.0 to 1.5 ppm) too small to cause objectionable mottling of tooth enamel, help to prevent tooth decay. The United States Public Health Service (1946) has published standards that set or recommend the maximum concentrations of mineral constituents permissible in drinking water that is used on interstate carriers. The maximum amount of fluoride permissible is 1.5 ppm.
The fluoride content of water samples from wells in Gove County ranged from 0.3 to 7.5 ppm. Five samples contained fluoride in excess of 1.5 ppm (Table 9).
Chloride--Chloride is abundant in nature, and many rocks contain small to large amounts of chloride salts that may be dissolved by ground water. Water that contains less than 250 ppm of chloride is satisfactory for most purposes. Water containing more than 250 ppm of chloride generally is objectionable for municipal supplies, and water containing more than 350 ppm can be objectionable for irrigation or industrial use. Water containing as much as 500 ppm of chloride has a salty taste. The upper limit of chloride in water permissible for cattle is believed to be about 4,000 or 5,000 ppm.
Chloride content of water samples from wells in Gove County ranged from 6 to 213 ppm, but only eight samples contained more than 50 ppm (Table 9). Samples from the Dakota Formation contained more chloride than samples from other aquifers, and all but one sample from the Ogallala Formation contained less than 25 ppm.
Iron--Iron and manganese in quantities that exceed a few tenths of a part per million are undesirable, as they stain fabrics and plumbing fixtures and produce an objectionable precipitate in the water. The limit generally specified is 0.3 ppm. Water in the ground may contain considerable iron but upon exposure to air most of the iron is oxidized and precipitated as a reddish sediment, only a few tenths of a part per million of the iron remaining in solution. Iron may be removed from most water by aeration and filtration, but some water requires additional treatment.
The iron content of water samples from wells in Gove County ranged from 0.05 to 36 ppm; 23 samples contained less than 0.3 ppm and only 9 samples contained more than 4 ppm (Table 9).
Sulfate--Sulfate (SO4) in ground water is derived principally from gypsum or anhydrite (calcium sulfate) and from the oxidation of pyrite (iron disulfide). Magnesium sulfate (Epsom salt) and sodium sulfate (Glauber's salt), if present in sufficient quantities, will impart a bitter taste to the water and the water may act as a laxative for people not accustomed to drinking it. More than 250 ppm of sulfate in drinking water generally is undesirable (U. S. Public Health Service, 1946).
Most water samples from wells in Gove County contained only a small amount of sulfate, but some contained nearly 5,000 ppm. Ground water from the Ogallala Formation characteristically contained a very small amount of sulfate, whereas ground water from alluvial deposits in the Smoky Hill valley contained a large amount of sulfate (Table 6).
Sanitary Considerations
The analyses of water in Tables 6 and 7 give only the amount of dissolved mineral matter in the water and do not indicate the sanitary quality of the water, although a large amount of certain mineral constituents such as nitrate or chloride may indicate pollution. Water containing mineral matter that imparts an objectionable taste or odor may be free from harmful bacteria and safe for drinking. Conversely, water clear and pleasant to the taste may contain harmful bacteria. Great care should be taken to protect domestic and public water supplies from pollution. To guard against contamination of a ground-water supply, a well must be properly sealed in order to keep out dust, insects, vermin, debris, and surface water. Wells should not be placed where barnyards, privies, or cesspools are possible sources of pollution.
Suitability of Water for Irrigation
This discussion of the suitability of water for irrigation is based on methods outlined in Agriculture Handbook Number 60, U. S. Department of Agriculture (U. S. Salinity Laboratory Staff, 1954).
In areas of sufficient rainfall and ideal soil conditions, soluble salts originally present in the soil or added to the soil with water are carried downward by percolation and ultimately reach the water table. Soil that was originally nonsaline and nonalkali may become unproductive if excessive soluble salts or exchangeable sodium are allowed to accumulate as a result of improper irrigation and soil management or inadequate drainage. If the amount of water applied to the soil is not in excess of the amount needed by plants, water will not percolate downward below the root zone, and mineral matter will accumulate at that point. Likewise, impermeable soil zones near the surface can retard the downward movement of water and cause waterlogging of the soil and deposition of salts.
The characteristics of an irrigation water that seem to be most important in determining its suitability are the total concentration of soluble salts and the relative activity of sodium ions in exchange reactions. For diagnosis and classification, the total concentration of soluble salts in irrigation water can be expressed in terms of electrical conductivity, which is a measure of the capacity of the inorganic salts in solution to conduct an electrical current. The electrical conductivity can be determined accurately in the laboratory, or an approximation of the electrical conductivity can be obtained by multiplying the total equivalents per million of cations (calcium, magnesium, sodium, and potassium) by 100 or by dividing the total dissolved solids in parts per million by 0.64.
Salt-sensitive crops such as strawberries, green beans, and red clover may be affected adversely by irrigation water having an electrical conductivity exceeding 250 micromhos per centimeter, but waters having electrical-conductivity values below 750 micromhos per centimeter are generally satisfactory for irrigation insofar as salt content is concerned. Waters in the range of 750 to 2,250 micromhos per centimeter are widely used, and satisfactory crop growth is obtained under good management and favorable drainage conditions, but saline conditions will develop if leaching and drainage are inadequate. Use of waters having conductivities of more than 2,250 micromhos per centimeter is the exception, and few instances can be cited where such waters have been used successfully.
The sodium-adsorption ratio may be determined by the formula
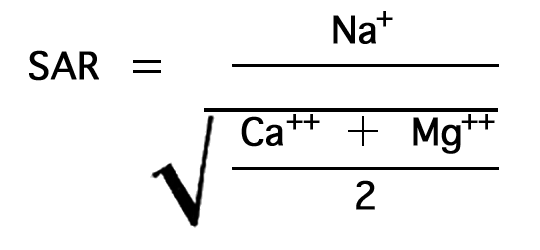
where the ionic concentrations are expressed in equivalents per million. The sodium-adsorption ratio may also be determined by use of the nomogram shown in Figure 14. In using the nomogram to determine the sodium-adsorption ratio of a water, the concentration of sodium expressed in equivalents per million is plotted on the left scale (A), and the concentration of calcium plus magnesium expressed in equivalents per million is plotted on the right scale (B). In this report the concentrations of sodium and potassium are given together as sodium, but the amount of potassium is negligible. The point at which a line connecting these two points intersects the sodium-adsorption-ratio scale (C) determines the sodium-adsorption ratio of the water. Table 10 gives the well numbers and index numbers of samples for which analyses are plotted on Figures 14 and 15, sodium-adsorption ratios, and approximate electrical conductivities.
Figure 14--Nomogram for determining the sodium-adsorption ratio of water.
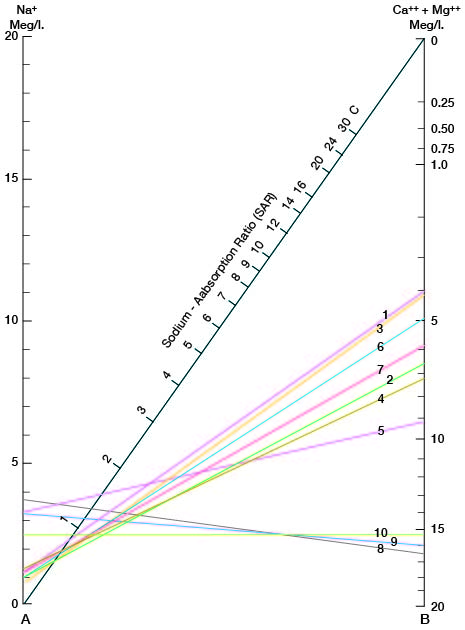
Figure 15--Classification of waters being used for irrigation in Gove County.
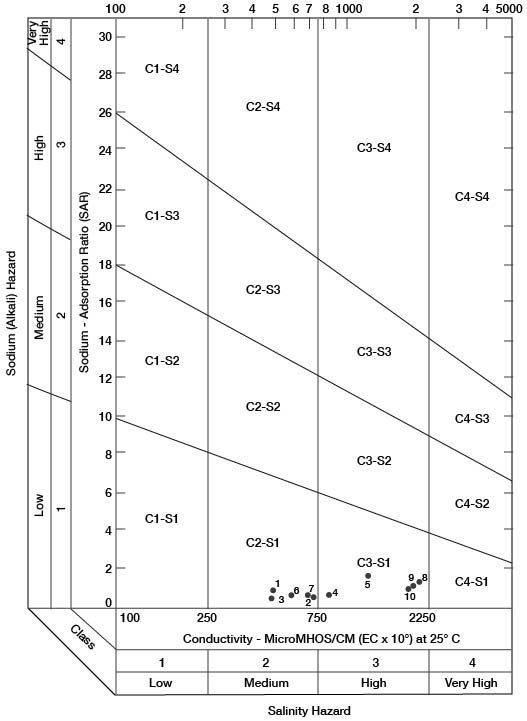
Table 10--Index numbers of samples shown in Figures 14 and 15, and sodium-adsorption ratio (SAR) and conductivity of samples for which analyses are given in Table 6.
| Well number | Number used in Figures 14 and 15 |
SAR | Approximate conductivity micromhos/cm at 25° C |
|---|---|---|---|
| 11-30-27dc1 | 1 | 0.90 | 480 |
| 12-26-10cc | 2 | .60 | 720 |
| 12-26-11bb1 | 3 | 0.60 | 470 |
| 13-27-16ca1 | 4 | 0.70 | 840 |
| 13-29-4ba | 5 | 1.60 | 1,220 |
| 13-30-8ab2 | 6 | 0.70 | 580 |
| 14-26-30dd | 7 | 0.70 | 680 |
| 14-26-35dc | 8 | 1.30 | 2,040 |
| 15-28-24aa | 9 | 1.20 | 1,940 |
| 15-29-14da | 10 | 0.90 | 1,890 |
When the sodium-adsorption ratio and the electrical conductivity of a water are known, the suitability of the water for irrigation can be determined graphically by plotting these values on the diagram shown in Figure 15. Low-sodium water (S1) can be used for irrigation on almost all soils with little danger of the development of harmful levels of exchangeable sodium. Medium-sodium water (S2) may be used safely on coarse-textured or organic soils having good permeability, but S2 water will present an appreciable sodium hazard in certain fine-textured soils, especially under low-leaching conditions. High-sodium water (S3) may produce harmful levels of exchangeable sodium in most soils and will require special soil management such as good drainage, leaching, and addition of organic matter. Very high sodium water (S4) generally is unsatisfactory for irrigation unless special action is taken, such as addition of gypsum to the soil.
Low-salinity water (C1) can be used for irrigation of most crops on most soils with little likelihood that soil salinity will develop. Medium-salinity water (C2) can be used if a moderate amount of leaching occurs. Crops that tolerate moderate amounts of salt such as potatoes, corn, wheat, oats, and alfalfa, can be irrigated with C2 water without special practices. High-salinity water (C3) cannot be used on soils having restricted drainage. Very high salinity water (C4) can be used only on certain crops and then only if special practices are followed.
Ten representative analyses of water samples from irrigation systems were selected for determining the suitability of water in Gove County for irrigation; also included is an analysis of water from Smoky Hill River (Table 10). Electrical-conductivity values ranged from 470 to 2,040. In Figure 15, all the waters were classified as low-sodium water (S1), and as either medium-salinity water (C2) or high-salinity water (C3).
Prev Page--Ground-water Principles, Recharge, Discharge || Next Page--Formations
Kansas Geological Survey, Geology
Placed on web Sept. 30, 2008; originally published June 1960.
Comments to webadmin@kgs.ku.edu
The URL for this page is http://www.kgs.ku.edu/General/Geology/Gove/05_gw2.html