![]()
Prev Page--Ground Water, General || Next Page--Chemical Character
Irrigation in Pawnee Valley
Extent of Irrigation
The precipitation in Pawnee Valley averages about 20 inches a year. Good crops can ordinarily be grown without irrigation but do not yield as well without irrigation as when irrigated. In dry years crops may be almost failures. Although the precipitation for the year may be but a few inches below normal, a drought in July and August may seriously damage a crop which had promise of a satisfactory yield. Irrigation in Pawnee Valley has resulted in increased yields every year, and in some years the application of but a few inches of water at a critical period has saved a crop from serious injury by drought.
Irrigation by pumping water directly from the river and from wells was started in Pawnee Valley during the early part of this century. By 1925, about 35 irrigation wells were in operation. The number of wells had increased to approximately 75 in 1935 and to 132 in 1945. From 1940 to 1948 the precipitation was above normal and labor was scarce; therefore, many of the irrigation wells were not used. Most of these wells are still available for use if needed, and many new wells are being drilled annually.
Yields of Irrigation Wells
Irrigation wells in Pawnee Valley yield from about 400 to 1,900 gallons a minute. The yields of nine wells were measured by W. W. Wilson and are given in Table 10. These nine wells have an average yield of about 900 gallons a minute. The yields of 108 additional wells were reported by the owners or drillers. The yields of the 117 wells are given in Table 22 and are summarized in Table 12.
Table 12--Reported or measured yields of irrigation wells in Pawnee, Ness, and Hodgeman Counties in Pawnee Valley
| Yield of wells, gallons a minute |
Number of wells | |||
|---|---|---|---|---|
| Pawnee County |
Ness County |
Hodgeman County |
Total | |
| Less than 600 | 3 | 1 | 2 | 6 |
| 600-800 | 10 | 6 | 3 | 19 |
| 800-1,000 | 3 | 11 | 15 | 29 |
| 1,000-1,200 | 21 | 5 | 17 | 43 |
| 1,200-1,400 | 7 | 1 | 2 | 10 |
| 1,400-1,600 | 6 | 2 | 8 | |
| More than 1,600 | 2 | 2 | ||
| Totals | 52 | 24 | 41 | 117 |
The irrigation wells in Pawnee Valley differ greatly in yield and over-all efficiency. The yields of the measured wells range from 685 to 1,210 gallons a minute, and the specific capacities range from 37 to 68 gallons a minute per foot of drawdown. There are many factors that determine the yields of wells, including the methods of construction, the character and thickness of the water-bearing formation, the diameter of the casing, the material used for casing, the type of perforations, the quality of the water (whether harmless or corrosive or whether likely to form incrusting material readily), the type and placing of the screen, the development and finishing of the well, the age of the well, and the distance between pumping wells (effect of mutual interference).
Construction of Irrigation Wells
Several methods have been used in constructing irrigation wells in Pawnee Valley. Some wells have been constructed by the owners but most of the wells have been drilled by professional well drillers. The older irrigation wells in this area were constructed by digging a pit nearly to the water table, then drilling a well through the bottom of the pit. The sides of the pit generally were walled with wood or concrete, and the drilled part was cased with perforated galvanized-iron casing. In some of these wells a centrifugal pump. was placed at the top of the pit, but in most of the wells a centrifugal pump was placed at the bottom of the pit and connected by a belt to an engine at the surface.
Most of the newer plants consist of a single artificial gravel-pack or natural gravel-pack well that penetrates all water-bearing materials above the Cretaceous bedrock. These wells are equipped with deep-well turbine pumps (Pl. 4B).
The most common drilling methods used in this area are the orange-peel bucket method and the hydraulic rotary method. In constructing a well by the orange-peel bucket method, a hole of large diameter (48 to 60 inches) is excavated using an orange-peel bucket and temporarily cased. A well screen or perforated casing of a smaller diameter than the hole (12 to 25 inches) is then lowered into place and centered opposite the water-bearing beds. Blank casing extends from the screen to the surface. The annular space between the inner and outer casings then is filled with carefully sorted gravel--preferably of a grain size just slightly larger than the openings in the screen or perforated casing and also just slightly larger than that of the water-bearing material. The outer casing is then partly withdrawn in order to uncover the screen and allow the water to flow through the gravel packing from the water-bearing material.
In the hydraulic-rotary method, the hole is made by the rapid rotation of a bit on the bottom of a string of drill pipe. In this method removal of the cuttings is accomplished by circulating mud-laden fluid down through the drill pipe and up through the annular space between the drill pipe and the wall of the hole. The cuttings are brought to the surface as fragments suspended in the mud. In drilling a well by the hydraulic-rotary method no casing is used until the drilling has been completed, as the drilling mud prevents the walls of the hole from caving. A casing slightly smaller than the hole is placed in the well after the well has been drilled to the desired depth. If the well is to be gravel-packed, the diameter of the hole is drilled much larger than the desired completed size of the well and the space between the hole and the casing is filled with gravel of the proper size.
Depth and Diameter of Irrigation Wells
The depth and diameter of the irrigation wells in Pawnee Valley are given in Tables 13 and 14. Most of the irrigation wells in Pawnee Valley are less than 100 feet deep. About 58 percent of the wells are between 60 and 100 feet deep.
Table 13--Irrigation wells in Pawnee, Ness, and Hodgeman Counties in Pawnee Valley classified according to depth.
| Depth, feet | Number of wells | |||
|---|---|---|---|---|
| Pawnee County |
Ness County |
Hodgeman County |
Total | |
| Less than 40 | 10 | 2 | 12 | |
| 40-60 | 8 | 18 | 11 | 37 |
| 60-80 | 13 | 9 | 28 | 50 |
| 80-100 | 18 | 8 | 26 | |
| More than 100 | 5 | 2 | 7 | |
| Totals | 54 | 27 | 51 | 132 |
Table 14--Irrigation wells in Pawnee, Ness, and Hodgeman Counties in Pawnee Valley classified according to diameter
| Diameter, inches | Number of wells | |||
|---|---|---|---|---|
| Pawnee County |
Ness County |
Hodgeman County |
Total | |
| Less than 16 | 1 | 5 | 2 | 8 |
| 16 | 6 | 3 | 9 | |
| 18 | 2 | 2 | 7 | 11 |
| 19 | 25 | 4 | 21 | 50 |
| 20 | 2 | 8 | 12 | 22 |
| 24 | 15 | 4 | 19 | |
| More than 24 | 3 | 1 | 5 | 9 |
| Totals | 54 | 23 | 51 | 128 |
The diameter of the irrigation wells ranges from 10 inches to 60 inches but about 87 percent of the wells have a diameter of from 16 to 24 inches.
Types of Pumps Used on Irrigation Wells
The types of pumps used on irrigation wells in Pawnee Valley are given in Table 15. A preference is shown for centrifugal pumps in Pawnee and Ness Counties and for turbine pumps in Hodgeman County.
Table 15--Types of pumps used on irrigation wells in Pawnee, Ness, and Hodgeman Counties in Pawnee Valley
| Type of pumps | Number of wells | |||
|---|---|---|---|---|
| Pawnee County |
Ness County |
Hodgeman County |
Total | |
| Turbine | 22 | 9 | 39 | 70 |
| Centrifugal | 28 | 18 | 13 | 59 |
| Totals | 50 | 27 | 52 | 129 |
Types of Power Used for Pumping Irrigation Wells
The types of power used in 1945 to pump irrigation wells in Pawnee Valley are given in Table 16. The table shows that 16 wells in Pawnee County were equipped with electric motors, but at the time of this investigation, no wells in Ness and Hodgeman Counties had been equipped with electric motors. About half of the wells in each county were equipped with stationary gasoline engines. The other wells in Ness and Hodgeman Counties were equipped with tractors whereas in Pawnee County the other wells were equipped with tractors, electric motors, or butane-gas engines.
Table 16--Types of power used as of 1945 for pumping irrigation wells in Pawnee, Ness, and Hodgeman Counties in Pawnee Valley.
| Type of power | Number of wells | |||
|---|---|---|---|---|
| Pawnee County |
Ness County |
Hodgeman County |
Total | |
| Electric motor | 16 | 16 | ||
| Gasoline engine | 28 | 14 | 25 | 67 |
| Tractor | 11 | 13 | 24 | 48 |
| Butane-gas engine | 1 | 1 | ||
| Totals | 56 | 27 | 49 | 132 |
Availability of Ground Water
General Features
The quantity of water that can be pumped from an underground reservoir without causing excessive permanent lowering of the water table depends on the amount of annual recharge to the reservoir. If the average annual quantity of water withdrawn from a groundwater reservoir is greater than the average annual recharge, water levels will decline. Such withdrawal, if long continued, may result in serious depletion of the ground-water reservoir. The quantity of water that can be withdrawn annually from the ground-water reservoir over a long period of years without causing depletion of the available supply is termed the safe yield of the reservoir. The feasibility of developing additional water supplies from wells for irrigation in Pawnee Valley is dependent upon the safe yield of the underground reservoir which is governed by geologic and hydrologic factors.
In a study of the availability of ground water for irrigation it is necessary to take into consideration the amount of precipitation, the amount of stream flow resulting from the precipitation, the amount of base flow, the amount of ground-water recharge and discharge, and the amount of available ground-water storage. The groundwater storage is a function of the areal extent, saturated thickness, and specific yield of the water-bearing materials.
Storage
Studies were made to determine the quantity of ground water now in storage in the alluvium and terrace deposits in Pawnee Valley. A map of Pawnee Valley was prepared showing the saturated thickness of the alluvium and terrace deposits (Fig. 9). The contour lines showing saturated thickness were prepared by superimposing the water-table contour map (Pl. 2) on the bedrock contour map (Fig. 5) and drawing the contours through points of equal thickness. The contour line showing zero thickness represents the line of contact where the water table passes from the alluvial deposits into the underlying Cretaceous rocks (Pl. 3). The zero contour in the southwestern part of T. 21 S., R. 20 W. is caused by an exposure of the Dakota formation.
The saturated water-bearing materials in Pawnee Valley have a maximum thickness of 120 feet in the vicinity of the Hodgeman-Pawnee county line about a mile north of Pawnee River. In the vicinity of Rozel, the saturated deposits have a thickness of 100 feet. As shown by the north-south cross-section through Larned (L-L' on Pl. 3) and the contours on Figure 9, the saturated deposits have a thickness of about 20 feet near Pawnee River. The saturated deposits south of the river thicken, reaching a thickness of about 120 feet a mile south of Arkansas River. The saturated deposits become thinner to the north of Pawnee River at Larned as the Dakota formation crops out. About 2 miles north of the river they become thicker, reaching a thickness of 120 feet about 4 miles north of the river. The thick deposits located 4 miles north of the river were probably deposited by an ancestral tributary of the Arkansas River.
Figure 9--Saturated thickness of alluvium and terrace deposits.
The area between each pair of contours was measured with a planimeter and was multiplied by the average saturated thickness to give the volume of saturated deposits. The volume of saturated deposits and the total volume of water available for pumping based on an assumed average specific yield of 15 percent is given by townships in Table 17.
Table 17--Volume of saturated water-bearing materials in Pawnee Valley and the volume of water available for pumping based on a specific yield of 15 percent.
| Township | Volume of water-bearing materials, acre-feet |
Volume of water, acre-feet |
|---|---|---|
| T. 20 S., R. 21 W. | 1,000 | 150 |
| T. 20 S., R. 22 W. | 202,000 | 30,300 |
| T. 20 S., R. 23 W. | 163,000 | 24,500 |
| T. 21 S., R. 17 W. | 149,000 | 22,400 |
| T. 21 S., R. 18 W. | 1,051,000 | 157,700 |
| T. 21 S., R. 19 W. | 976,000 | 146,400 |
| T. 21 S., R. 20 W. | 920,000 | 138,000 |
| T. 21 S., R. 21 W. | 1,059,000 | 158,800 |
| T. 21 S., R. 22 W. | 92,000 | 13,800 |
| T. 22 S., R. 17 W. | 1,047,000 | 157,000 |
| T. 22 S., R. 18 W. | 875,000 | 131,200 |
| T. 22 S., R. 19 W. | 541,000 | 81,100 |
| T. 22 S., R. 20 W. | 3,000 | 400 |
| T. 22 S., R. 21 W. | 139,000 | 20,800 |
| T. 22 S., R. 22 W. | 417,000 | 62,500 |
| Total volume | 7,635,000 | 1,145,000 |
The total volume of saturated water-bearing materials in the area under consideration, as measured, was 7,635,000 acre-feet. If the materials have a specific yield of 15 percent, a volume of water equal to 15 percent of the volume of saturated deposits would be available for pumping. Thus, theoretically, from the total volume of 7,635,000 acre-feet of deposits, if completely drained, 1,145,000 acre-feet of water would be available. From a practical standpoint, much less than this quantity of water would be available for irrigation use. When less than half this quantity of water is used from storage, the yields of the wells will greatly diminish, and to irrigate may become economically unfeasible.
Recharge from Precipitation
The mean annual precipitation in Pawnee Valley is about 22 inches, but only a small part of this water reaches the zone of saturation owing to evaporation, transpiration, and direct surface runoff. Water that is not lost by these processes moves downward into the zone of saturation.
The quantity of water added to or discharged from the groundwater reservoir is reflected in the fluctuations of the water levels in wells. The hydrographs of the water levels in seven wells which have been measured since 1940 are shown in Figure 10. A hydrograph of the average water level in the seven wells is shown in Figure 11.
Figure 10--Hydrographs showing the fluctuations of the water levels in seven wells in Pawnee Valley.
Figure 11--Hydrograph showing the fluctuations of the average water level in seven wells in Pawnee Valley, the cumulative departure from normal monthly precipitation at Jetmore, and the monthly precipitation at Jetmore.
The water levels in the wells in Pawnee Valley reflect the net effects of recharge from precipitation, pumping for irrigation, and in parts of the area the recharge from stream flow. Most of the fluctuations shown in Figures 10 and 11 and the general upward trend of the water levels in recent years are caused by recharge from precipitation. During the irrigation season the water table is temporarily lowered in local areas where irrigation wells are concentrated. An example is shown by the hydrograph for well 22-16-6bb for the period June to September in 1946. After the irrigation season, the water level recovered and then as a result of above-normal precipitation during September (2.13 inches above normal), October (5.55), and November (1.36), the water level rose to a level of about 2 feet higher than it was prior to the irrigation season.
The water levels have had a general upward trend since measurements were started in 1940 as shown by Figure 11. The water levels at the end of 1949 were a little over 3 feet higher than they were in 1940. On the basis of a specific yield of 15 percent a rise in water level of 3 feet would be equivalent to 5.4 inches of water added to storage since 1940. The net addition of 5.4 inches of water to the ground-water reservoir represents an increase in storage of 288 acre-feet per square mile.
Figure 11 shows a close relation between precipitation and the fluctuations of the water levels. A straight line was drawn through the curve for cumulative departure from normal precipitation. A straight line having the same slope was drawn through the hydrograph of the averages of the water levels in 7 wells. Thus the same slope fairly well defines the trends of the average water levels during the period 1940 to 1949. A cumulative departure of about 32 inches of precipitation has resulted in a net rise of the water levels of about 3 feet or on the average an annual cumulative departure of about 3 inches of precipitation has resulted in a net rise of the water levels of about 0.3 foot.
The dependence of the water levels on precipitation is illustrated by the calendar year 1943. The departure from normal precipitation, in inches, for the year is as follows: January, -0.16; February, -0.52; March, -4.59; April, -0.36; May, -1.75; June, -4.35; July, -1.69; August +0.19; September, +1.60; October, +0.40; November, -4.96; and December, -4.38. Practically all the water levels declined from January through July. In some wells the decline continued the remainder of the year but in a few, the above-normal precipitation during August, September, and October caused the water levels to rise.
The logs of test holes in Pawnee Valley and the cross-sections in Plate 3 indicate that the material above the water table is not as permeable as that at greater depths. Much of the surficial material consists of silt and clay, and conditions for recharge from precipitation are not too favorable. Nevertheless the hydrographs in Figures 10 and 11 indicate considerable ground-water recharge from precipitation. In recent years the recharge has been more than adequate to supply the water pumped for irrigation and to supply the base flow of Pawnee River. The excess of recharge over the total discharge has resulted in raising the water table an average of about 0.3 foot per year.
Recharge from Stream Flow
Two factors determine whether a stream is capable of supplying water to the underground reservoir: (1) the water surface of the stream must be above the water table and (2) the material between the stream channel and the water table must be sufficiently permeable to permit water to percolate downward and outward from the stream. The water-table contours in Plate 2 indicate that in Pawnee Valley the water table as of 1945 was higher than the stream surface, and hence, the ground water was moving toward the river. However under conditions of heavy withdrawal of ground water resulting in a lowering of the water table below the stream surface, or during flood stages of the river (Pl. 5), the direction of movement of the ground water with respect to the river would be reversed and there would then be recharge from the river. In October, 1945, the water table was depressed locally by pumpage for irrigation. Some observations were made of the stream flow in Pawnee River which indicated that it was a gaining stream along part of its course and a losing stream along other parts. Some estimates of stream flow which were made at 11 points along the river by George S. Knapp, Milton Sears, and V. C. Fishel are given in Table 18.
Plate 5--A, Flood water in Pawnee Valley in the SE cor. SW sec. 27, T. 21 S., R. 17 W., facing northwest. B, Flood water in creek taken from bridge on highway in sec. 29, T. 21 S., R. 18 W., facing north. (Photos taken August 2, 1950.)
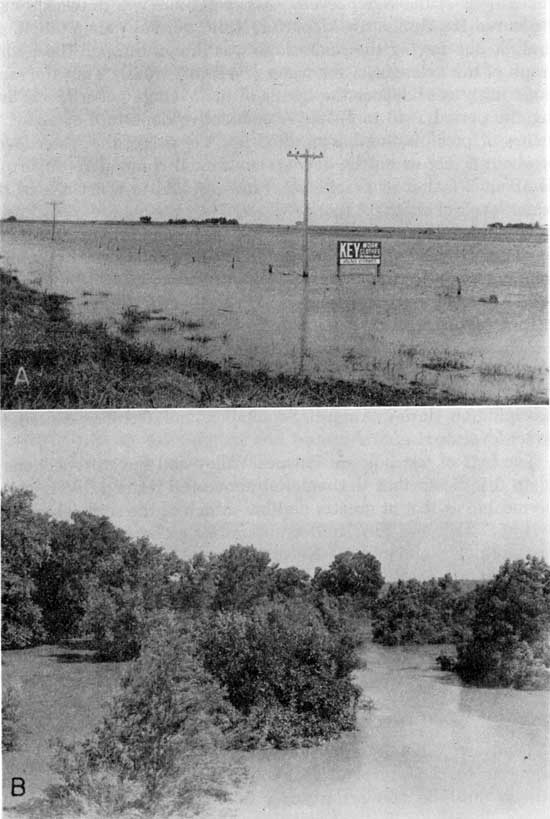
Table 18--Estimates of stream flow of Pawnee River at 11 points on October 10, 1945
| Location | Remarks |
|---|---|
| SE SE sec. 29, T. 20 S., R. 23 W. | No flow; some pools |
| NE SE sec. 28, T. 20 S., R. 23 W. | Flow estimated at 40 g.p.m. |
| NE NE sec. 26, T. 20 S., R. 23 W. | No flow; some pools |
| NE SE sec. 19, T. 20 S., R. 22 W. | No flow; pools west of road |
| NW NW sec. 28, T. 20 S., R. 22 W. | Dry |
| SE SE sec. 27, T. 20 S., R. 22 W. | Flow estimated at 75 g.p.m. |
| SW SW sec. 36, T. 20 S., R. 22 W. | Flow estimated at 200 g.p.m. |
| SE SE sec. 7, T. 21 S., R. 21 W. | Flow estimated at 15 g.p.m. |
| SE SE sec. 20, T. 21 S., R. 21 W. | Flow estimated at 10 g.p.m. |
| SE NE sec. 27, T. 21 S., R. 21 W. | Small trickle |
| SE SE sec. 25, T. 21 S., R. 21 W. | Flow estimated at 30 g.p.m. |
The gradient of Pawnee Valley is approximately 2 feet to the mile. Thus a dam impounding water 2 feet deep at the dam will form a reservoir approximately a mile long. According to a survey by the Division of Water Resources of the State Board of Agriculture, there were 30 small dams in the river in 1939. As the stream level is raised by these reservoirs there will be a reversal of the normal direction of the movement of ground water. The water in the reservoir will recharge and back up the ground water until the slope of the water table is readjusted to the new stream level. The reservoirs formed by the numerous small dams have undoubtedly contributed considerable ground-water recharge in Pawnee Valley. As additional dams are constructed, a greater percentage of the normal stream flow will be held back, some of which will be diverted to ground-water recharge and be available for irrigation pumpage.
That enough reservoir storage may be eventually constructed to hold all the normal stream flow is conceivable. Evaporation would remove a part of the water stored in the reservoirs but much would be contributed to ground-water recharge. Past records of discharge of Pawnee River would give an approximate idea of the maximum quantity of water that can be made available for.irrigation in Pawnee Valley either by pumpage direct from the river or from wells. A stream gauging station has been maintained on Pawnee River since 1924 as a part of the cooperative stream-gauging program of the Federal Geological Survey and the Division of Water Resources of the State Board of Agriculture. The gauge is installed at the Moffet bridge, 300 feet downstream from the dam (Pl. 6) near Frizell, 11 miles west of Larned and 12 miles above Pawnee River confluence with Arkansas River. The drainage area above the dam is 2,300 square miles. Records of stream flow beginning in 1926 are given in Table 19. The runoff from the area has ranged from a minimum of 0.06 inch in 1926 to a maximum of 1.09 inches in 1935 and has averaged about 0.3 inch. The average annual precipitation in Pawnee Valley is about 22 inches. Of this amount 0.3 inch is discharged from the basin as stream flow and the remainder is discharged by evaporation and transpiration. A runoff of 0.3 inch is equivalent to about 36,000 acre-feet of water. Thus the water lost annually by stream flow of Pawnee River from the basin has ranged from a minimum of about 7,250 acre-feet in 1926 to a maximum of about 135,100 acre-feet in 1935 and has averaged about 36,000 acre-feet. This water lost from the basin represents the maximum additional amount of water that can be utilized for irrigation unless it is found feasible to divert some discharge of ground water by useless phreatophytes to beneficial use.
Plate 6--Moffet dam on Pawnee River in the NW sec. 33, T. 21 S., R. 18 S., 11 miles west of Larned. (Photo by George S. Knapp.)
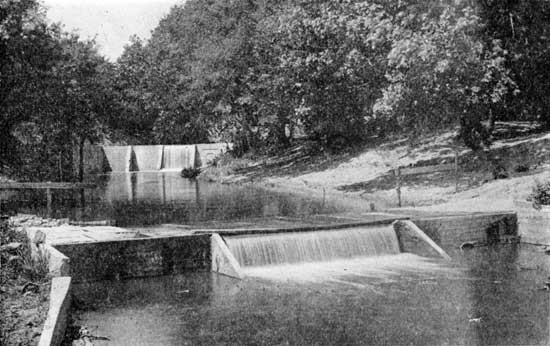
Table 19--Discharge of Pawnee River at the Moget dam, 11 miles west of Larned and 12 miles above confluence with Arkansas River
| Year | Maximum discharge, second-feet |
Minimum discharge, second-feet |
Mean discharge, second-feet |
Annual discharge, acre-feet |
Annual discharge, inches |
|---|---|---|---|---|---|
| 1926 | 582 | 0 | 10.0 | 7,250 | 0.06 |
| 1927 | 766 | 0 | 43.3 | 22,810 | .18 |
| 1928 | 572 | 2 | 29.4 | 21,300 | .17 |
| 1929 | 3,030 | 5 | 42.9 | 31,080 | .25 |
| 1930 | 1,180 | 5 | 35.8 | 25,900 | .21 |
| 1931 | 1,120 | .4 | 20.0 | 14,490 | .12 |
| 1932 | 880 | .2 | 14.1 | 10,220 | .08 |
| 1933 | 3,490 | 3 | 80.8 | 58,540 | .48 |
| 1934 | 1,270 | 1 | 26.0 | 18,850 | .15 |
| 1935 | 17,000 | 0 | 187 | 135,100 | 1.09 |
| 1936 | 2,040 | 0 | 38.4 | 27,860 | .23 |
| 1937 | 981 | 0 | 20.8 | 15,090 | .12 |
| 1938 | 2,070 | 0 | 57.0 | 41,310 | .34 |
| 1939 | 2,690 | 0 | 34.2 | 24,740 | .20 |
| 1940 | 9,900 | 0 | 105 | 76,260 | .62 |
| 1941 | 1,330 | 0 | 30.8 | 22,300 | .18 |
| 1942 | 2,960 | 0 | 34.7 | 25,110 | .20 |
| 1943 | 7,280 | 0 | 58.0 | 42,000 | .34 |
| 1944 | 3,810 | 3 | 129 | 93,420 | .76 |
| 1945 | 653 | 0 | 11.9 | 8,600 | .07 |
Possibilities of Further Development of Irrigation Supplies from Wells
The quantity of water that can be pumped from an underground reservoir without causing excessive permanent lowering of the water table depends on the capacity of the reservoir and on the quantity of periodic recharge to the reservoir. If water is withdrawn from an underground reservoir by pumping faster than it enters, the water levels in wells will decline and the supply eventually will be depleted. The quantity of water that can be withdrawn annually from the ground-water reservoir over a long period of years without causing depletion of the available supply is termed the safe yield of the reservoir. The feasibility of developing additional water supplies from wells for irrigation in Pawnee Valley is dependent upon the safe yield of the underground reservoir and upon other geologic, hydrologic, and economic factors.
The estimate of ground water in storage in Pawnee Valley is more than one million acre-feet. In Table 17 the storage is given for each township. In a few townships the storage amounts to more than 150,000 acre-feet. The maximum amount of storage per township was estimated at 158,800 acre-feet which is about 4,400 acrefeet per square mile or 7 acre-feet per acre. The large quantity of ground water held in storage is available in part for pumping during dry seasons provided that conditions are favorable for replenishment by recharge from precipitation during successive seasons of abundant precipitation or by recharge from the river, or both. Although the above quantities of water may be available from storage, the rate at which the water could be pumped from storage would become progressively lower as the water table declined.
The records of water-level fluctuations in Pawnee Valley (Figs. 10 and 11) show: that the ground-water reservoir is recharged from precipitation; that precipitation was above normal between 1940 and 1949; and that, for the same period, water levels showed a net rise. Annual ground-water withdrawals for irrigation decreased during this period. Thus, it is indicated that ground-water discharge by wells and all natural discharge was less than the recharge for the period 1940 to 1949.
Records of stream flow also suggest that the pumpage for irrigation has been less than the available supply. For the 3-year period 1939 to 1941 the base flow was only about 35 percent of the average for the 24-year period from 1925 to 1948. Since 1941 the amount of base flow has bad a sharp upward trend. For the 3-year period 1946 to 1948 the base flow was about 240 percent of the 24-year period.
Pawnee River is also a possible source of recharge of the groundwater reservoir in Pawnee Valley. If pumping for irrigation increases to the extent that the water table adjacent to the stream is lowered below the level of the stream channel, the river will then contribute water to the ground-water reservoir. Also, if additional small dams are constructed across Pawnee River, the reservoirs formed by the dams will contribute ground-water recharge until a new gradient of the water table is established at a higher level. As additional dams are constructed, a greater percentage of the normal stream flow will be impounded and made available for groundwater recharge. The average annual runoff in Pawnee Valley since 1926 has been about 36,000 acre-feet. If the water that is now discharged as stream flow is impounded and diverted to ground-water recharge, an additional amount equal to about 36,000 acre-feet a year would be available for pumping for irrigation.
Prev Page--Ground Water, General || Next Page--Chemical Character
Kansas Geological Survey, Geohydrology
Placed on web May 31, 2012; originally published April 1952.
Comments to webadmin@kgs.ku.edu
The URL for this page is http://www.kgs.ku.edu/Publications/Bulletins/94/08_irrig.html