![]()
Prev Page--Geology || Next Page--Irrigation, Availability
Source, Occurrence, and Movement of Ground Water
The discussion of the occurrence of ground water in Pawnee Valley has been based partly on the detailed treatment of the occurrence of ground water by Meinzer (1923), to which the reader is referred for more extensive consideration. A general discussion of the principles of ground-water occurrence, with special reference to Kansas, has been made by Moore and others (1940).
Throughout most, if not all, of Pawnee Valley, the rock formations below a certain level are saturated with water. The upper surface of the zone of saturation is known as the water table. The water in the upper part of the zone of saturation is generally replenished from precipitation, some of which reaches the water table by percolation downward through the soil. Normally the water that reaches the water table moves slowly toward Pawnee River or its tributaries and discharges into them. Before all the ground water above stream level can be drained away, more water is generally added from the surface; thus keeping the water table somewhat above stream level in the inter-stream tracts, though fluctuating as the recharge is temporarily more or less than the discharge. Owing to the continuous process of draining and the intermittent nature of recharge, the water table is in continuous fluctuation.
The ground water in Pawnee Valley consists largely of water that has fallen in the form of rain and snow and has percolated through the soil and subsoil materials to the water table. In areas of heavy pumping of ground water for irrigation the water table may be lower than the water surface in the river, and the aquifer may receive recharge from the river. On numerous occasions the Pawnee River has been observed to be dry along part of its course and to be flowing in parts. The dry parts were presumably caused by a lowering of the water table by pumping. Where the water table was above the bed of the river, the river was a gaining stream and where it was below the river it was a losing stream.
The water in the alluvium occurs in the interstices between particles of clay, silt, sand, and gravel. The rate at which water moves through these materials depends on the hydraulic gradient, or slope of the water table, and on the size and shape of the interstices. The quantity of water available for pumping also depends on the thickness and areal extent of the saturated alluvium. Water moves freely through coarse gravels even under low hydraulic gradients, whereas it moves with extreme slowness through compact clay even under high hydraulic gradients. Although considerable quantities of water may move through beds of clay over very long periods of time, these deposits are regarded as being essentially impervious, and their importance with respect to ground water in some places is merely that they may serve as confining beds for water in adjacent beds of more permeable material.
The shape and slope of the water table in Pawnee Valley are shown on Plate 2 by contours drawn on the water table. Each contour line has been drawn through points on the water table having the same altitude. Ground water generally moves in the direction of maximum slope, which is at right angles to the contours. The contour map indicates that the water table slopes toward Pawnee River from both sides and that ground water is generally discharging into the river. Near the middle of the valley, the contours trend almost at right angles to the axis of the valley, and the spacing of the contours indicates an average hydraulic gradient or slope of about 4 feet to the mile.
The quantity of water flowing through a given cross-sectional area of water-bearing material is computed by the formula:
Q = pAv = PIA
in which Q is the quantity of water, p is the porosity of the material, A is the cross-sectional area, v is the average velocity of the ground water, P is the coefficient of permeability, and I is the hydraulic gradient. The approximate rate of movement of the water through the gravel, sand, and silt can be obtained by application of the above formula transposed as follows:
v = PI / p
If P is defined in Meinzer's units (gallons per day per square foot under a hydraulic gradient of 100 percent and a temperature of 60° F.), if I is given in feet per mile, and if p is given in percentage, v will be given in feet per day by the following formula:
v = PI / 395p
The average coefficient of permeability of four pumping tests (wells 21-21-35ba, 21-21-35cc, 22-22-23bc, and 23-22-11cc) is about 1,400. The hydraulic gradient is about 4 feet to the mile. For an assumed porosity of 30 percent for alluvial sediments in Pawnee Valley the average velocity of the ground water can be computed by the above formula as follows:
v = (1,400 X 4) / (395 X 30) = 0.5 foot per day.
For silt having a coefficient of permeability of 10 gallons a day per square foot, a porosity of 30 percent, and a hydraulic gradient of 4 feet to the mile the ground water would have a velocity of about 0.04 inch per day.
Hydrologic Properties of the Water-bearing Materials
The quantity of ground water that a water-bearing formation will yield to wells depends upon the hydrologic properties of the material. The two hydrologic properties of greatest significance with respect to rate of yield are permeability and specific yield. Permeability is a measure of the ability of a formation to transmit water; specific yield is a measure of the quantity of water that will drain from the formation.
The permeability of a water-bearing formation is the discharge per unit of area per unit of hydraulic gradient. It may be measured in terms of the number of gallons of water a day, at 60° F., conducted laterally through each mile of the water-bearing bed under investigation (measured at right angles to the direction of flow), for each foot of thickness of the bed, and for each foot per mile of hydraulic gradient (Stearns, 1927, p. 148).
The specific yield of a water-bearing formation is defined by Meinzer (1923, p. 26) as the ratio of (1) the volume of water which, after being saturated, it will yield by gravity to (2) its own volume. The specific yield is a measure of the quantity of water that a formation will yield when it is drained by a lowering of the water table.
Pumping Tests
The permeability of the alluvium in Pawnee Valley was determined by five pumping tests. The results of all the tests were analyzed by the recovery method involving the formula developed by Theis (1935, p. 522) and also described by Wenzel (1942, p. 94) for computing the transmissibility of an aquifer. (The coefficient of transmissibility is equal to the average field coefficient of permeability, not corrected for temperature, multiplied by the saturated thickness of the aquifer.) The results of one test were analyzed by the distance-drawdown method described by Cooper and Jacob (1946, p. 527) for the determination of the coefficients of permeability and storage.
According to the recovery formula:
T = (264q log10t/t') / s
in which T = coefficient of transmissibility, in gallons per day per foot; q = pumping rate, in gallons per minute; t = time since pumping began, in minutes; t' = time since pumping stopped, in minutes; and s = residual drawdown at the pumped well, in feet, at time t'.
The ratio log10t/t' to s is equal to the ratio Δlog10t/t' to Δd where Δd is the change in the depth to the water level during the time interval Δt'. The ratio of Δlog10t/t' to Δd is determined graphically by plotting t/t' against corresponding values of d on semi-logarithmic paper with t/t' on the logarithmic coordinate. Over one cycle of the semi-logarithmic scale Δlog10t/t' becomes unity and the above formula reduces to:
T = 264q / Δd
where Δd is the change in depth to the water level over one cycle of the semi-logarithmic scale.
According to the distance-drawdown method described by Cooper and Jacob (1946, p. 527, eq. 3):
S= -(2.303Q / 2πT)[log10r - 1/2 log10(2.25Tt / S)]
The variables in this equation are the drawdown s, the distance r, and the time t. T is the coefficient of transmissibility and S is the coefficient of storage. When t is constant, the above equation will be a straight-line plot of s againt log10r. The slope of the straight-line plot is represented by the quantity on the outside of the brackets and the intercept of the straight line on the zerodrawdown line is represented by the second term within the brackets.
The drawdown at a time (t) after the discharge begins is plotted against r on semi-logarithmic paper with r on the logarithmic scale. Equating the quantity outside of the brackets in the above equation with the slope of the graph,
(2.303Q / 2πT) = (Δs / Δlog10r)
Then T = (2.303Q / 2π) (Δlog10r / Δs)
For convenience Δlog10r may be made unity by having it represent one logarithmic cycle, thus (Cooper and Jacob, eq. 6):
T = (2.303Q / 2πΔs
where Δs is the difference in drawdown over one logarithmic cycle.
The second term in brackets in the original equation can be equated with the intercept of the straight line on the zero-drawdown line and solved for the coefficient of storage (Cooper and Jacob, eq. 7):
S = (2.25Tt / r02
where r0 is the value of r at the s = 0-intercept.
Alexander pumping test--A pumping test was made by W. W. Wilson and D. C. Forrey on well 21-21-35cc on the farm of H. E. Alexander located in the SW SW sec. 35, T. 21 S., R. 21 W. The well was pumped on September 10, 1947, at an average rate of about 825 gallons a minute from 7:59 a.m. to 12:10 p.m. The static water level before pumping started was 31.35 feet below the land surface. The drawdown was about 14.4 feet and the specific capacity was about 57 gallons a minute per foot. The water-level measurements made during and following the pumping period are given in Table 3. The drawdown and recovery curves are shown in Figure 6.
Table 3--Water-level measurements in feet below the land surface in the Alexander irrigation well made during the pumping test on September 10, 1947.
| Time | Depth to water level, feet |
Discharge, gallons a minute |
Remarks |
|---|---|---|---|
| 7:50 a.m. | 31.35 | Static water level | |
| 7:59 | Pumping started | ||
| 8:20 | 44.25 | 831 | |
| 8:50 | 44.90 | 825 | |
| 9:20 | 45.30 | 820 | |
| 9:50 | 45.65 | 818 | |
| 10:20 | 45.75 | 813 | |
| 10:50 | 45.98 | 807 | |
| 11:50 | 46.25 | 803 | |
| 11:55 | 1060 | ||
| 12:10 p.m. | Pumping stopped | ||
| 12:11 | 37.22 | ||
| 12:12 | 36.37 | ||
| 12:13 | 35.98 | ||
| 12:14 | 35.69 | ||
| 12:15 | 35.52 | ||
| 12:17 | 35.26 | ||
| 12:19 | 35.08 | ||
| 12:22 | 34.88 | ||
| 12:25 | 34.72 | ||
| 12:30 | 34.53 | ||
| 12:40 | 34.22 | ||
| 12:50 | 33.99 | ||
| 1:00 | 33.79 | ||
| 1:15 | 33.58 | ||
| 1:30 | 33.40 | ||
| 2:00 | 33.07 | ||
| 2:30 | 32.76 | ||
| 3:00 | 32.67 | ||
| 3:30 | 32.53 | ||
| 4:00 | 32.39 |
Figure 6--Drawdown and recovery curves for the Alexander well (21-21-35cc) during the pumping test on September 10, 1947.
In applying the Theis recovery formula to the data given in Table 3, the value of T (coefficient of transmissibility) was found to be 139,000. The coefficient of transmissibility (139,000) divided by the thickness of saturated water-bearing material (48 feet) gives an average coefficient of permeability of 2,900.
Chilson pumping test--A pumping test was made by W. W. Wilson and D. W. Berry on well 23-22-11cc on the farm of L. R. Chilson located in the SW cor. sec. 11, T. 23 S., R. 22 W. The well was pumped on November 15, 1946, at an average rate of about 685 gallons a minute from 10: 10 a. m. to 2:19 p. m. The static water level before pumping started was 21.83 feet below the land surface. The drawdown was about 18.0 feet and the specific capacity was about 38 gallons a minute per foot. The water-level measurements made during and following the pumping period are given in Table 4.
Table 4--Water-level measurements in feet below the land surface in the Chilson irrigation well (23-22-11cc) made during the pumping test on November 15, 1946
| Time | Depth to water level, feet |
Discharge, gallons a minute |
Remarks |
|---|---|---|---|
| 10:05 a.m. | 21.83 | Static water level | |
| 10:10 | Pumping started | ||
| 10:30 | 41.05 | 724 | |
| 11:00 | 40.13 | 695 | |
| 11:30 | 40.50 | 681 | |
| 12:00 | 40.60 | 682 | |
| 1:15 p.m. | 41.00 | 677 | |
| 2:15 | 39.80 | 657 | |
| 2:19 | Pumping stopped | ||
| 2:20 | 31.38 | ||
| 2:21 | 29.65 | ||
| 2:22 | 28.73 | ||
| 2:23 | 28.19 | ||
| 2:24 | 27.79 | ||
| 2:25 | 27.49 | ||
| 2:26 | 27.22 | ||
| 2:27 | 26.99 | ||
| 2:28 | 26.77 | ||
| 2:29 | 26.63 | ||
| 2:30 | 26.47 | ||
| 2:33 | 26.09 | ||
| 2:36 | 25.79 | ||
| 2:40 | 25.43 | ||
| 2:50 | 24.80 | ||
| 3:W | 24.41 | ||
| 3:15 | 241.05 | ||
| 3:30 | 23.80 | ||
| 4:00 | 23.48 | ||
| 5:00 | 23.11 |
In applying the Theis recovery formula to the data given in Table 4, the value of T (coefficient of transmissibility) was found to be 44,800. The coefficient of transmissibility (44,800) divided by the thickness of water-bearing material (76 feet) gives an average coefficient of permeability of 590.
Hirschler pumping test--A pumping test was made by W. W. Wilson and G. C. Prescott on May 20, 1948, on well 22-22-23bc on the farm of E. E. Hirschler located in the SW NW sec. 23, T. 22 S., R. 22 W. The well was pumped at an average rate of about 1,210 gallons a minute from 8:04 a.m. to 11:52 a.m. The static water level before pumping started was 30.80 feet below the land surface. The drawdown was about 27.0 feet and the specific capacity was about 45 gallons a minute per foot. The water-level measurements made during and following the pumping period are given in Table 5.
Table 5--Water-level measurements in feet below the land surface in the Hirschler irrigation well (22-22-23bc) made during the pumping test on May 20,1948
| Time | Depth to water level, feet |
Discharge, gallons a minute |
Remarks |
|---|---|---|---|
| 8:00 a.m. | 30.80 | Static water level | |
| 8:04 | Pumping started | ||
| 8:45 | 1,234 | ||
| 9:15 | 1,222 | ||
| 9:45 | 1,220 | ||
| 10:15 | 1,204 | ||
| 10:45 | 1,213 | ||
| 11:15 | 1,203 | ||
| 11:45 | 58 | 1,190 | |
| 11:52 | Pumping stopped | ||
| 11:54 | 40.25 | ||
| 11:55 | 39.20 | ||
| 11:56 | 38.47 | ||
| 11:57 | 37.88 | ||
| 11:58 | 37.39 | ||
| 11:59 | 36.97 | ||
| 12:00 | 36.62 | ||
| 12:01 p.m. | 36.30 | ||
| 12:02 | 35.99 | ||
| 12:03 | 35.77 | ||
| 12:04 | 35.53 | ||
| 12:05 | 35.33 | ||
| 12:06 | 35.13 | ||
| 12:07 | 34.95 | ||
| 12:08 | 34.78 | ||
| 12:09 | 34.63 | ||
| 12:10 | 34.48 | ||
| 12:12 | 34.23 |
In applying the Theis recovery formula to the data given in Table 5, the value of T (coefficient of transmissibility) was found to be 51,000. The coefficient of transmissibility (51,000) divided by the thickness of water-bearing material (82 feet) gives an average coefficient of permeability of 620.
Lynam pumping test--A pumping test was made by W. W. Wilson and D. C. Forrey on September 9, 1947, on well 21-21-21bc on the farm of W. A. Lynam located in the SW NW sec. 21, T. 21 S., R. 21 W. The well was pumped at an average rate of 840 gallons a minute from 8: 10 a. m. to 11:50 a.m. The static water level before pumping started was 33.21 feet below the land surface. The drawdown was about 14 feet and the specific capacity was about 60 gallons a minute per foot. The water-level measurements made during and following the pumping period are given in Table 6.
Table 6--Water-level measurements in feet below the land surface in the Lynam irrigation well (21-21-21bc) made during the pumping test on September 9, 1947
| Time | Depth to water level, feet |
Discharge, gallons a minute |
Remarks |
|---|---|---|---|
| 8:00 a.m. | 33.21 | Static water level | |
| 8:10 | Pumping started | ||
| 8:30 | 46.09 | 835 | |
| 9:00 | 46.48 | 845 | |
| 9:30 | 47.02 | 848 | |
| 10:00 | 47.05 | 845 | |
| 10:30 | 47.20 | 845 | |
| 11:00 | 47.36 | 845 | |
| 11:45 | 47.30 | 825 | |
| 11:50 | Pumping stopped | ||
| 11:51 | 34.79 | ||
| 11:52 | 34.71 | ||
| 11:53 | 34.57 | ||
| 11:54 | 34.49 | ||
| 11:56 | 34.41 | ||
| 11:58 | 34.34 | ||
| 12:01 p.m. | 34.29 | ||
| 12:05 | 34.23 | ||
| 12:15 | 34.11 | ||
| 12:25 | 34.04 | ||
| 12:45 | 33.92 | ||
| 1:00 | 33.86 | ||
| 1:20 | 33.78 | ||
| 1:40 | 33.73 |
In applying the Theis recovery formula to the data given in Table 6, the value of T (coefficient of transmissibility) was found to be 460,000. The coefficient of transmissibility (460,000) divided by the thickness of water-bearing material (38.4 feet) gives an average coefficient of permeability of 12,000.
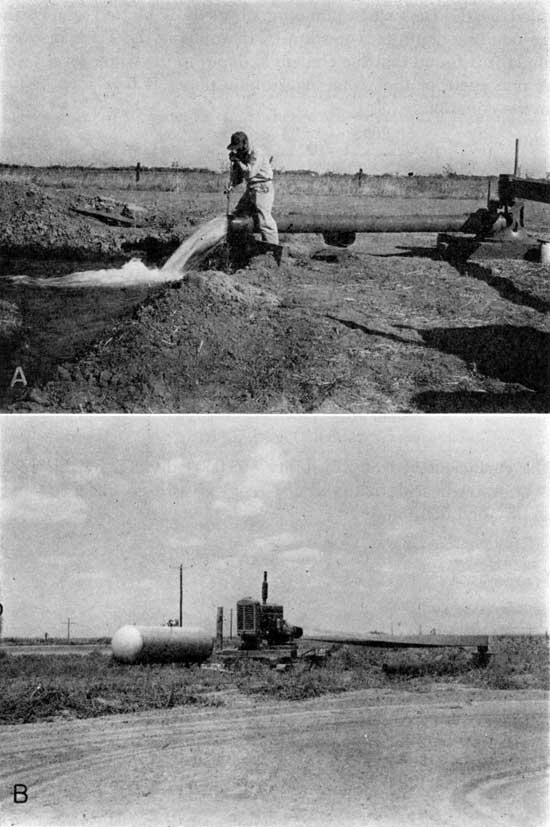
Norris pumping test--A pumping test was made by W. W. Wilson, T. G. McLaughlin, and V. C. Fishel on October 6, 1949, on well 21-21-35ba on the farm of Clyde Norris located in the NE NW sec. 35, T. 21 S., R. 21 W. (Pl. 4A). The well was pumped at an average rate of 950 gallons a minute from 9:03 a.m. to 5:40 p.m. The static water level before pumping started was 30.74 feet below the land surface. The drawdown was about 14.5 feet and the specific capacity was about 65 gallons a minute per foot.
Plate 4--A, Measuring the discharge of the Norris well (21-21-35ba) with a Hoff current meter. B, Irrigation well 22-22-23bc equipped with a turbine pump powered by an engine using butane gas.
Two 1 1/4-inch observation wells having depths of 45 feet were constructed along the fence line east of the pumped well. The wells were located 100 and 300 feet respectively east of the irrigation well. The water levels in these observation wells and the pumped well were measured during and after the pumping period.
The measuring point of the pumped well was 99.43 feet above an assumed datum. The measuring point of the well 100 feet east was 99.46 feet above the datum and the measuring point of the well 300 feet east was 100.00 feet above the datum.
The discharge measurements made by a Hoff current meter (Pl. 4A) during the pumping period are given in Table 7. The water-level measurements made during the pumping period are given in Table 8 and the recovery measurements are given in Table 9.
Table 7--Discharge measurements of the Norris irrigation well made during the pumping test on October 6, 1949
| Time | Discharge, gallons a minute |
|---|---|
| 9:15 a.m. | 976 |
| 9:36 | 955 |
| 10:37 | 959 |
| 11:28 | 935 |
| 12:12 p.m. | 939 |
| 12:53 | 946 |
| 1:28 | 952 |
| 2:08 | 952 |
| 2:35 | 949 |
| 3:10 | 946 |
| 3:38 | 946 |
| 4:32 | 942 |
| 5:12 | 939 |
| 5:29 | 935 |
| 5:40 | Pump stopped |
Table 8--Water-level measurements in feet below the measuring points in the Norris irrigation well and observation wells during the pumping period on October 6, 1949
| Pumped well | Well 100 feet east | Well 300 feet east | |||
|---|---|---|---|---|---|
| Time | Depth to water level, feet |
Time | Depth to water level, feet |
Time | Depth to water level, feet |
| 9:00 a.m. | 31.34 | 9:00 a.m. | 31.33 | 9:00 a.m. | 32.70 |
| 9:16 | 43.85 | 9:04 | 32.50 | 9:28 | 33.09 |
| 9:38 | 44.57 | 9:06 | 33.06 | 9:46 | 33.46 |
| 9:53 | 44.73 | 9:08 | 33.35 | 9:59 | 33.63 |
| 10:22 | 44.98 | 9:23 | 34.13 | 10:18 | 33.80 |
| 11:30 | 45.21 | 9:30 | 34.30 | 10:47 | 33.99 |
| 12:04 p.m. | 45.29 | 9:43 | 34.55 | 11:50 | 34.26 |
| 12:54 | 45.41 | 10:02 | 34.70 | 12:20 p.m. | 34.36 |
| 1:29 | 45.50 | 10:15 | 34.80 | 12:47 | 34.44 |
| 2:09 | 45.60 | 10:43 | 34.94 | 1:31 | 34.56 |
| 2:37 | 45.64 | 11:03 | 35.03 | 2:43 | 34.69 |
| 3:11 | 45.71 | 11:47 | 35.18 | 3:10 | 34.74 |
| 3:40 | 45.72 | 12:17 p.m. | 35.27 | 3:47 | 34.80 |
| 4:34 | 45.78 | 12:50 | 35.36 | 4:27 | 34.96 |
| 5:13 | 45.83 | 1:29 | 35.45 | 5:30 | 34.95 |
| 5:31 | 45.83 | 2:41 | 35.60 | ||
| 3:08 | 35.65 | ||||
| 3:45 | 35.63 | ||||
| 4:25 | 35.79 | ||||
| 5:29 | 35.87 | ||||
| 5:37 | 35.89 | ||||
Table 9--Recovery water-level measurements in feet below the measuring point in the Norris irrigation well and observation wells following the pumping period on October 6, 1949
| Pumped well | Well 100 feet east | Well 300 feet east | |||
|---|---|---|---|---|---|
| Time | Depth to water level, feet |
Time | Depth to water level, feet |
Time | Depth to water level, feet |
| 5:42 p.m. | 34.24 | 5:40 1/2 p.m. | 34.95 | 5:41 p.m. | 34.94 |
| 5:43 | 34.08 | 5:41 1/2 | 34.63 | 5:42 | 34.88 |
| 5:44 | 33.98 | 5:42 1/2 | 34.45 | 5:43 | 34.84 |
| 5:45 | 33.91 | 5:43 1/2 | 34.38 | 5:44 | 34.82 |
| 5:47 | 33.81 | 5:44 1/2 | 34.30 | 5:45 | 34.80 |
| 5:50 | 33.74 | 5:45 1/2 | 34.26 | 5:47 | 34.77 |
| ,5:55 | 33.66 | 5:46 1/2 | 34.20 | 5:49 | 34.73 |
| 6:05 | 33.54 | 5:47 1/2 | 34.18 | 5:50 | 34.73 |
| 6:15 | 33.47 | 5:48 1/2 | 34.15 | 5:51 | 34.72 |
| 6:30 | 33.35 | 5:49 1/2 | 34.12 | 5:53 | 34.70 |
| 5:50 1/2 | 34.11 | 5:55 | 34.67 | ||
| 5:55 | 34.04 | 5:57 | 34.66 | ||
| 6:00 | 33.99 | 5:59 | 34.63 | ||
| 6:10 1/2 | 33.91 | 6:03 | 34.61 | ||
| 6:17 | 33.85 | ||||
The recovery measurements given in Table 9 for the pumped well are plotted on Figure 7. The ratio t/t' (time since pumping started divided by the time since pumping stopped) is plotted against the corresponding depth to water level. In applying the Theis recovery formula it is found that the change in depth to the water level (Δd) over one cycle of the semi-logarithmic paper is 0.68 foot. Then from the equation
T = 264q / Δd = (264 X 950) / 0.68 = 366,000
The drawdown of the water levels near the end of the pumping period in the observation wells are plotted in Figure 8 against the distance of the observation wells from the pumped well.
Figure 7--Pumping test on Norris well obtained by plotting the depth to the water level against t/t' (time since pumping started divided by the time since pumping stopped).
Figure 8--Drawdown of water levels plotted against the distance of the observation wells from the pumped well during the test on the Norris well.
In applying the distance-drawdown formula given [earlier] it is found that the change in drawdown (Δs) over one cycle of the semi-logarithmic paper is 5.27 feet. The rate of pumping was about 950 gallons a minute or 2.12 cubic feet per second.
T = 2.303Q / 2πΔs = (2.303 X 2.12) / (2 X 3.1416 X 5.27) = 0.147 c.f.s./ft = 95,000 g.p.d./ft
The coefficient of transmissibility (95,000) divided by the thickness of water-bearing material (61 feet) gives a coefficient of permeability of 1,550.
From Figure 8 it is found that when s = 0, r = 810. Then applying the formula
S = (2.25Tt / r02 = (2.25 X 0.149 X 0.39 X 86,400) / 8102 = 1.7 percent
Summary of Permeability Tests
Pumping tests were made on five wells in Pawnee Valley to determine the permeability of the water-bearing materials. Pumping tests were made on four additional wells to determine their yields. The results of the pumping tests are summarized in Table 10.
Table 10--Results of pumping tests made on wells in Pawnee Valley
| Well No. | Owner | Depth of well, ft. |
Yield, g.p.m. |
Specific capacity, g.p.m./ft. |
Coefficient of transmissibility, g.p.d./ft. |
Coefficient of permeability, g.p.d. |
|---|---|---|---|---|---|---|
| 21-21-21bc | W. W. Lynam | 72 | 840 | 60 | 460,000 | 12,000 |
| 21-21-33cc | Melvin Bryant | 95 | 900 | |||
| 21-21-35ba | Clyde Norris | 96 | 950 | 66 | 95,000 | 1,550 |
| 21-21-35cc | H. E. Alexander | 80 | 825 | 57 | 139,000 | 2,900 |
| 22-21-3 | Korf Brothers | 87 | 1,070 | 65 | ||
| 22-21-4aa | Melvin Bryant | 73 | 1,050 | 68 | ||
| 22-21-9cc | R. H. Thomson | 67 | 750 | |||
| 22-22-23bc | E. E. Hirsehler | 114 | 1,210 | 45 | 51,000 | 620 |
| 23-22-11cc | L. R. Chilson | 98 | 685 | 37 | 44,800 | 590 |
The test on the Lynam well indicated a coefficient of permeability of 12,000 which probably results from very favorable local conditions in the water-bearing material in Pawnee Valley. Neglecting this test and the recovery test on the Norris well, the other four tests gave an average of about 1,400 for the coefficient of permeability. These four permeability tests, two in Pawnee River Valley and two in Buckner Creek Valley, indicate that the alluvium in the two valleys differs materially as to permeability. Also the test drilling indicates that the gravel and sand in Pawnee Valley is more coarse and generally has a greater thickness.
Summary of Specific Yield Tests
The analysis of the pumping test on the Norris irrigation well indicated a specific yield (storage coefficient) of 1.7 percent. The well is semi-artesian because the aquifer is confined by several feet of clay during nonpumping conditions. As a result of the semiartesian conditions the specific yield obtained by this method was much too low for average conditions of the water-bearing material in Pawnee Valley.
Additional pumping tests and laboratory tests are planned in an attempt to determine a more correct value of the specific yield.
Pending these pumping tests and the laboratory tests a specific yield of 15 percent is being used, as the material in Pawnee Valley seems to be comparable to some material in other areas where the specific yield is about 15 percent.
Ground-water Levels and Their Significance
The water table in Pawnee Valley is not a stationary surface, but a surface that fluctuates up and down much like the water level in a lake or reservoir. However, over a long period of time a condition of approximate equilibrium exists between the amount of water that is added annually to ground-water storage and the amount that is discharged annually by natural means. In general, the water table rises when the amount of recharge exceeds the amount of discharge and declines when the discharge is greater than the recharge. Thus, changes in the water levels in wells indicate to what extent the ground-water reservoir is being depleted or replenished.
The factors controlling the rise of the water table in Pawnee Valley are (1) the amount of precipitation within the valley that passes through the soil and descends to the water table; and (2) the amount of influent seepage that reaches the underground reservoir from Pawnee River and its tributaries. The relation between the amount of precipitation and the level at which the water stands in wells is complicated by several factors. After a long dry period, the soil moisture becomes depleted through evaporation and transpiration; when a rain does occur the soil moisture must be replenished before any water can descend to the water table. During the winter when the ground is frozen the water falling on the surface is hindered from reaching the water table, and during the hot summer, some of the water that falls as rain is lost directly into the air by evaporation. Where the water table stands comparatively far below the surface, it fluctuates less in response to precipitation than it does where it is comparatively near the surface. In Pawnee Valley the water table is generally overlain by several feet of silt and clay (Pl. 3) which retards and limits the movement of water down to the water table.
The factors controlling the decline of the water table are (1) the quantity of water pumped from wells for irrigation, domestic, and stock use; (2) the quantity of water transpired directly from the water table by plants; (3) the quantity lost from the groundwater reservoir by evaporation; and (4) the quantity discharged as effluent seepage into the streams. Pawnee River has a deep channel; over most of the valley, the water table is more than 15 feet below the land surface and over much of the valley it is more than 20 feet below the land surface. Consequently the quantity of water discharged directly from the water table by evaporation and transpiration is small.
The ground-water levels in Pawnee Valley are an index of the extent of irrigation development in the valley. As irrigation from wells increases the water levels will decline until they are readjusted to the increased pumpage. If the irrigation developments reach the point where the pumpage exceeds the ground-water recharge, the water levels will continue to decline. Thus the ground-water levels give a close check on the relationship between the available water supply and its development.
Observation-well Program
In August 1940, eight wells in Pawnee Valley were selected as observation wells, and about monthly measurements of water level in them were begun to obtain information concerning the fluctuations in storage of the underground reservoir. Measurements on one well (21-19-27cc) were discontinued in December 1948. The descriptions of the wells and the water-level measurements for 1940 are given in Water-Supply Paper 908 which is the annual water-level report of the Federal Geological Survey for that year (Meinzer and Wenzel, 1942, pp. 124-125, 150-151). Subsequent water-level measurements have been published in ensuing water-level reports (Water-Supply Papers 938, 946, 988, 1018, 1025, and 1073). The descriptions of the wells are included in Table 22 of this report. The well numbers used in this report and in the water-supply papers are correlated in Table 11.
Table 11--Observation-well numbers used in this report and the corresponding numbers given in annual water-supply papers
| Well No. in this report |
Well No. in water-supply papers |
|---|---|
| 20-22-20cc | Ness 2 |
| 20-23-32ca | Ness 1 |
| 21-19-27ce | Pawnee 6 |
| 21-21-36ab | Hodgeman 5 |
| 21-22-12bc | Hodgeman 3 |
| 22-16-6bb | Pawnee 8 |
| 22-17-18aa | Pawnee 7 |
| 22-22-13cc | Hodgeman 4 |
Prev Page--Geology || Next Page--Irrigation, Availability
Kansas Geological Survey, Geohydrology
Placed on web May 31, 2012; originally published April 1952.
Comments to webadmin@kgs.ku.edu
The URL for this page is http://www.kgs.ku.edu/Publications/Bulletins/94/05_somg.html