![]()
Prev Page—Cherokee and Distribution || Next Page—Conclusions
Production of Gas and Oil
Gas Production
The initial open flow and the production of wells in the McLouth field vary from well to well (table 9). These variations are due chiefly to the changing character and varying porosity and permeability of the productive zones in the McLouth sand, as discussed above.
Table 9—Initial open flow of gas in thousand cubic feet per day, initial and subsequent closed pressure in pounds per square inch, and production by wells in the McLouth field to April 1, 1943.
| Well Name | Location | Date Completed |
Open Flow in M cu. ft/day |
Closed Pressure in lbs/sq. in. |
Production in M cu. ft. |
Totals To 4-1 1943 |
|||||
|---|---|---|---|---|---|---|---|---|---|---|---|
| Initial | Nov. 1941 |
Initial | Nov. 1941 |
4-27 1943 |
1941 | 1942 | 1943 to 4-1 |
||||
| McLouth Pool | |||||||||||
| 50. C. Miller No. 1 fee | NW SW 22-9-20 | 9-22-1942 | 8,000 | 455 | 12,980 | 18,627 | |||||
| 52. McLaughlin & Sons No. 1 C. Miller | SW SW 22-9-20 | 11-7-1942 | 1,000 | ||||||||
| 53. Wm. O. Smythe et al No. 1 O. Jacobson** | SW NW 27-9-20 | 5-20-1942 | 500 | 450 | 5,257 | 1,628 | |||||
| 54. E. W. Mosbacher No. 1 M. A. Dolman* | NW NW SE 27-9-20 | 11-28-1941 | 360 | 759 | 450 | 468 | 5,554 | 0 | |||
| 56. Hatcher & Fisk No. 2 F. J. Harwood | SE NW 28-9-20 | 11-4-1942 | 3,750 | 445 | 3,083 | 54,831 | |||||
| 57. Hatcher & Fisk No. 3 F. J. Harwood | NE SW 28-9-20 | 11-24-1942 | 1,000 | ||||||||
| 59. O. J. Connell No. 3 T. C. Moseberger | NE NE 28-9-20 | 2-20-1943 | 2,000 | ||||||||
| 60. McLaughlin & Sons No. 1 S. S. Miller | SW NE 28-9-20 | 7-17-1942 | 2,480 | 460 | 26,460 | 8,780 | |||||
| 61. Don Allen et al No. 1 S. S. Miller | SW NE NE 28-9-20 | 9-11-1942 | 2,750 | 461 | 22,733 | 22,431 | |||||
| 62. W. Archie et al No. 1 P. Shrader | SE SW 28-9-20 | 7-25-1941 | 396 | 5,529 | 0 | ||||||
| 64. H. Workman et al No. 1 Old Line Ins. | NW SE 28-9-20 | 9-11-1942 | 800 | 421 | 121 | 1,950 | 5,711 | ||||
| 84. Ray Anderson et al No. 1 Grant F. Woodhead | NE SW 32-9-20 | 7-17-1941 | 13,055 | 6,789 | 450 | 351 | 108,417 | 53,616 | 14,154 | ||
| 85. Hatcher & Fisk No. 1 W. E. Myers | SW SW 32-9-20 | 1-9-1942 | 3,730 | 31,348 | 3,334 | ||||||
| 86. Magnolia No. 1 W. E. Myers | SE SW 32-9-20 | 9-3-1941 | 7.643 | 8,285 | 356 | 356 | 2,929 | 184,903 | 18,329 | ||
| 87. J. W. Longwell et al No. 1 S. Brose | NW SE 32-9-20 | 9-20-1941 | 3,360 | 1.258 | 370 | 350 | 5,736 | 8,366 | 0 | ||
| 88. Willard Archie et al No. 1 S. Brose | NE SE 32-9-20 | 8-4-1941 | 1.070 | 537 | 370 | 344 | 996 | 0 | 0 | ||
| 89. Magnolia No. 1 W. W. Harris | SW SE 32-9-20 | 7-27-1941 | 12,250 | 8,658 | 419 | 352 | 106.095 | 95.577 | 30,057 | ||
| 90. Magnolia No. 1 Rachel Davidson | SE SE 32-9-20 | 6- 6-1941 | 10.500 | 6,693 | 450 | 348 | 101,447 | 89,289 | 19,613 | ||
| 91. I. H. Knudson et al No. 1 I. H. Knudson | SW NW 33-9-20 | 11-5-1941 | 5,890 | 4,252 | 421 | 421 | 117 | 3,266 | 63,900 | 4,511 | |
| 92. I. H. Knudson et al No. 2 I. H. Knudson | NW NW 33-9-20 | 11-24-1941 | 11,450 | 115 | 101,200 | 11,174 | |||||
| 93. Gordon & Poole et al No. 1 I. H. Knudson | SE NW 33-9-20 | 1-17-1942 | 1,000 | ||||||||
| 95. J. W. Sherrod et al No. 1 Lange Estate | SW NE 33-9-20 | 9-26-1941 | 2,020 | 2,122 | 466 | 467 | 252 | 12,021 | 108,581 | 22,511 | |
| 96. McLaughlin & Sons No. 1 A. L. Bartlett | SW SW 33-9-20 | 4-16-1941 | 7,000 | DEAD | 468 | 109 | 75,097 | 385 | 0 | ||
| 97. McLaughlin & Sons No. 2 A. L. Bartlett | SE SW 33-9-20 | 5-21-1941 | 6,136 | 2.158 | 440 | 337 | 60,319 | 62,809 | 9,909 | ||
| 98. H. T. Wiedenman et al No. 1 A. L. Bartlett | NW SW 33-9-20 | 8-27-1941 | 7,000 | 4,045 | 437 | 340 | 18,900 | 26,611 | 2,525 | ||
| 99. J. W. Billingsley et al No. 1 A. L. Bartlett | NE SW 33-9-20 | 10-22-1941 | 1.900 | 759 | 400 | 412 | 195 | 1,877 | 21,850 | 1,764 | |
| 100. J. W. Longwell et al No. 1 A. L. Bartlett | NW SE 33-9-20 | 7-30-1941 | 5,458 | 2,422 | 482 | 342 | 110 | 37,367 | 49,236 | 6,846 | |
| 103. Aladdin No. 1 M. D. Edmonds SW SW | 34-9-20 | 7-26-1941 | 2,700 | 576 | 407 | 362 | 240 | 12,117 | 19,532 | 1,461 | |
| 121. McLaughlin & Sons No. 1 H. D. Ragan | NW NW 3-10-20 | 10-14-1940 | 4,960 | 583 | 491 | 354 | 116 | 60,988 | 19,214 | 2,676 | |
| 122. J. W. Longwell et al No. 1 W. H. Steenstry | NE NW 3-10-20 | 4-23-1941 | 1,190 | 759 | 471 | 325 | 128 | 19,258 | 23,393 | 1,983 | |
| 123. J. W. Longwell et al No. 2 W. H. Steenstry | SW NW 3-10-20 | 5-14-1941 | 16,839 | 4,294 | 467 | 307 | 104 | 117,717 | 113,138 | 18,126 | |
| 131. W.W. Stark et al No. 1 E. P. Dark (McLaugh.) | NW NW 4-10-20 | 10-15-1940 | 10,200 | 5,291 | 494 | 339 | 213,982 | 99,848 | 9,856 | ||
| 133. McLaughlin & Sons No. 2 fee | N2 NW 4-10-20 | 2-28-1941 | 4,000 | 1,155 | 400 | 342 | 12,560 | 31,464 | 5,226 | ||
| 134. McLaughlin & Sons No. 1 fee | NE NW 4-10-20 | 12-14-1939 | 8,500 | 1,712 | 470 | 344 | 109 | 37,821 | 54,332 | 7,905 | |
| 138. McLaughlin & Sons No. 1 E.P. Dark (McLaugh.) | SW NW 4-10-20 | 7-18-1940 | 13,700 | 9,029 | 491 | 103 | 309,345 | 139.368 | 23,713 | ||
| 141. Aladdin No. 1 H. B. Ragan | SE NE 4-10-20 | 6-25-1941 | 6,070 | 2,965 | 370 | 306 | 104 | 17,072 | 58,681 | 7,828 | |
| 146. Hatcher & Fisk No. 1 C. Kimmel | NE NW 5-10-20 | 11-20-1941 | 5,253 | 5,253 | 367 | 367 | 1,265 | 347,500 | 25,024 | ||
| 147. Hatcher & Fisk No. 2 C. Kimmel | NW NW 5-10-20 | 12-1-1941 | 617 | ||||||||
| 148. Hatcher & Fisk No. 3 C. Kimmel | SE NW 5-10-20 | 12-20-1941 | 13,686 | ||||||||
| 149. J. W. Longwell et al No. 1 D. E. Bower | NW NE 5-10-20 | 9-25-1941 | 15,100 | 14,368 | 395 | 355 | 99 | 39,041 | 182,614 | 28,193 | |
| 150. Aladdin No. 1 D. E. Bower | NE NE 5-10-20 | 6-8-1941 | 6,018 | 3,918 | 453 | 347 | 87,460. | 60,631 | 4,887 | ||
| 155. J. E. Sherrod et al No. 1 D. E. Bower | SW NE 5-10-20 | 6-2-1941 | 7,400 | 5,013 | 420 | 352 | 50,183 | 2,843 | 0 | ||
| 157. McLaughlin & Sons No. 2 E. P. Dark (Bower) | SE NE 5-10-20 | 8-7-1940 | 3,800 | 2,185 | 490 | 87,554 | 20,443 | ||||
| 159. Hatcher & Fisk No. 1 D. E. Bower | NE SW 5-10-20 | 4-29-1942 | 6,250 | 56,085 | 17,264 | ||||||
| 160. Hatcher. & Fisk No. 2 Henry Kimmel | SW SW 5-10-20 | 4-28-1942 | 4,500 | 47,546 | 13,188 | ||||||
| 161. Hatcher & Fisk No. 1 Henry Kimmel | SE SW 5-10-20 | 12-29-1941 | 800 | ||||||||
| 163. V-8 Drilling Co. No. 1 Bessie McLeod | NW SE 5-10-20 | 11-3-1941 | 7,600 | 7,536 | 350 | 77,141 | 3,011 | ||||
| 167. V-8 Drilling Co. No. 2 Bessie McLeod | SW SE 5-10-20 | 12-28-1941 | 3,000 | 345 | 116 | 44,227 | 11,521 | ||||
| 170. John B. Richard et al No. 1 Kate Sherman | NE NE 6-10-20 | 8- 7-1941 | 13,240 | 9,669 | 416 | 416 | 3,989 | 43,120 | 4,187 | ||
| 173. J. B. Synhorst et al No. 1 McLeod-Wisdom | N2 NW 8-10-20 | 11- 8-1941 | 19,029 | 19,029 | 400 | 429 | 110 | 16,394 | 260,827 | 26,296 | |
| 174. J. B. Synhorst et al No. 2 McLeod-Wisdom | SW NW 8-10-20 | 4-29-1942 | 6,000 | 137 | |||||||
| 175. Mosbacher, Kilness, et al No. 1 N. Vandruff | NE NW 8-10-20 | 9-20-1941 | 13,250 | 11,888 | 428 | 428 | 18,405 | 70,344 | 15,693 | ||
| 176. J. E. Sherrod et al No. 1 Alvin Means | NE NE NW 8-10-20 | 1-14-1942 | 7,500 | 34,300 | 3,625 | ||||||
| Total | 1,639,618 | 2,787,808 | 489,128 | ||||||||
| Total of pool to April 1, 1943 | 4,916,554 | ||||||||||
| * Production from St. Louis limestone. ** Production from Spergen limestone |
|||||||||||
| North McLouth Pool | |||||||||||
| 17. Miller & Mosbacher No. 1 Rachel Edmonds | SE SW 16-9-20 | 7-14-1942 | 10,100 | 97,874 | 32,361 | ||||||
| 19. Anderson & Bradley No. 1 Rachel Edmonds | SW SW 16-9-20 | 4,344 | 66.538 | 18,317 | |||||||
| 20. Hatcher & Fisk No. 1 Tabor Edmonds | SW SE 16-9-20 | 5,100 | 460 | 13,276 | 5,182 | ||||||
| 24. Ray Anderson et al No. 2 May Dick | NE SW 17-9-20 | 6-24-1942 | 1,500 | 500 | 7.575 | 16,104 | |||||
| 27. E. V. Jackson et al No. 2 Bank of McLouth | SE NW 20-9-20 | 7-22-1942 | 1,200 | 450 | 2,934 | 4.200 | |||||
| 29. T. Fred Hodge No. 1 M. M. Zachariah | SW NE 20-9-20 | 11-20-1942 | 3,790 | 246 | 122 | 8,665 | 15.252 | ||||
| 31. Ward Schooler et al No. 1 M. M. Zachariah | NE NE 20-9-20 | 6,386 | 500 | 122 | 278,265 | 32,816 | |||||
| 32. Ward Schooler et al No. 2 M. M. Zachariah | SW NE 20-9-20 | 8,200 | |||||||||
| 33. Hatcher & Fisk No. 1 W. N. Schwinn | SE SW 20-9-20 | 500 | 511 | 5.156 | |||||||
| 34. Hatcher & Fisk No. 1 M. Hesse | NE SE 20-9-20 | 7-1-1942 | 2,750 | 475 | 42,252 | 7,081 | |||||
| 35. Hatcher & Fisk No. 4 M. Hesse | NW SE 20-9-20 | 11-24-1942 | 4,900 | 430 | 11,637 | 10,945 | |||||
| 37. Miller, Smythe et al No. 1 C. E. Todd | NE SE SE 20-9-20 | 11-24-1942 | 11,650 | 265 | 18.492 | 70,444 | |||||
| 38. Miller, Smythe et al No. 2 C. E. Todd. | E2 SW SE 20-9-20 | 2-3-1943 | 4,500 | ||||||||
| 40. Hatcher & Fisk No. 2 Elijah Edmonds | SW NW 21-9-20 | 6-14-1942 | 2.000 | 445 | 61,279 | 7,576 | |||||
| 41. Hatcher & Fisk No. 1 Ralph Edmonds | NE NW 21-9-20 | 4-29-1942 | 6,103 | 43.592 | 10,450 | ||||||
| 42. Hatcher & Fisk No. 2 Ralph Edmonds | SE NW 21-9-20 | 2-22-1943 | 2,400 | ||||||||
| 43. O. J. Connell No. 1 Russell Edmonds | SW NE 21-9-20 | 12-20-1941 | 2,800 | 502 | 116 | 44,992 | 8,106 | ||||
| 44. O. J. Connell No. 2 Russell Edmonds | NW NE 21-9-20 | 5,000 | 502 | 117 | 53,053 | 8,080 | |||||
| 46. Hatcher & Fisk No. 2 M. Hesse | NW SW 21-9-20 | 9-16-1942 | 11,700 | 436 | 114,395 | 56,104 | |||||
| 47. Hatcher & Fisk No. 3 M. Hesse | SW SW 21-9-20 | 10-7-1942 | 10,000 | ||||||||
| 65. Ray Anderson et al No. 1 McLeod-Wisdom | SW NW 29-9-20 | 8-4-1941 | 15,230 | 12,464 | 486 | 486 | 7,155 | 118,850 | 18,652 | ||
| 66. Ray Anderson et al No. 2 McLeod-Wisdom | NW NW 29-9-20 | 1-31-1942 | 1,500 | ||||||||
| 67. Ray Anderson et al No. 1 R. E. Costigan | NE NW 29-9-20 | 12-20-1941 | 14,000 | 141,453 | 11,082 | ||||||
| 68. Ray Anderson et al No. 1 Alvin Means | SE NW 29-9-20 | 9-20-1941 | 18,700 | 18,928 | 496 | 496 | 13,559 | 167,656 | 20,817 | ||
| 69. Miller No. 1 Fed. Land Bank | NE NW NE 29-9-20 | 12-20-1942 | 10,600 | 265 | 36,209 | ||||||
| 72. Hatcher & Fisk No. 1 J. W. Shrader | NW SW 29-9-20 | 12-2-1941 | 15,900 | 7,514 | 95,475 | 17,963 | |||||
| 73. Hatcher & Fisk No. 2 J. W. Shrader | NE SW 29-9-20 | 1-14-1942 | 1,500 | ||||||||
| 78. E. V. Jackson et al No. 1 A. Shoemaker | SE SW 29-9-20 | 10-1-1941 | 1,070 | 1,659 | 477 | 477 | 52.501 | 6,531 | |||
| Total | 28,228 | 1,441,265 | 419,428 | ||||||||
| Total of pool to April 1, 1943 | 1,888,921 | ||||||||||
| Ackerland Pool | |||||||||||
| 114. V. W. McKnabe et al No. 1 R. B. Kessinger | NW SW 1-10-20 | 11- 9-1942 | 724 | 280 | 1,707 | ||||||
| 115. Ward Schooler et al No. 1 L. H. Schmidt | NE SW 1-10-20 | 7-2-1942 | 3,220 | 472 | 136 | 34,867 | 9,712 | ||||
| 116. McLaughlin & McNerney No. 1 L. H. Schmidt | SE SW 1-10-20 | 7-28-1942 | 1,260 | 460 | 13,316 | 5,699 | |||||
| 117. Miller, Cross et al No. 1 J. W. Bell | NW SE 1-10-20 | 6-6-1942 | 5,856 | 131 | 114,900 | 42,230 | |||||
| 118. Miller, Cross et al No. 2 J. W. Bell | SW SE 1-10-20 | 7- 8-1942 | 900 | ||||||||
| 119. Miller, Cross et al No. 3 J. W. Bell | E2 SE 1-10-20 | 9-19-1942 | 4,200 | ||||||||
| 180. W.T. McNerney et al No. 1 Fed. L. Bk. (Watson) | NE NW 12-10-20 | 6-11-1942 | 3,500 | 465 | 150 | 31,687 | 7,943 | ||||
| 182. E. W. Mosbacher et al No. 1 J. Bell Estate | NW NE NE 12-10-20 | 10-28-1941 | 1,036 | 1,036 | 470 | 474 | 14,968 | 0 | |||
| 191. Charles E. Miller et al No. 1 J. A. Bell | NW NW NW 7-10-21 | 2-23-1943 | 3,100 | 389 | 198 | 2,139 | |||||
| Total | 0 | 209,738 | 69,430 | ||||||||
| Total of pool to April 1, 1943 | 279,168 | ||||||||||
| Total of all pools by years | 1,667,846 | 4,438,811 | 977,986* | ||||||||
| Grand total all pools to April 1, 1943 | 7,084,643† | ||||||||||
| * Total production of gas from all pools during year 1943 to Dec. 22 including production from 1 well in new pool discovered in August. 1943 was 2,534,973 M. cubic feet. † Total production of gas from all pools to Dec. 22. 1943 was 8,667,516 M. cubic feet. |
|||||||||||
| Production by Counties | |||||||||||
| Jefferson County | 1,457,766 | 4,030,005 | 864,055 | 6,351,826 | |||||||
| Leavenworth County | 210,080 | 408,806 | 113,931 | 732,817 | |||||||
The most productive well in the field, the McLaughlin No. 1 Dark well in the SW NW sec. 4, T. 10 S., R. 20 E., was one of the first four wells put in production. It had a reported initial open flow of 13.7 million cubic feet of gas per day. To April 1, 1943, it had yielded a total of 472.426 million cubic feet in 24 1/2 months. The McLaughlin No. 2 Dark well, in the SE NE sec. 5 ,T. 10 E., R. 20 E., offsetting the No. 1 Dark well on the west, had an initial open flow of 3.8 million cubic feet per day. It was connected with the pipe line at the same time as the No. 1 Dark well, but had made only 108 million cubic feet at the time it was taken off production in January, 1943, after 22 months. Both of the Dark wells border an area in which the McLouth sand is impervious. The No. 2 Dark well probably penetrated the sand in the area of transition between the areas of coarsely porous and impervious sand. The position of the V-8 Drilling Company No. 2 McLeod well, in the SW SE sec. 5, T. 10 S., R. 20 E., in relation to the area of impervious sand is similar to that of the No. 2 Dark well. It was not completed until nearly 11 months after the Dark wells. The original open flow was reported as 3 million cubic feet of gas per day. In the 13 1/2 months prior to April 1, 1943, this well had made only 55.748 million cubic feet but was still yielding gas at the rate of nearly 4 million cubic feet of gas per month or about the average rate of production for the first year.
The Anderson No. 1 Woodhead well, in the NE SW sec. 32, T. 9 S., R. 20 E., is an edge well on the northwest side of the McLouth pool. It was completed 5 months after production began in the pool. Its initial open flow was reported at 13.0 million cubic feet per day. In 20 months prior to April 1, 1943, this well had made a total of 176 million cubic feet. The offset well to the north was dry. The offset to the east, the Longwell No. 1 Brose well, yielded a total of only 14 million cubic feet of gas and was abandoned. The offset well to the south, the Magnolia No. 1 Myers, completed 4 months after the Woodhead well, had a reported initial open flow of only 7.6 million cubic feet of gas per day but had yielded a total of 206 million cubic feet of gas to April 1, 1943. The diagonal offset to the southwest, the Hatcher and Fisk No. 1 Myers well, had a reported initial open flow of 3.7 million cubic feet per day, but in 19 months prior to April 1, 1943, it had yielded a total of only 34.7 million cubic feet of gas.
Similar relations exist in sec. 3, T, 10 S., R. 20 E., where the Longwell No. 2 Steenstry well, in the SW NW sec. 3, which had a reported initial open flow of 16.8 million cubic feet, had yielded 24.9 million cubic feet of gas to April 1, 1943. The offset well to the north, the McLaughlin No. 1 Ragan well, in the NW NW sec. 3, which had been completed and put on production a few weeks earlier, was gauged at 4.9 million cubic feet per day, and on April 1, 1943, had yielded 82 million cubic feet of gas. This production is approximately in proportion to the original open flow of the Longwell No. 2 Steenstry well, but the Longwell No. 1 Steenstry well, the diagonal offset to the northeast which had an initial open flow of 1.2 million cubic feet per day, had a yield to April 1, 1943, of only 44.6 million cubic feet of gas. The production from this well is greater in proportion to its initial open flow than the No. 1 Ragan or No. 2 Steenstry wells. Similar contrasts in productivity occur in all parts of the field.
Figure 17—Map of northeastern Kansas showing thickness of Mississippian limestones and approximate distribution of Mississippian formations on pre-Pennsylvanian surface. Lines connecting points of equal thickness are drawn at 50-foot intervals.
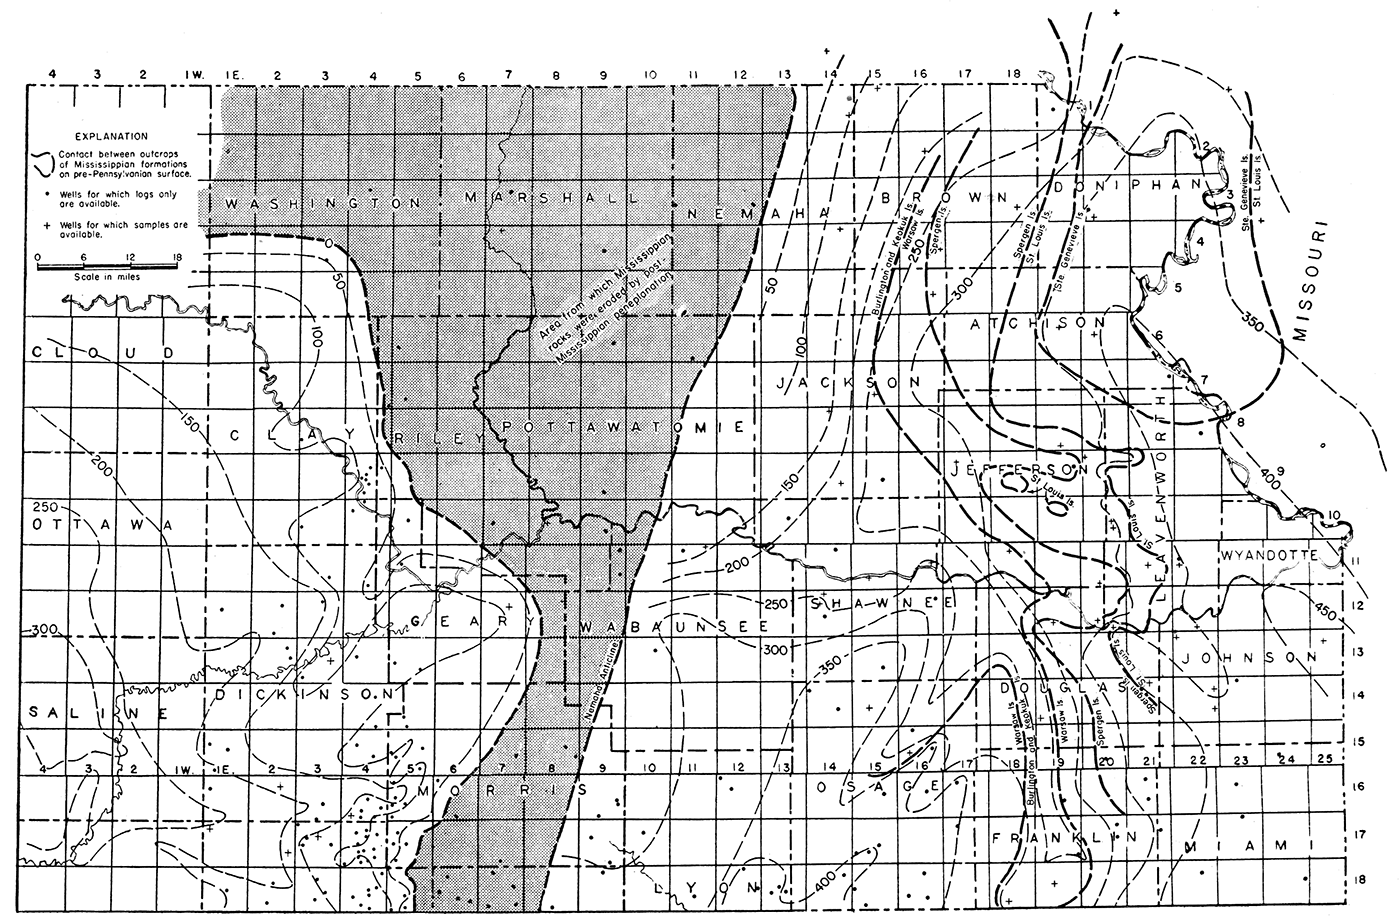
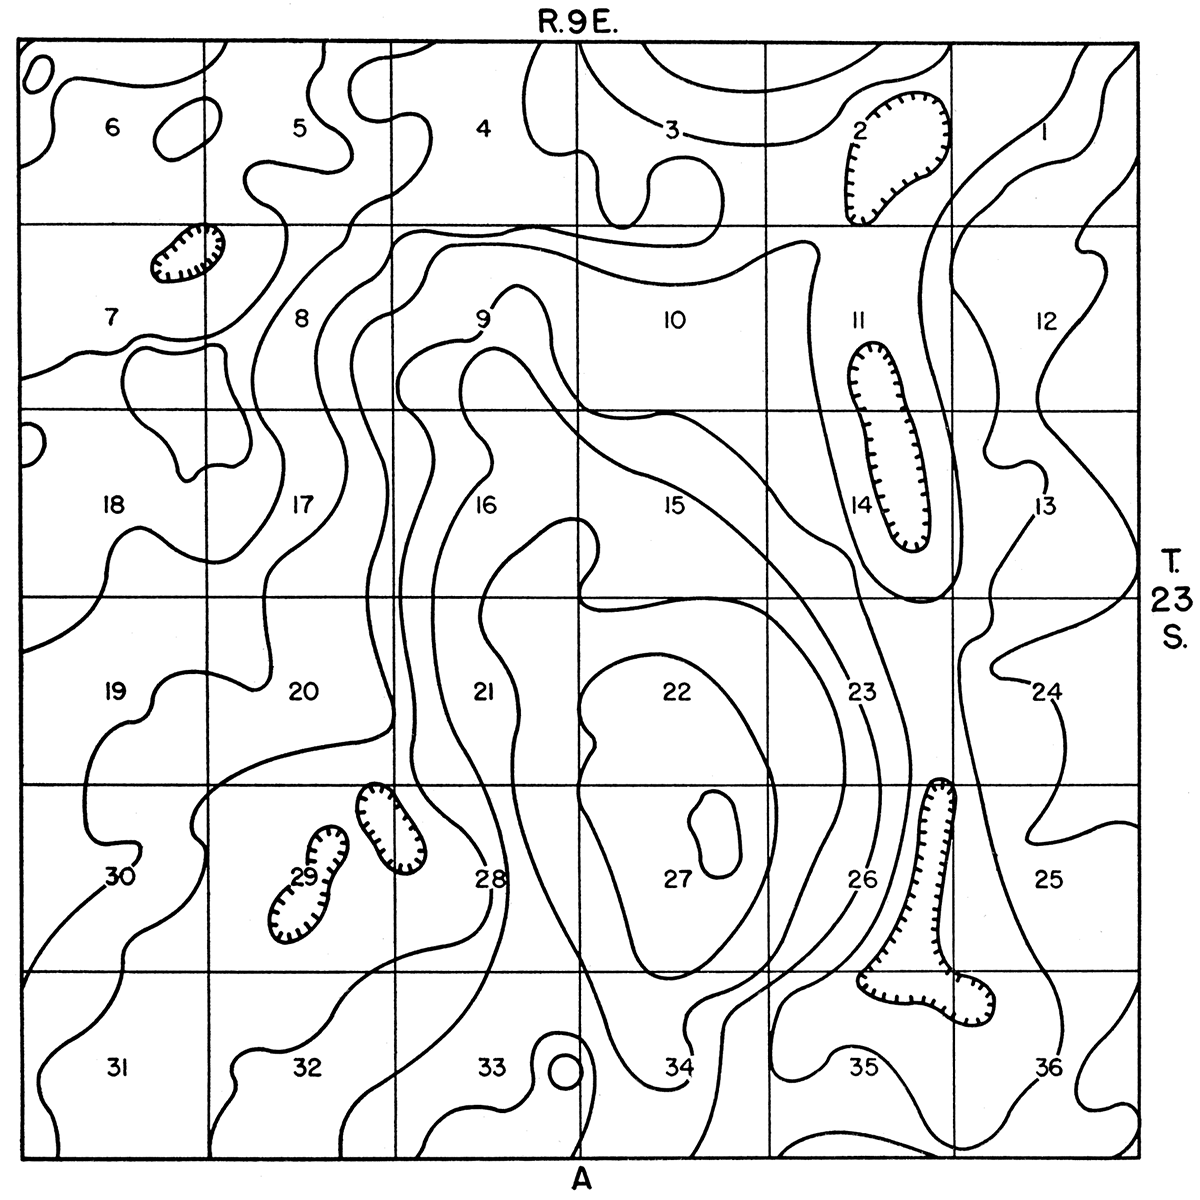
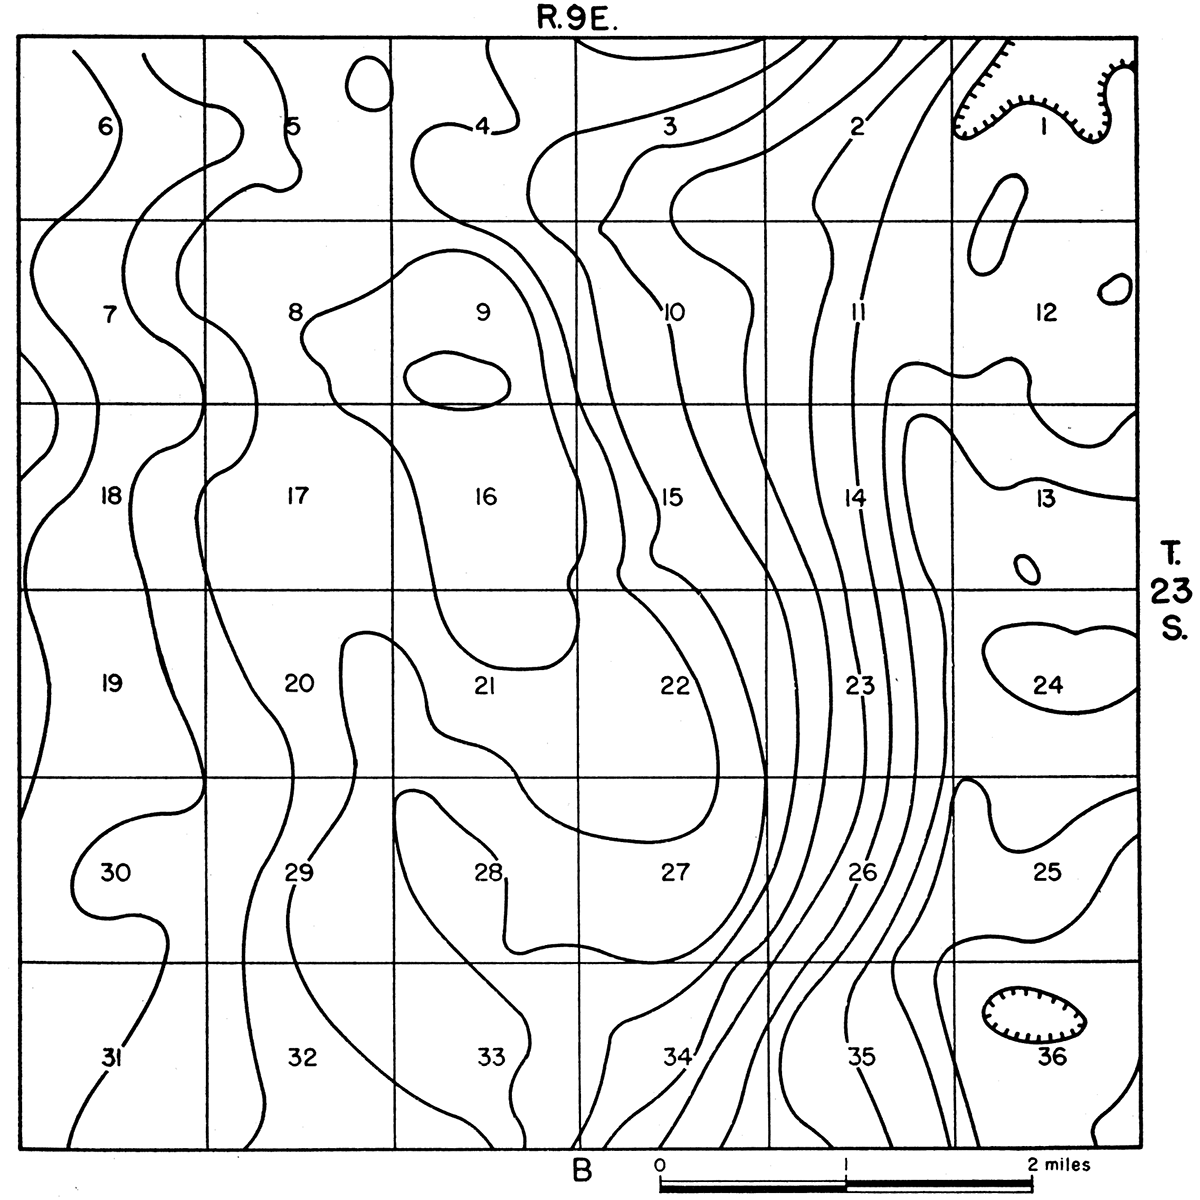
Figure 18—Maps showing shifting of the crest of an anticline contoured on surface rocks in Greenwood county, Kansas, before and after elimination of the regional dip of 26 feet per mile. After John L. Rich (1935), republished by permission of the American Association of Petroleum Geologists.
The crest of the anticline in its original attitude was in section 9 (figure B). The regional dip shifted the position of the crest to section 2.1 (figure A), a distance of nearly 3 miles.
Contour interval, 10 feet. The map as originally published does not show altitudes of contour lines.
Pressures
The average original pressure in the McLouth field in the first four wells connected to the A and B Pipe Line Company gathering line was 490 pounds per square inch. The initial closed pressure of each well for which the information is available is shown in table 9 and chronologically in figure 20. The initial pressures of the wells thus shown are local pressures at the time each well was completed. There was in every case a lag behind the decline of pressures of wells already in production. The lag was dependent on the distance to producing wells, on the length of time the earlier wells had been on production, on the amount of gas already drawn from earlier wells, and on the porosity and continuity of the intervening sand bodies.
As was to be expected, wells that extended the pools several locations revealed initial pressures above the pressures near earlier wells but below the original pressure in the pool. Thus, the Anderson No. 1 Woodhead well, in the NE SW sec. 32, T. 9 S., R. 20 E., which was drilled 5 months after the pool was put, on production and extended the pool three-quarters of a mile, showed a closed pressure of 450 pounds per square inch. However, the Sherrod No. 1 Bower well, in the SW NE sec. 5, T. 10 S., R. 20 E., which was drilled a month earlier and offsetting one of the original wells, had an initial closed pressure of only 420 pounds per square inch, 30 pounds less than the more distant Woodhead well.
The lag was greater than the average in areas where the intervening sands are relatively less permeable or where the gas comes from partly detached bodies of porous sand. The Sherrod No. 1 Lange Estate well, in the SW NE sec. 33, T. 9 S., R. 20 E., was drilled 8 months after production began and was nearer producing wells than the Anderson No. 1 Woodhead well, but its original closed pressure was 466 pounds per square inch. The initial pressure of the Woodhead well, drilled only 5 months after production started and at a greater distance from producing wells, was only 450 pounds per square inch.
Wells that had been drilled before November, 1941, were gauged by the State Corporation Commission and the closed pressure of each well was determined. No other pressures, except on new wells, were determined until April 27, 1943, when the compressor plant of the A and B Pipe Line Company was shut down for repairs for several days. During this period the wells connected to this pipe line were shut in and on April 27 and 28 the closed pressure of many of the wells was taken. The pressures taken by the Corporation Commission and by the A and B Pipe Line Company have been plotted on the chart in the appropriate place and provide the data for determining the pressure decline for a number of wells.
McLouth pool—The available pressures for the McLouth pool (table 9 and fig. 20) show that there was a wide variation in the closed pressure of wells at the time they were drilled and much variation in pressure in November, 1941, owing to lag in equalization of pressures. By April, 1943, however, the pressure of most wells had equalized. The pressures of 12 of the 16 wells gauged in that month were between 99 and 117 pounds. The maximum difference in the pressures of these wells was only 10 pounds below and 8 pounds above the average of 109 pounds. The special conditions in the four wells not included in the average explain the failure of pressures in these wells to equalize with pressures in other parts of the pool. Two of these wells, the Sherrod No. 1 Lange Estate well, in the SW NE sec. 33, T. 9 S., R. 20 E., and the Longwell No. 1 Bartlett well, in the NW SE of the same section, were completed with higher pressures than the average on the date drilled. These wells are diagonal offsets of each other. The decline of pressure in these wells shows the same decline curve as the average of the field, but their pressures have remained consistently higher than other wells on the same date. There has not been any equalization of pressures with other parts of the field nor between these two wells. Examination of the logs of these wells indicates that both of these wells yield most of the gas from a sandy zone which is higher than the producing sand bodies in neighboring wells. Therefore, the pressures in these wells probably have not equalized with the pressures in other parts of the field because the producing sand bodies are at least partly cut off from the rest of the pool by less permeable zones of the sand.
The other two. wells showing anomalous pressures also offset each other. The Aladdin No. 1 Edmonds well, in the SW SW sec. 34, T. 9 S., R. 20 E., is an edge well. It encountered a small amount of oil as well as gas. The accumulation of oil in the hole has interfered with the regular flow of gas and this has probably retarded the pressure decline in the area drained. The other well, the Longwell No. 1 Steenstry well, is a southeast diagonal offset of the Edmonds well. Its pressure is only 19 pounds per square inch above the average in other parts of the pool. The lag in equalization may reasonably be attributed to the influence of the Edmonds well and to the presence of an undrilled marginal area to the north and east.
In the calculations of ultimate production (table 10) the lag in pressure decline in these wells has been disregarded because the production is small, except in the Lange well, and the production of that well, although considerable, is small with respect to that of the whole pool.
North McLouth pool—Fewer closed pressures have been taken in the North McLouth pool than in the McLouth pool, but those wells which have been tested on more than one date indicate a pressure decline conforming closely to the decline gradient in the McLouth pool. The initial closed pressure of the first wells drilled was 501 pounds per square inch, 11 pounds higher than the initial pressure in the McLouth pool. In April, 1943, the average closed pressure of four wells tested was 119 pounds per square inch. Although the data are less complete, it is probable that the average indicates a close approximation to pressures in other wells in the pool at the same date.
Ackerland pool—In April, 1943, the Ackerland pool was much smaller than the other two pools in the field. The area of production is seemingly already outlined by drilling, but extensions of this pool may yet be developed. Inasmuch as some of the wells in this pool are of relatively recent date and as the porosity and occurrence of the sand bodies is more variable than in the other pools, the pressures of the wells have not yet equalized. The initial closed pressure of the Ackerland pool was 470 pounds per square inch (table 9 and fig. 20). The average pressure of the three wells in this pool which were gauged on April 27, 1943, was 139 pounds per square inch. There is a wider spread in the pressures of this date than in the other pools, as may be noted on the chart.
Estimates of Ultimate Gas Production
Table 10 shows the production of gas from each of the three pools in the field as determined from the pipe-line runs of the two companies purchasing gas in the field. Volumes are calculated at 2 pounds above atmospheric pressure and at a temperature of 60° F. The total volume of recoverable gas in each pool has been calculated by Boyles law according to the formula
(P - p) / p1 × V1 = V
where P = the original closed pressure in the pool, p = the closed pressure at which production will be discontinued, p1 = the closed pressure decline at a given date, V1 = the cumulative volume of gas produced to the same date, and V = ultimate production of the pool.
Table 10—Production of gas in the McLouth field by pools to April 1, 1943, calculated ultimate and future production, number of wells in each pool, and ultimate average production per acre.
| Pool | Cumulative production to April 1, 1943, M cu ft. |
Calculated ultimate production of gauge pressure of 10 lbs. per cu. feet, M cu ft. |
Calculated future production after April 1, 1943, at gauge pressure of 10 lbs. per cu. feet, M cu ft. |
Number of acres developed |
Total ultimate average production per acre, M cu ft. |
|---|---|---|---|---|---|
| McLouth | 4,916,554.0 | 6,361,040.2 | 1,444,486.2 | 25701 | 2,475.1 |
| North McLouth | 1,888,921.0 | 2,427,906.0 | 538,985.0 | 12202 | 1,990.1 |
| Ackerland | 279,168.0 | 387,967.6 | 108,799.6 | 4403 | 881.7 |
| Total | 7,084,643.0 | 9,176,913.8 | 2,092,270.8 | 42304 | 2,122.2 |
| 1 Includes 170 acres yielding oil and gas; excludes 180 acres yielding oil only. 2 Excludes 120 acres yielding oil only. 3 Excludes 80 acres yielding oil only. 4 Includes all areas yielding gas. |
|||||
Although the pressure at which it will become unprofitable to take gas from the pools is not now determinable, the abandonment of production has been assumed to be at a pressure of 10 pounds per square inch. Gas is being produced from many wells in eastern Kansas at lower pressures where the distributing lines maintain a low pressure; because of the high pressures maintained in the Cities Service line to which the McLouth field is tributary, it is possible that the assumed end point of 10 pounds per square inch is too low. Table 10 shows the production to April 1, 1943, the calculated ultimate production, and the estimated future production of each pool.
The estimates of future production are probably more accurate for the McLouth pool than for either of the others because in that pool more decline pressures have been taken and because a greater equalization of pressures in different parts of the pool has taken place. The estimates for the Ackerland pool are least satisfactory because the equalization of pressures has not yet overcome the lag in the more recent wells. The possibility that this pool may be extended into areas where the pressures have not yet declined to the average pressure used in the calculation also casts doubt on the accuracy of the estimates.
The pressure decline in the McLouth field has been more rapid than in many gas fields. The absence of water drive in holding up pressures in the structurally higher parts of the pools is probably responsible in large part for the rapid decline. The absence of water in the productive sands, however, has made it possible, under stress of war demands, to draw on the pool more rapidly without damage from water encroachment than would have been possible if water advanced into sand with declining pressures.
Relation of Pressure in the McLouth Gas Pools to Overburden
The causes underlying the variations in initial pressures encountered in the gas pools of the McLouth field and in many other gas fields are uncertain, but it is permissible to speculate on the phenomena without arriving at a final conclusion.
Initial closed pressures of gas pools commonly are roughly in proportion to the depth of the reservoir rock below the surface, and the initial closed pressures of many pools approximate the hydrostatic head corresponding to the thickness of the overlying rocks. Initial closed pressures in gas pools, however, although in some cases greater than the hydrostatic head determined by the depth of the well, are generally somewhat less (Lilley, 1928). In this respect the low pressures of the McLouth field are not unusual.
The initial closed pressures of the three pools in the McLouth field, Ackerland, McLouth and North McLouth, were respectively 470, 490, and 501 pounds per square inch. The increase is in the direction of regional dip but this condition may not be significant. As shown in table 11, there appears to be no proportionate relation between the initial pressure of each pool and the overburden on the structural crest of the sand. Neither is there any proportionate relation between the pressures and the effective cover above the crest on other parts of the anticline. The hydrostatic head for these depths bears no relation to the actual initial pressures in the pools which were from 76 to 96 pounds per square inch lower than the minimum calculated hydrostatic heads for each pool.
Table 11—Relation of initial closed pressures to hydrostatic heads in pools of the McLouth field.
| Pool | Initial closed pressure, lbs. per sq. in. | Altitude of McClouth sand on structural crest | Minimum thickness of overburden in well drilled to McLouth sand | Altitude of well | Hydrostatic head in well on crest of McLouth sand, lbs. per sq. in. | Thickness overburden from lowest point on surface to crest of sand on anticline | Hydrostatic head from lowest point on surface to crest of sand on anticline, lbs. per sq. ft. |
|---|---|---|---|---|---|---|---|
| North McLouth | 501 | -360 | 1,348 | 969 | 584 | 1,329 | 576 |
| McLouth | 490 | -310 | 1,310 | 978 | 591 | 1,288 | 558 |
| Ackerland | 470 | -313 | 1,330 | 994 | 576 | 1,307 | 566 |
If the pressures when the pools were discovered were dependent on or roughly proportionate to the stratigraphic cover, they were not established under present conditions. If the thickness of cover or hydrostatic head determines the pressure, the pressures in the several pools must have been much greater at the end of the Permian when rocks at least 2,000 feet thick lay above the rocks now exposed. At that time the rocks overlying the McLouth sand were at least 3,500 feet thick, or more than twice the thickness of the present cover.
If an anticlinal reservoir had been completely sealed both against the escape of the gas transverse to the strata and against expansion in the reservoir sand (an improbable condition), the original pressures would be preserved during the erosion of the overburden and the pressures in the pools ("fossil pressures") would be disproportionately high for the reduced overburden. On the other hand, if the gas pressures in the reservoir had remained in balance as the overburden decreased, the excess gas must either have escaped transverse to the strata or expanded in the reservoir rock. In this case where the reservoir was sealed, the pressure in the reservoir would not fall below the pressure controlled by the thickness of the overburden or the hydrostatic head and would remain in balance with it. If the static pressure of the reservoir is expressed by the hydrostatic head, as some geologists have supposed, the pressures in the McLouth pools are below the pressures to be expected.
The McLouth field presents some features not known to be common in gas fields, although perhaps more common than generally recognized. The gas reservoirs are limited in volume by the tar and dried oil occupying the pores of the sandstone on the flanks of the anticlines, and the gas areas are thus sealed from the invasion of water farther down the dip and sealed against expansion into the gas sand. The pressures in the sand reservoir, therefore, might be expected to remain independent of the hydrostatic pressure exerted by the water in the sand.
The tar and dried oil must have entered the pores of the sand while still fluid, but it has been a long time since their volatile constituents escaped. If the desiccation occurred before the development of regional dip,the gas in the pools accumulated under an overburden having a thickness of 3,500 feet or more and its pressure should have been much greater than prevailed when the pools were drilled. Inasmuch as the pressures are lower than might be expected from the present depth, large quantities of gas must have escaped from the reservoirs charged to a pressure represented by such an overburden and large quantities of gas must have escaped also from the now desiccated oil. The gas did not expand into the reservoir sand inasmuch as the gas has not readjusted its position in the reservoir sand since the development of the post-Permian dip. It seems likely, therefore, that if gas escaped it must have escaped transverse to the overlying strata.
The variations in gas pressure in widely separated gas fields and the occasional observation of pressures in excess of the hydrostatic heads show that factors other than the depth of cover are involved. In the McLouth field and generally in eastern Kansas and many other regions, a detailed analysis of the structural history reveals abundant evidence of repeated structural movements. This is particularly evident in the McLouth field where there were differential structural adjustments throughout the Pennsylvanian and probably well into the Permian. These structural adjustments could not have occurred without a long series of earth shocks and more or less violent seismic tremors. During development of the post-Permian regional dip other vibrations must also have occurred. It may reasonably be supposed that these adjustments would be accompanied by phenomena similar to those of modern earthquakes and would include the temporary opening of crevices and fissures with the expulsion of water and at times gas, accompanied in many cases by only very small or no measurable rock displacements.
Under quiescent conditions, gas pressures might be built up in anticlinal reservoirs by the breaking down of source materials to a pressure in balance with the pressure exerted by the temporary overburden or by the temporary hydrostatic head. During subsequent periods of structural adjustment, part or all of the accumulated gas might be dissipated. Cycles of accumulation and release of gas pressures might continue theoretically as long as source materials continued to replenish the reservoir or until structural adjustments ceased. The exhaustion of sources of gas might prevent subsequent refilling of a reservoir to the limit of the controlling maximum pressure. In some areas where the source materials were exhausted, the reservoirs might be left barren after the escape of gas. The repeated release of accumulated pressures might result in some places in the lowering of the gravity of the oil remaining in the reservoir. Pressures below the local maximum determined by the overburden, as in most pools, might represent reservoirs not yet recharged. Pressures above the local maximum pressure might be preserved in places where erosion has reduced the overburden but where the excess pressure has not yet been released.
In the McLouth field, the final desiccation of the oil in the McLouth sand must have marked the end of regeneration of gas from this source. Some accessions of gas could have escaped into the reservoir sand from deeper oils that have not yet lost their volatile constituents but without building up the pressure to the controlling maximum at which the gas would either escape or remain in solution in the oil.
Oil Production
Table 12 shows that the cumulative production of oil in the McLouth field from all wells to April 1, 1943, was 175,879 barrels. The figures given in the table represent monthly sales rather than monthly production. During cold weather the oil from some of the wells is too viscous to flow. Oil from such wells is left in storage on the lease until weather conditions have moderated. Other wells show irregularities of sales owing to stoppage occasioned by cleaning out, acidizing, and mechanical difficulties connected with pumping. Under the circumstances the sales curves are unsuitable for showing production decline although no proration has been practiced. Neither the Mississippian dolomite, from which most of the oil is produced, nor the McLouth sand has any regularity of thickness or porosity by which ultimate production might plausibly be estimated by assuming a nominal production per acre. In consequence, no attempts have been made to determine the future production of the oil pools. It seems probable that considerably more oil will ultimately be produced than was produced before April 1, 1943.
McLouth Mississippian Oil Pool
The McLouth oil pool in Mississippian rocks covers an area of approximately 230 acres with 16 oil wells either producing or drilling on April 1, 1943. The cumulative production of the pool to that date was 125,142 barrels. Since April 1, 1943, several wells not listed in the production table have been completed which, after acidizing, are reported to yield from 50 to 150 barrels of oil per day. These wells when put on production together with wells completed earlier will probably raise the production to 800 or 1,000 barrels of oil per day.
Some indication of water encroachment has been detected in the Young and Longwell No. 4 McLeod well, in the SW NE SE sec. 5, T. 10 S., R. 20 E. This well, which was completed as an oil well in April, 1943, was drilled into water in the dolomite and was plugged back. The water was encountered at an altitude of -510, 9 feet higher than the water level in a well drilled on an adjoining lease to the south (the Apperson and Pundt No. 1 McLeod well) (fig. 11). This well and others drilled in 1941 found water in the dolomite at or near an altitude of -519. At the time the No. 4 McLeod well was drilled, the Young and Longwell No. 3 McLeod well, the nearest well up dip and the most productive well in the pool, had been on production 20 months and had yielded 49,000 barrels of oil. Other wells on the crest of the dome had abo yielded considerable oil. The unexpectedly high position of the water level in the No. 4 McLeod well seems to be plausibly attributed to water encroachment.
None of the wells in the McLouth oil pool have been abandoned except the Young and Longwell No. 1 McLeod well. This well, an edge well drilled through a tension fault, was drowned out by water after having yielded 4,296 barrels of oil. None of the oil wells in the McLouth pool yield commercial amounts of gas.
Bankers Life Pool
The Bankers Life pool in sec. 3, T. 10 S., R. 20 E. includes six wells yielding oil from the McLouth sand. The pool has a developed area of 130 acres. The cumulative production to April 1, 1943, was approximately 41,000 barrels. Production figures for individual wells were not kept separately, but the collective production has had a slow decline from 2,000 barrels to 1,600 barrels per month over a period of 21 months. In view of the history of some of the wells, it is probable that part of the lost production could be restored by cleaning out the wells. These wells make very little water and only enough gas to operate the pumps. The regularity of production of these wells implies that they may have a longer life than the more productive wells in the Mississippian rocks.
Scattered Wells
The scattered wells, of which there are six listed in the production table, yield small amounts of oil from the McLouth sand, but the total production is small. The cumulative production of all these wells, two of which had been on production less than two months, was 9,833 barrels. The Archie No. 1 Shrader well, in the SE SW sec. 28, T. 9 S., R. 20 E., although not pumped during the winter months, has not been abandoned.
In April, two gas wells in the North McLouth pool were deepened in the McLouth sand by the Magnolia Petroleum Company and are making a small production of oil. These wells are the Hatcher and Fisk No. 2 Elijah Edmonds well, in the SW NW sec. 21, T. 9 S., R. 20 E., and the Hatcher and Fisk No. 2 Ralph Edmonds well, in the SE NW of the same section.
Character and Origin of Gas and Oil
Analyses of Oil
Five Hempel analyses of oil from the McLouth field are presented in tables 13 to 17. Three of the samples are of oil from the McLouth sand, one from each of three pools. Two of the samples are of oil from the dolomite zone of the Mississippian limestone in the McLouth pool, one from a well on the crest of the pool and the other on the flank. These five analyses were made by J. G. Crawford in the laboratory of the U. S. Geological Survey at Casper, Wyoming, at barometric pressures averaging 630 mm. Three Hempel analyses of oil from the Falls City field in Richardson county, Nebraska, are presented in tables 18 to 20 for comparison. These analyses were made by the U.S. Bureau of Mines at Bartlesville, Oklahoma, at barometric pressures averaging 744 mm. Two of these samples are from Devonian limestone, one from the Falls City pool and the other from the Barada pool. The third sample is from the Kimmswick (= Viola limestone) of the Dawson pool.
Table 13—McLouth sand, McLouth oil and gas pool. Hempel analysis of crude oil in the Longwell et al. No, 1 Bankers Life (Fred McLeod) well, NW SW sec, 3, T,10 S., R, 20 E., Leavenworth county, Kansas. Depth 1,438 to 1,450 feet. (Analysis by J. G. Crawford, Geol. Sur., Dept. of Interior, Casper, Wyo.)
| General Characteristics | ||||
|---|---|---|---|---|
| Specific Gravity | 0.905 | A.P.I. Gravity | 24.9° | |
| Percent Sulphur | 0.75 | Pour point | 5° F. | |
| Color | Black | |||
| Saybolt Universal Viscosity at 100° F., 424 sec. | ||||
| Distillation, Bureau of Mines, Hempel Method | |||||||||
|---|---|---|---|---|---|---|---|---|---|
| Fraction No. |
Temp., °C |
Percent Cut |
Sum percent |
Sp. Gr. of cut 60/60° F |
°A.P.I. of cut 60° F |
C.I. | S.U. Viscosity at 100° F |
Cloud test° F |
Temp., °F |
| Dry Distillation; Barometer, 634 mm; First Drop, 86° C. (187° F.) | |||||||||
| 1 | Up to 50 | Up to 122 | |||||||
| 2 | 50-75 | 122-167 | |||||||
| 3 | 75-100 | 0.8 | 0.8 | .747 | 57.9 | 167-212 | |||
| 4 | 100-125 | 2.1 | 2.9 | 212-257 | |||||
| 5 | 125-150 | 2.5 | 5.4 | 257-302 | |||||
| 6 | 150-175 | 3,3 | 8.7 | .754 | 56.2 | 16 | 302-347 | ||
| 7 | 175-200 | 4.5 | 13.2 | .763 | 54.0 | 14 | 347-392 | ||
| 8 | 200-225 | 5.1 | 18.3 | .774 | 51.3 | 13 | 392-437 | ||
| 9 | 225-250 | 5,8 | 24.1 | .786 | 48.5 | 14 | 437-482 | ||
| 10 | 250-275 | 9.1 | 33.2 | .802 | 44.9 | 16 | 482-527 | ||
| Vacuum distillation at 40 mm | |||||||||
| 11 | Up to 200 | 0.1 | 0.1 | .843 | 36.4 | 27+ | 45 | 30 | Up to 392 |
| 12 | 200-225 | 4.7 | 4.8 | 392-437 | |||||
| 13 | 225-250 | 4.1 | 8.9 | .858 | 33.4 | 30 | 52 | 45 | 437-482 |
| 14 | 250-275 | 3.8 | 12.7 | .877 | 29.9 | 36 | 69 | 60 | 482-527 |
| 15 | 275-300 | 6.2 | 18.9 | .895 | 26.6 | 42 | 115 | 75 | 527-572 |
| Carbon residue of residuum, 20.2 percent; carbon residue of crude, 10.3 percent. | |||||||||
| Approximate Summary | ||||
|---|---|---|---|---|
| Percent | Sp. Gr. | °A.P.I. | Viscosity | |
| Light gasoline | 0.8 | |||
| Total gasoline and naphtha | 13.2 | .754 | 56.2 | |
| Kerosene distillate | 20.0 | .790 | 47.6 | |
| Gas-oil | 5.6 | .844 | 36.2 | Below 50 |
| Nonviscuous lubricating distillate | 8.6 | .854-.889 | 34.2-27.7 | 50-100 |
| Medium lubricating distillate | 4.7 | .889-.906 | 27.7-24.7 | 100-200 |
| Viscous lubricating distillate | ||||
| Residuum | 46.0 | 1.019 | ||
| Distillation loss | 1.9 | |||
| Base, Paraffin—intermediate. | ||||
Table 14—McLouth sand, North McLouth oil and gas pool. Hempel analysis of crude oil in the Ray Anderson No. 1 May Dick well, SE SW sec. 17, T. 9 S., R. 20 E., Jefferson county, Kansas, Depth 1,464 to 1,479 feet. (Analysis by J. G. Crawford, Geol. Sur., Dept, of Interior, Casper, Wyo.)
| General Characteristics (Dehydrated oil) | ||||
|---|---|---|---|---|
| Specific Gravity | 0.924 | A.P.I. Gravity | 21.6° | |
| Percent Sulphur | 0.99 | Pour point | 10° F. | |
| Color | Black | |||
| Saybolt Universal Viscosity at 100° F., 2160 sec. | ||||
| Distillation, Bureau of Mines, Hempel Method (Dehydrated oil) | |||||||||
|---|---|---|---|---|---|---|---|---|---|
| Fraction No. |
Temp., °C |
Percent Cut |
Sum percent |
Sp. Gr. of cut 60/60° F |
°A.P.I. of cut 60° F |
C.I. | S.U. Viscosity at 100° F |
Cloud test° F |
Temp., °F |
| Dry Distillation; Barometer, 622 mm; First Drop, 93° C. (199° F.) | |||||||||
| 1 | Up to 50 | Up to 122 | |||||||
| 2 | 50-75 | 122-167 | |||||||
| 3 | 75-100 | 0.5 | 0.5 | .744 | 58.7 | 167-212 | |||
| 4 | 100-125 | 1.7 | 2.2 | 212-257 | |||||
| 5 | 125-150 | 2.4 | 4.6 | 257-302 | |||||
| 6 | 150-175 | 3.3 | 7.9 | .750 | 57.2 | 14 | 302-347 | ||
| 7 | 175-200 | 4.2 | 12.1 | .761 | 54.4 | 13 | 347-392 | ||
| 8 | 200-225 | 4.5 | 16.6 | .773 | 51.6 | 13 | 392-437 | ||
| 9 | 225-250 | 5.9 | 22.5 | .787 | 48.3 | 14 | 437-482 | ||
| 10 | 250-275 | 8.2 | 30.7 | .802 | 44.9 | 16 | 482-527 | ||
| Vacuum distillation at 40 mm | |||||||||
| 11 | Up to 200 | Up to 392 | |||||||
| 12 | 200-225 | 4.3 | 4.3 | .843 | 36.4 | 27 | 45 | 35 | 392-437 |
| 13 | 225-250 | 4.4 | 8.7 | .859 | 33.2 | 31 | 53 | 45 | 437-482 |
| 14 | 250-275 | 6.0 | 14.7 | .884 | 28.6 | 40 | 80 | 65 | 482-527 |
| 15 | 275-300 | 11.4 | 26.1 | .900 | 25.7 | 44 | 116 | 80 | 527-572 |
| Carbon residue of residuum, 21.3 percent; carbon residue of crude, 9.8 percent. | |||||||||
| Approximate Summary | ||||
|---|---|---|---|---|
| Percent | Sp. Gr. | °A.P.I. | Viscosity | |
| Light gasoline | 0.5 | |||
| Total gasoline and naphtha | 12.1 | .752 | 56.7 | |
| Kerosene distillate | 18.6 | .790 | 47.6 | |
| Gas oil | 5.0 | .844 | 36.2 | Below 50 |
| Nonviscous lubricating distillate | 11.5 | .853-.893 | 34.4-27.0 | 50-100 |
| Medium lubricating distillate | 9.6 | .893-.910 | 27.0-24.0 | 100-200 |
| Viscous lubricating distillate | ||||
| Residuum | 41.6 | 1.047 | ||
| Distillation loss | 1.6 | |||
| Base, Paraffin—intermediate. | ||||
Table 15—Basal McLouth sand, Ackerland oil and gas pool. Hempel analysis of crude oil in the Miller No. 1 Jeannin well, NE NW sec. 7, T. 10 S., R. 21 E., Leavenworth county, Kansas. Depth 1,386 to 1,414 feet. (Analysis by J. G, Crawford, Geol. Sur., Dept, of Interior, Casper, Wyo.)
| General Characteristics | ||||
|---|---|---|---|---|
| Specific Gravity | 0.907 | A.P.I. Gravity | 24.50 | |
| Percent Sulphur | 0.86 | Pour point Below | 5° F. | |
| Color | Black | |||
| Saybolt Universal Viscosity at 100° F., 427 sec.; (at 70° F., 975 sec.) | ||||
| Distillation, Bureau of Mines, Hempel Method | |||||||||
|---|---|---|---|---|---|---|---|---|---|
| Fraction No. |
Temp., °C |
Percent Cut |
Sum percent |
Sp. Gr. of cut 60/60° F |
°A.P.I. of cut 60° F |
C.I. | S.U. Viscosity at 100° F |
Cloud test° F |
Temp., °F |
| Dry Distillation; Barometer, 627 mm; First drop, 89° C. (192° F.) | |||||||||
| 1 | Up to 50 | Up to 122 | |||||||
| 2 | 50-75 | 122-167 | |||||||
| 3 | 75-100 | 0.8 | 0.8 | .746 | 58.2 | 167-212 | |||
| 4 | 100-125 | 1.7 | 2.5 | 212-257 | |||||
| 5 | 125-150 | 2.2 | 4.7 | 257-302 | |||||
| 6 | 150-175 | 2.8 | 7.5 | .753 | 56.4 | 15 | 302-347 | ||
| 7 | 175-200 | 4.2 | 11.7 | .761 | 54,4 | 13 | 347-392 | ||
| 8 | 200-225 | 5.6 | 17.3 | .771 | 52.0 | 12 | 392-437 | ||
| 9 | 225-250 | 6.2 | 23.5 | .785 | 48.8 | 13 | 437-482 | ||
| 10 | 250-275 | 7.6 | 31.1 | .799 | 45.6 | 15 | 482-527 | ||
| Vacuum distillation at 40 mm | |||||||||
| 11 | Up to 200 | Up to 392 | |||||||
| 12 | 200-225 | 5.0 | 5.0 | .840 | 37,0 | 25 | 45 | 30 | 392-437 |
| 13 | 225-250 | 4.2 | 9.2 | .855 | 34.0 | 29 | 51 | 40 | 437-482 |
| 14 | 250-275 | 4.2 | 13.4 | .876 | 30.0 | 36 | 68 | 60 | 482-527 |
| 15 | 275-300 | 4.4 | 17.8 | .894 | 26.8 | 41 | 109 | 75 | 527-572 |
| Carbon residue of residuum, 20,0 percent; carbon residue of crude, 10.5 percent. | |||||||||
| Approximate Summary | ||||
|---|---|---|---|---|
| Percent | Sp. Gr. | °A.P.I. | Viscosity | |
| Light gasoline | 0.8 | |||
| Total gasoline and naphtha | 11.7 | .753 | 56.4 | |
| Kerosene distillate | 19.4 | .786 | 48.5 | |
| Gas oil | 6.3 | .842 | 36.6 | Below 50 |
| Nonviscous lubricating distillate | 8.4 | .852-.890 | 34.6-27.5 | 50-100 |
| Medium lubricating distillate | 3.1 | .890-.903 | 27.5-25.2 | 100-200 |
| Viscous lubricating distillate | ||||
| Residuum | 48.0 | 1.017 | ||
| Distillation loss | 3.1 | |||
| Base, Paraffin—intermediate. | ||||
Table 16—Mississippian dolomite, McLouth oil and gas pool. Hempel analysis of crude oil in the Young and Longwell No. 3 Bessie McLeod well, NE SE sec, 5, T. 10 S., R. 20 E., Jefferson county, Kansas, Depth 1,635 to 1,644 feet, (Analysis by J. G. Crawford, Geol. Sur., Dept. of Interior, Casper, Wyo.)
| General Characteristics | ||||
|---|---|---|---|---|
| Specific Gravity | 0.912 | A.P.I. Gravity | 23.70 | |
| Percent Sulphur | 0.77 | Pour point | 5° F. | |
| Color | Black | |||
| Saybolt Universal Viscosity at 100° F., 695 sec. B.S., mud and water (by centrifuge) |
||||
| Distillation, Bureau of Mines, Hempel Method | |||||||||
|---|---|---|---|---|---|---|---|---|---|
| Fraction No. |
Temp., °C |
Percent Cut |
Sum percent |
Sp. Gr. of cut 60/60° F |
°A.P.I. of cut 60° F |
C.I. | S.U. Viscosity at 100° F |
Cloud test° F |
Temp., °F |
| Dry Distillation; Barometer, 635 mm; First Drop, 83° C. (181° F.) | |||||||||
| 1 | Up to 50 | Up to 122 | |||||||
| 2 | 50-75 | 122-167 | |||||||
| 3 | 75-100 | 0.7 | 0.7 | .741 | 59.5 | 167-212 | |||
| 4 | 100-125 | 1.6 | 2.3 | 212-257 | |||||
| 5 | 125-150 | 2.3 | 4.6 | 257-302 | |||||
| 6 | 150-175 | 3.3 | 7.9 | .756 | 55.7 | 17 | 302-347 | ||
| 7 | 175-200 | 4.3 | 12.2 | .764 | 53.7 | 14 | 347-392 | ||
| 8 | 200-225 | 4.9 | 17.1 | .775 | 51.1 | 14 | 392-437 | ||
| 9 | 225-250 | 5.9 | 23.0 | .788 | 48.1 | 15 | 437-482 | ||
| 10 | 250-275 | 9.8 | 32.8 | .802 | 44.9 | 16 | 482-527 | ||
| Vacuum distillation at 40 mm | |||||||||
| 11 | Up to 200 | 0.4 | 0.4 | .847 | 35.6 | 28+ | 46 | 30 | Up to 392 |
| 12 | 200-225 | 5.2 | 5.6 | 392-437 | |||||
| 13 | 225-250 | 3.7 | 9.3 | .863 | 32.5 | 33 | 55 | 45 | 437-482 |
| 14 | 250-275 | 3.8 | 13.1 | .882 | 28.9 | 39 | 78 | 60 | 482-527 |
| 15 | 275-300 | 11.7 | 24.8 | .897 | 26.3 | 43 | 136 | 75 | 527-572 |
| Carbon residue of residuum, 21.3 percent; carbon residue of crude, 9.8 percent. | |||||||||
| Approximate Summary | ||||
|---|---|---|---|---|
| Percent | Sp. Gr. | °A.P.I. | Viscosity | |
| Light gasoline | 0.7 | |||
| Total gasoline and naphtha | 12.2 | .753 | 56.4 | |
| Kerosene distillate | 20.6 | .792 | 47.2 | |
| Gas oil | 4.9 | .846 | 35.8 | Below 50 |
| Nonviscous lubricating distillate | 9.2 | .854-.888 | 34.2-27.9 | 50-100 |
| Medium lubricating distillate | 10.7 | .888-.908 | 27.9-24.3 | 100-200 |
| Viscous lubricating distillate | ||||
| Residuum | 41.8 | 1.022 | ||
| Distillation loss | 0.6 | |||
| Base, Paraffin—intermediate. | ||||
Table 17—Mississippian dolomite, McLouth oil and gas pool, Hempel analysis of crude oil in the Apperson et al. No. 1 Bower well, SE NE sec. 5, T, 10 S., R. 20 E., Jefferson county, Kansas. Depth 1,595 to 1,605 feet. (Analysis by J. G. Crawford, Geol. Sur., Dept. of Interior, Casper, Wyo.)
| General Characteristics (Dehydrated oil) | ||||
|---|---|---|---|---|
| Specific Gravity | 0.916 | A.P.I. Gravity | 23.0° | |
| Percent Sulphur | 0.81 | Pour point | 5° F. | |
| Color | Black | |||
| Saybolt Universal Viscosity at 100° F., 1455 sec. B.S., mud and water (by centrifuge) |
||||
| Distillation, Bureau of Mines, Hempel Method | |||||||||
|---|---|---|---|---|---|---|---|---|---|
| Fraction No. |
Temp., °C |
Percent Cut |
Sum percent |
Sp. Gr. of cut 60/60° F |
°A.P.I. of cut 60° F |
C.I. | S.U. Viscosity at 100° F |
Cloud test° F |
Temp., °F |
| Dry distillation; Barometer, 630 mm; First drop, 76° C. (169° F.) | |||||||||
| 1 | Up to 50 | Up to 122 | |||||||
| 2 | 50-75 | 122-167 | |||||||
| 3 | 75-100 | 0.7 | 0.7 | .739 | 60.0 | 167-212 | |||
| 4 | 100-125 | 1.8 | 2.5 | 212-257 | |||||
| 5 | 125-150 | 2.2 | 4.7 | 257-302 | |||||
| 6 | 150-175 | 3.1 | 7.8 | .746 | 58.2 | 12 | 302-347 | ||
| 7 | 175-200 | 4,2 | 12.0 | .756 | 55.7 | 11 | 347-392 | ||
| 8 | 200-225 | 4.3 | 16.3 | .769 | 52.5 | 11 | 392-437 | ||
| 9 | 225-250 | 6.5 | 22.8 | .784 | 49.0 | 13 | 437-482 | ||
| 10 | 250-275 | 8.2 | 31.0 | .801 | 45.2 | 16 | 482-527 | ||
| Vacuum distillation at 40 mm | |||||||||
| 11 | Up to 200 | Up to 392 | |||||||
| 12 | 200-225 | 4.3 | 4.3 | .840 | 37.0 | 25 | 44 | 35 | 392-437 |
| 13 | 225-250 | 4,2 | 8.5 | .853 | 34.4 | 28 | 49 | 45 | 437-482 |
| 14 | 250-275 | 5.1 | 13.6 | .875 | 30.2 | 35 | 68 | 60 | 482-527 |
| 15 | 275-300 | 6.9 | 20.5 | .896 | 26.4 | 42 | 112 | 75 | 527-572 |
| Carbon residue of residuum, 19.5 percent; carbon residue of crude, 10.0 percent. | |||||||||
| Approximate Summary (Dehydrated oil) | ||||
|---|---|---|---|---|
| Percent | Sp. Gr. | °A.P.I. | Viscosity | |
| Light gasoline | 0.7 | |||
| Total gasoline and naphtha | 12.0 | .747 | 57.9 | |
| Kerosene distillate | 19.0 | .788 | 48.1 | |
| Gas oil | 6.7 | .843 | 36.4 | Below 50 |
| Nonviscous lubricating distillate | 8.7 | .854-.890 | 34.2-27.5 | 50-100 |
| Medium lubricating distillate | 5.1 | .890-.908 | 27.5-24.3 | 100-200 |
| Viscous lubricating distillate | ||||
| Residuum | 46.0 | 1.032 | ||
| Distillation loss | 2.5 | |||
| Base, Paraffin—intermediate. | ||||
Table 18—Devonian limestone, Barada pool, Hempel analysis of crude oil in the Skelly Oil Company No, 1 H, Roesch well, C N2 NW sec, 36, T. 3 N., R. 16 E., Falls City field, Richardson county, Nebraska. Depth 2,432 to 2,517 feet. (Analysis by Bureau of Mines, Dept. of Interior, at Bartlesville, Okla.)
| General Characteristics | ||||
|---|---|---|---|---|
| Specific Gravity | 0.881 | A.P.I. Gravity | 29.10 | |
| Percent Sulphur | 0.41 | Color | Brownish-black | |
| Saybolt Universal viscosity at 100° F., 140 sec.; at 130° F., 87 sec. | ||||
| Distillation, Bureau of Mines, Hempel Method | |||||||||
|---|---|---|---|---|---|---|---|---|---|
| Fraction No. |
Temp., °C |
Percent Cut |
Sum percent |
Sp. Gr. of cut 60/60° F |
°A.P.I. of cut 60° F |
C.I. | S.U. Viscosity at 100° F |
Cloud test° F |
Temp., °F |
| Dry distillation; Barometer, 747 mm; First drop, 72° C. (163° F.) | |||||||||
| 1 | Up to 50 | Up to 122 | |||||||
| 2 | 50-75 | 122-167 | |||||||
| 3 | 75-100 | 0.4 | 0.4 | .719 | 65.3 | 167-212 | |||
| 4 | 100-125 | 0.3 | 0.7 | .720 | 65.0 | 12 | 212-257 | ||
| 5 | 125-150 | 0.4 | 1.1 | .730 | 62.3 | 9.4 | 257-302 | ||
| 6 | 150-175 | 2.2 | 3.3 | .743 | 58.9 | 8.8 | 302-347 | ||
| 7 | 175-200 | 3.3 | 6.5 | .757 | 55.4 | 9.2 | 347-392 | ||
| 8 | 200-225 | 3.4 | 9.9 | .773 | 51.6 | 11 | 392-437 | ||
| 9 | 225-250 | 4.6 | 14.5 | .788 | 48.1 | 13 | 437-482 | ||
| 10 | 250-275 | 7.5 | 22.0 | .803 | 44.7 | 15 | 482-527 | ||
| Vacuum distillation at 40 mm | |||||||||
| 11 | Up to 200 | 5.3 | 27.3 | .818 | 41.5 | 19 | 39 | 20 | Up to 392 |
| 12 | 200-225 | 10.6 | 37,9 | .827 | 39.6 | 19 | 43 | 35 | 392-437 |
| 13 | 225-250 | 7.2 | 45.1 | .846 | 35,8 | 25 | 51 | 45 | 437-482 |
| 14 | 250-275 | 5.8 | 50.9 | .866 | 31.9 | 31 | 75 | 65 | 482-527 |
| 15 | 275-300* | 5.7 | 56.6 | .882 | 28.9 | 115 | 80 | 527-572* | |
| Carbon residue of residuum, 12.8 percent; carbon residue of crude, 5.5 percent. | |||||||||
| Approximate Summary | ||||
|---|---|---|---|---|
| Percent | Sp. Gr. | °A.P.I. | Viscosity | |
| Light gasoline | 0.4 | .719 | 65.3 | |
| Total gasoline and naphtha | 6.5 | .747 | 57.9 | |
| Kerosene distillate | 15.5 | .792 | 47.2 | |
| Gas oil | 18.5 | .830 | 39.0 | Below 50 |
| Nonviscous lubricating distillate | 11.1 | .844-.876 | 36.2-30.0 | 50-100 |
| Medium lubricating distillate | 5.0 | .876-.890 | 30.0-27.5 | 100-200 |
| Viscous lubricating distillate | Above 200 | |||
| Residuum | 42.8 | .961 | 15.7 | |
| Distillation loss | 0.6 | |||
| *discontinued 297° C, (567° F.) | ||||
Table 19—Devonian limestone, Falls City pool. Hempel analysis of crude oil in the Pawnee Royalty Company No, 1 Bushels well, C NW SW sec. 17, T. 1 N., R. 16 E., Falls City field, Richardson county, Nebraska, Depth 2,217 to 2,230 feet. (Analysis by Bureau of Mines, Dept, of Interior, at Bartlesville. Okla.)
| General Characteristics | ||||
|---|---|---|---|---|
| Specific gravity | 0.866 | A.P.I. gravity | 31.90 | |
| Percent Sulphur | 0.37 | Color | Greenish-black | |
| Saybolt Universal viscosity at77° F., 125 sec.; at 100° F., 84 sec. | ||||
| Distillation, Bureau of Mines, Hempel Method | |||||||||
|---|---|---|---|---|---|---|---|---|---|
| Fraction No. |
Temp., °C |
Percent Cut |
Sum percent |
Sp. Gr. of cut 60/60° F |
°A.P.I. of cut 60° F |
C.I. | S.U. Viscosity at 100° F |
Cloud test° F |
Temp., °F |
| Dry distillation; Barometer, 749 mm; First drop, 94° C. (201° F.) | |||||||||
| 1 | Up to 50 | Up to 122 | |||||||
| 2 | 50-75 | 122-167 | |||||||
| 3 | 75-100 | 0.1 | 0.1 | .647 | 87.2 | 167-212 | |||
| 4 | 100-125 | 1.0 | 1.1 | .694 | 72.4 | 0.1 | 212-257 | ||
| 5 | 125-150 | 1.8 | 2.9 | .721 | 64.8 | 5.1 | 257-302 | ||
| 6 | 150-175 | 2.9 | 5.8 | .741 | 59.5 | 7.8 | 302-347 | ||
| 7 | 175-200 | 4.0 | 9.8 | .755 | 55.9 | 8.2 | 347-392 | ||
| 8 | 200-225 | 4.3 | 14.1 | .769 | 52.5 | 9.3 | 392-437 | ||
| 9 | 225-250 | 6.2 | 20.3 | .782 | 49.5 | 10 | 437-482 | ||
| 10 | 250-275 | 8.1 | 28.4 | .794 | 46.7 | 11 | 482-527 | ||
| Vacuum distillation at 40 mm | |||||||||
| 11 | Up to 200 | 5.9 | 34.3 | .814 | 42.3 | 17 | 39 | 20 | Up to 392 |
| 12 | 200-225 | 9.5 | 43.8 | .826 | 39.8 | 19 | 42 | 35 | 392-437 |
| 13 | 225-250 | 6.7 | 50.5 | .842 | 36.6 | 23 | 49 | 50 | 437-482 |
| 14 | 250-275 | 5.2 | 55.7 | .862 | 32.7 | 29 | 68 | 60 | 482-527 |
| 15 | 275-300 | 6.1 | 61.8 | .880 | 29.3 | 35 | 110 | 80 | 527-572 |
| Carbon residue of residuum, 10.4 percent; carbon residue of crude, 4.0 percent. | |||||||||
| Approximate Summary | ||||
|---|---|---|---|---|
| Percent | Sp. Gr. | °A.P.I. | Viscosity | |
| Light gasoline | 0.1 | .647 | 87.2 | |
| Total gasoline and naphtha | 9.8 | .757 | 60.5 | |
| Kerosene distillate | 18.6 | .784 | 49.0 | |
| Gas oil | 19.2 | .826 | 39.8 | Below 50 |
| Nonviscous lubricating distillate | 9.8 | .843-.875 | 36.4-30.2 | 50-100 |
| Medium lubricating distillate | 4.4 | .875-.890 | 30.2-27.5 | 100-200 |
| Viscous lubricating distillate | Above 200 | |||
| Residuum | 38.0 | .956 | 16.5 | |
| Distillation loss | 0.2 | |||
Table 20—Kimmswick (= Viola) limestone, Dawson pool. Hempel analysis of crude oil in the Skelly Oil Company No. 1 Wiltse well, sec. 10,T. 1 N., R. 14 E., Falls City field, Richardson county, Nebraska. (Analysis by Bureau of Mines, Dept, of Interior, at Bartlesville, Okla.)
| General Characteristics | ||||
|---|---|---|---|---|
| Specific gravity | 0.880 | A.P.I. Gravity | 29.30 | |
| Percent Sulphur | 0.33 | Color | Brownish-black | |
| Saybolt Universal viscosity at 100° F., 165 sec.; at 130° F., 96 sec. | ||||
| Distillation, Bureau of Mines, Hempel Method | |||||||||
|---|---|---|---|---|---|---|---|---|---|
| Fraction No. |
Temp., °C |
Percent Cut |
Sum percent |
Sp. Gr. of cut 60/60° F |
°A.P.I. of cut 60° F |
C.I. | S.U. Viscosity at 100° F |
Cloud test° F |
Temp., °F |
| Dry distillation; Barometer, 741 mm; First drop, 66° C. (151° F.) | |||||||||
| 1 | Up to 50 | Up to 122 | |||||||
| 2 | 50-75 | 122-167 | |||||||
| 3 | 75-100 | 1.3 | 1.3 | .696 | 71.8 | 167-212 | |||
| 4 | 100-125 | 1.1 | 2.4 | .716 | 66.1 | 10 | 212-257 | ||
| 5 | 125-150 | 2.3 | 4.7 | .725 | 63.7 | 7.0 | 257-302 | ||
| 6 | 150-175 | 2.6 | 7.3 | .744 | 58.7 | 9.2 | 302-347 | ||
| 7 | 175-200 | 3.9 | 11.2 | .757 | 55.4 | 9.2 | 347-392 | ||
| 8 | 200-225 | 3.9 | 15.1 | .770 | 52.3 | 9.7 | 392-437 | ||
| 9 | 225-250 | 5.3 | 20.4 | .783 | 49.2 | 11 | 437-482 | ||
| 10 | 250-275 | 8.0 | 28.4 | .795 | 46.5 | 12 | 482-527 | ||
| Vacuum distillation at 40 mm | |||||||||
| 11 | Up to 200 | 4.1 | 32.5 | .814 | 42.3 | 17 | 39 | 30 | Up to 392 |
| 12 | 200-225 | 9.3 | 41.8 | .823 | 40.4 | 17 | 43 | 40 | 392-437 |
| 13 | 225-250 | 5.9 | 47.7 | .843 | 36.4 | 23 | 50 | 50 | 437-482 |
| 14 | 250-275 | 4.3 | 52.0 | .863 | 32.5 | 30 | 70 | 65 | 482-527 |
| 15 | 275-300 | 4.5 | 56.5 | .879 | 29.5 | 34 | 110 | 80 | 527-572 |
| Carbon residue of residuum, 16.3 percent; carbon residue of crude, 7.0 percent. | |||||||||
| Approximate Summary | ||||
|---|---|---|---|---|
| Percent | Sp. Gr. | °A.P.I. | Viscosity | |
| Light gasoline | 1.3 | .696 | 71.8 | |
| Total gasoline and naphtha | 11.2 | .736 | 60.8 | |
| Kerosene distillate | 17.2 | .786 | 48.5 | |
| Gas oil | 16.4 | .827 | 39,6 | Below 50 |
| Nonviscous lubricating distillate | 8.4 | .843-.875 | 36.4-30.2 | 50-100 |
| Medium lubricating distillate | 3.3 | .875-.887 | 30.2-28.0 | 100-200 |
| Viscous lubricating distillate | Above 200 | |||
| Residuum | 43.0 | .980 | 12.9 | |
| Distillation loss | 0.5 | |||
Table 21—Devonian limestone, Dawson pool. Hempel analysis of crude oil in the Frank Powers No. 1A Albin Estate well, SW NW SW sec. 10, T. 1 N., R. 14 E., Falls City field, Richardson county, Nebraska. Depth 2,220 to 2,230 feet. (Analysis by J. G, Crawford, Geol. Sur., Dept, of Interior, Casper, Wyo.)
| General Characteristics | ||||
|---|---|---|---|---|
| Specific gravity | 0.910 | A.P.I. Gravity | 24.0° | |
| Percent Sulphur | 0.27 | Pour point | 10° F, | |
| Color | Black | |||
| Saybolt Universal Viscosity at 100° F., 660 sec. | ||||
| Distillation, Bureau of Mines, Hempel Method | |||||||||
|---|---|---|---|---|---|---|---|---|---|
| Fraction No. |
Temp., °C |
Percent Cut |
Sum percent |
Sp. Gr. of cut 60/60° F |
°A.P.I. of cut 60° F |
C.I. | S.U. Viscosity at 100° F |
Cloud test° F |
Temp., °F |
| Dry distillation; Barometer, 632 mm; First drop, 1540 C, (309° F.) | |||||||||
| 1 | Up to 50 | Up to 122 | |||||||
| 2 | 50-75 | 122-167 | |||||||
| 3 | 75-100 | 167-212 | |||||||
| 4 | 100-125 | 212-257 | |||||||
| 5 | 125-150 | 257-302 | |||||||
| 6 | 150-175 | 1.5 | 1.5 | .767 | 53.0 | 302-347 | |||
| 7 | 175-200 | 2.5 | 4.0 | 347-392 | |||||
| 8 | 200-225 | 3.0 | 7.0 | .777 | 50.6 | 15 | 392-437 | ||
| 9 | 225-250 | 4.3 | 11.3 | .787 | 48.3 | 14 | 437-482 | ||
| 10 | 250-275 | 8.5 | 19.8 | .801 | 45.2 | 16 | 482-527 | ||
| Vacuum distillation at 40 mm | |||||||||
| 11 | Up to 200 | Up to 392 | |||||||
| 12 | 200-225 | 8.4 | 8.4 | .834 | 38.2 | 22 | 45 | 35 | 392-437 |
| 13 | 225-250 | 6.0 | 14.4 | .848 | 35.4 | 26 | 52 | 50 | 437-482 |
| 14 | 250-275 | 5.9 | 20.3 | .867 | 31.7 | 31 | 73 | 65 | 482-527 |
| 15 | 275-300 | 10.9 | 31.2 | .885 | 28,4 | 37 | 124 | 80 | 527-572 |
| Carbon residue of residuum, 14.1 percent; carbon residue of crude. 7.2 percent. | |||||||||
| Approximate Summary | ||||
|---|---|---|---|---|
| Percent | Sp. Gr. | °A.P.I. | Viscosity | |
| Light gasoline | ||||
| Total gasoline and naphtha | 4.0 | .767 | 53.0 | |
| Kerosene distillate | 15.8 | .793 | 46.9 | |
| Gas oil | 9.4 | .835 | 38.0 | Below 50 |
| Nonviscous lubricating distillate | 12.4 | .844-.876 | 36.2-30.0 | 50-100 |
| Medium lubricating distillate | 9.4 | .876-.897 | 30.0-26.3 | 100-200 |
| Viscous lubricating distillate | Above 200 | |||
| Residuum | 47.2 | .990 | 11.4 | |
| Distillation loss | 1.8 | |||
| Base, Paraffin—intermediate. | ||||
Table 22—Devonian limestone, Shubert pool. Hempel analysis of crude oil in the Black Gold Operating Company No. 1 Smith well, E2 NW NW sec. 31, T. 3 N., R. 16 E., Falls City field, Richardson county, Nebraska. Depth 2,513 to 2,521 feet. (Analysis by J. G. Crawford, Geol. Sur., Dept. of Interior, Casper, Wyo.)
| General Characteristics | ||||
|---|---|---|---|---|
| Specific gravity | 0.884 | A.P.I. Gravity | 28.6 ° | |
| Precent Sulphur | Less than 0.1 | Pour point | 5 ° F. | |
| Color | Black | |||
| Saybolt Universal viscosity at 100° F., 170 sec. | ||||
| Distillation, Bureau of Mines, Hempel Method | |||||||||
|---|---|---|---|---|---|---|---|---|---|
| Fraction No. |
Temp., °C |
Percent Cut |
Sum percent |
Sp. Gr. of cut 60/60° F |
°A.P.I. of cut 60° F |
C.I. | S.U. Viscosity at 100° F |
Cloud test° F |
Temp., °F |
| Dry distillation; Barometer, 636 mm; First drop, 135° C. (275° F.) | |||||||||
| 1 | Up to 50 | Up to 122 | |||||||
| 2 | 50-75 | 122-167 | |||||||
| 3 | 75-100 | 167-212 | |||||||
| 4 | 100-125 | 212-257 | |||||||
| 5 | 125-150 | 1.1 | 1.1 | .755 | 55.9 | 257-302 | |||
| 6 | 150-175 | 2.7 | 3.8 | 302-347 | |||||
| 7 | 175-200 | 4.0 | 7.8 | .761 | 54.4 | 13 | 347-392 | ||
| 8 | 200-225 | 4.6 | 12.4 | .771 | 52.0 | 12 | 392-437 | ||
| 9 | 225-250 | 6.1 | 18.5 | .783 | 49.2 | 12 | 437-482 | ||
| 10 | 250-275 | 9.6 | 28.1 | .797 | 46.0 | 14 | 482-527 | ||
| Vacuum distillation at 40 mm | |||||||||
| 11 | Up to 200 | 1.2 | 1.2 | .827 | 39.6 | 23 | 42 | 25 | Up to 392 |
| 12 | 200-225 | 8.6 | 9.8 | .831 | 38.8 | 21 | 44 | 35 | 392-437 |
| 13 | 225-250 | 6.2 | 16.0 | .847 | 35,6 | 25 | 53 | 40 | 437-482 |
| 14 | 250-275 | 5.0 | 21.0 | .865 | 32.1 | 31 | 72 | 60 | 482-527 |
| 15 | 275-300 | 7.5 | 28.5 | .884 | 28.6 | 37 | 112 | 80 | 527-572 |
| Carbon residue of residuum, 7.5 percent; carbon residue of crude, 3.4 percent. | |||||||||
| Approximate Summary | ||||
|---|---|---|---|---|
| Percent | Sp. Gr. | °A.P.I. | Viscosity | |
| Light gasoline | ||||
| Total gasoline and naphtha | 7.8 | .758 | 55.2 | |
| Kerosene distillate | 20.3 | .787 | 48.3 | |
| Gas oil | 10.4 | .831 | 38.8 | Below 50 |
| Nonviscous lubricating distillate | 12.4 | .842-.878 | 36.6-29.7 | 50-100 |
| Medium lubricating distillate | 5.7 | .878-.896 | 29.7-26.4 | 100-200 |
| Viscous lubricating distillate | Above 200 | |||
| Residuum | 41.8 | .980 | 12.9 | |
| Distillation loss | 1.6 | |||
| Base, Paraffin—intermediate. | ||||
Table 23—Devonian limestone, Barada pool. Hempel analysis of crude oil in the Skelly Oil Co. No. 1 Henry Roesch well, C N2 NW sec, 36, T. 3 N., R. 16 E., Falls City field, Richardson county, Nebraska. Depth 2,439 to 2,488 feet. (Analysis by J. G. Crawford, Geol. Sur., Dept, of Interior, Casper, Wyo.)
| General Characteristics | ||||
|---|---|---|---|---|
| Specific Gravity | 0.882 | A.P.I. Gravity | 28.90 | |
| Percent Sulphur | 0.37 | Pour point | 15° F. | |
| Color | Black | |||
| Saybolt Universal Viscosity at 100° F., 138 sec. | ||||
| Distillation, Bureau of Mines, Hempel Method | |||||||||
|---|---|---|---|---|---|---|---|---|---|
| Fraction No. |
Temp., °C |
Percent Cut |
Sum percent |
Sp. Gr. of cut 60/60° F |
°A.P.I. of cut 60° F |
C.I. | S.U. Viscosity at 100° F |
Cloud test° F |
Temp., °F |
| Dry distillation; Barometric pressure, 631 mm; First drop, 153° C. (307° F.) | |||||||||
| 1 | Up to 50 | Up to 122 | |||||||
| 2 | 50-75 | 122-167 | |||||||
| 3 | 75-100 | 167-212 | |||||||
| 4 | 100-125 | 212-257 | |||||||
| 5 | 125-150 | 257-302 | |||||||
| 6 | 150-175 | 2.3 | 2.3 | .754 | 56.2 | 16 | 302-347 | ||
| 7 | 175-200 | 3.4 | 5.7 | .764 | 53.7 | 14 | 347-392 | ||
| 8 | 200-225 | 3.9 | 9.6 | .775 | 51.1 | 14 | 392-437 | ||
| 9 | 225-250 | 5.4 | 15.0 | .788 | 48.1 | 15 | 437-482 | ||
| 10 | 250-275 | 8.6 | 23.6 | .802 | 44.9 | 16 | 482-527 | ||
| Vacuum distillation at 40 mm | |||||||||
| 11 | Up to 200 | 1.4 | 1.4 | .825 | 40,0 | 22 | 41 | 20 | Up to 392 |
| 12 | 200-225 | 9.4 | 10.8 | .831 | 38.8 | 21 | 43 | 35 | 392-437 |
| 13 | 225-250 | 7.5 | 18,3 | .843 | 36.4 | 23 | 50 | 45 | 437-482 |
| 14 250-275 | 5.1 | 23.4 | .860 | 33.0 | 28 | 64 | 60 | 482-527 | |
| 15 | 275-300 | 6,9 | 30.3 | .879 | 29.5 | 34 | 101 | 75 | 527-572 |
| Carbon residue of residuum,1l.2 percent; carbon residue of crude, 5,3 percent | |||||||||
| Approximate Summary | ||||
|---|---|---|---|---|
| Percent | Sp. Gr. | °A.P.I. | Viscosity | |
| Light gasoline | ||||
| Total gasoline and naphtha | 5.7 | .760 | 54.7 | |
| Kerosene distillate | 17.9 | .792 | 47.2 | |
| Gas oil | 14.6 | .833 | 38.4 | Below 50 |
| Nonviscous lubricating distillate | 12.1 | .843-.879 | 36.4-29.5 | 50-100 |
| Medium lubricating distillate | 3.6 | .879-.890 | 29.5-27.5 | 100-200 |
| Viscous lubricating distillate | Above 200 | |||
| Residuum | 43.9 | 960 | 15.9 | |
| Distillation loss | 2.2 | |||
| Base, Paraffin—intermediate. | ||||
Table 24—Devonian limestone, Falls City pool. Hempel analysis of crude oil in the Harry Harper No. 1 Sibbernsen well, SE NE NW sec, 20, T. 1 N., R. 16 E., Falls City field, Richardson county, Nebraska. Depth 2,210 to 2,236 feet, (Analysis by J. G. Crawford, Geol. Sur., Dept, of Interior, Casper, Wyo.)
| General Characteristics | ||||
|---|---|---|---|---|
| Specific gravity | 0.868 | A.P.I. Gravity | 31.50 | |
| Percent Sulphur | 0.13 | Pour point | 20° F. | |
| Color | Brownish-Black | |||
| Saybolt Universal Viscosity at 100° F., 86 sec. | ||||
| Distillation, Bureau of Mines, Hempel Method | |||||||||
|---|---|---|---|---|---|---|---|---|---|
| Fraction No. |
Temp., °C |
Percent Cut |
Sum percent |
Sp. Gr. of cut 60/60° F |
°A.P.I. of cut 60° F |
C.I. | S.U. Viscosity at 100° F |
Cloud test° F |
Temp., °F |
| Dry distillation; Barometer, 635 mm; First drop, 124° C. (255° F.) | |||||||||
| 1 | Up to 50 | Up to 122 | |||||||
| 2 | 50-75 | 122-167 | |||||||
| 3 | 75-100 | 167-212 | |||||||
| 4 | 100-125 | 212-257 | |||||||
| 5 | 125-150 | 2.6 | 2.6 | .749 | 57.4 | 20 | 257-302 | ||
| 6 | 150-175 | 3.2 | 5.8 | .755 | 55.9 | 16 | 302-347 | ||
| 7 | 175-200 | 4.4 | 10.2 | .765 | 53.5 | 15 | 347-392 | ||
| 8 | 200-225 | 5.2 | 15.4 | .776 | 50.9 | 14 | 392-437 | ||
| 9 | 225-250 | 6.6 | 22.0 | .789 | 47,8 | 15 | 437-482 | ||
| 10 | 250-275 | 9.5 | 31.5 | .803 | 44.7 | 17 | 482-527 | ||
| Vacuum distillation at 40 mm | |||||||||
| 11 | Up to 200 | 2.0 | 2.0 | .825 | 40,0 | 22 | 40 | 25 | Up to 392 |
| 12 | 200-225 | 9.5 | 11.5 | .833 | 38.4 | 22 | 44 | 35 | 392-437 |
| 13 | 225-250 | 6.3 | 17.8 | .848 | 35.4 | 26 | 51 | 45 | 437-482 |
| 14 | 250-275 | 5.5 | 23.3 | .866 | 31.9 | 31 | 70 | 60 | 482-527 |
| 15 | 275-300 | 6.1 | 29.4 | .884 | 28.6 | 37 | 106 | 75 | 527-572 |
| Carbon residue of residuum, 9.3 percent; carbon residue of crude, 3.9 percent. | |||||||||
| Approximate Summary | ||||
|---|---|---|---|---|
| Percent | Sp. Gr. | °A.P.I. | Viscosity | |
| Light gasoline | ||||
| Total gasoline and naphtha | 10.2 | .758 | 55.2 | |
| Kerosene distillate | 21.3 | .792 | 47.2 | |
| Gas oil | 13.8 | .833 | 38.4 | Below 50 |
| Nonviscous lubricating distillate | 11.6 | .846-.881 | 35.8-29.1 | 50-100 |
| Medium lubricating distillate | 4.0 | .881-.893 | 29.1-27.0 | 100-200 |
| Viscous lubricating distillate | Above 200 | |||
| Residuum | 37.5 | 957 | 16.4 | |
| Distillation loss | 1.6 | |||
| Base, Paraffin—intermediate. | ||||
Comparison of McLouth and Mississippian Oils in McLouth Field with Oils from Other Areas
A comparison of these analyses has been made by N. W. Bass at the request of the writers. Mr. Bass, who was a member of the committee of the Tulsa Geological Society to investigate the correlative index method for interpreting oil analyses proposed by H. M. Smith of the Bureau of Mines, has contributed the following discussion and the accompanying table 25 and chart (fig. 19).
Samples of oil from the McLouth sand and from the Mississippian limestone in the McLouth field were analyzed by the Hempel method. These analyses are compared herein with analyses, also by the Hempel method, of oils from the Falls City, Barada, and Dawson pools in the Falls City field, Nebraska, and with analyses of oils from two other fields in Kansas, The A.P.I. gravity, sulphur, carbon residue and residuum of the oils are listed in table 25, The average correlation indices for the oils are shown graphically in figure 19, The correlation index method for interpreting oil analyses (Smith, 1940) was developed recently during an investigation of the crude oils of Oklahoma and Kansas by a committee of the Tulsa Geological Society. As stated by that committee (L. M. Neumann and others, 1941, p. 1801), "This method employs a simple index number based on the boiling point-specific gravity relationships of pure hydrocarbons. The magnitude of the correlation index indicates certain characteristics of fractions of the crude oil distilling off at definite temperature intervals. The characteristics of these fractions depend in turn on the relative quantities of the various hydrocarbons present. These hydrocarbons belong to three main groups or types-paraffines, naphthenes, and aromatics. The index number increases in the same order; thus, low indices (10 or less) indicate paraffines, indices of 10 to 40 indicate mixtures of paraffines and naphthenes (in some, small amounts of aromatics are present), and indices above 40 indicate increasing amounts of aromatic compounds generally mixed with naphthenes."
A comparison of the parts of the analyses shown in table 25 and a comparison of the correlation indices determined by the analyses and shown in figure 19, reveal that in the McLouth field the oil from the McLouth sand is similar to the oil from the Mississippian dolomite. The greatest difference between the two oils is shown in the percent of sulphur but both oils have a large sulphur content when compared with other oils in Kansas, The differences between the oils shown by the curves of the correlation indices are so small that they may be attributed to experimental errors.
The oil from the McLouth field is peculiar among the oils of Kansas fields, however. This fact is strikingly shown by the items in table 25 and by the correlation index curves (fig. 19), where the oils of this field are compared with two oils that are fairly typical of many Kansas fields; one of these is from the Burbank (so-called Bartlesville) sand in the Madison field in Greenwood county and the other is from the Mississippian limestone in the Hazlett field in Butler county. The A.P.I. gravity of the oil from the McLouth field, which is between 230 and 240, is much less than that of the oils from most Kansas fields, the gravity of which commonly ranges between 330 and 410. The gravities of the oils from the Madison and Hazlett fields are 39.60 and 40.40, respectively. The percent of sulphur in the five samples of oil from the McLouth field ranges from 0.75 to 0,99, which is much greater than in most oils from Kansas fields. The percent of sulphur in oils from most fields in Kansas is less than 0.25; in the Madison and Hazlett fields it is 0,20 and 0.13 percent, respectively, Moreover, the percent of carbon residue of the crude and the percent of residuum in the oil of the McLouth field is much greater than in the oils of most Kansas fields.
The correlation index curves show that the oil from the McLouth field is much more paraffinic than the oil from the Madison and Hazlett fields. Only in the last two fractions of the distillation do the indices of the oils from McLouth approach those of the oils from Madison and Hazlett. Only very small quantities of distillate were obtained in the first five fractions and none was obtained in the first two fractions during the distillation of the samples of the McLouth oils.
Analyses of two samples of oil from the Devonian limestone in the Falls City field and one sample from the Kimmswick (-Viola) limestone in the Dawson field, Nebraska, were examined. The analyses of the samples were so similar that they seem to represent similar oils, so the data are shown in table 25 and figure 19 as averages. These oils, although different from the oils at McLouth, show many features that, in a broad way, are similar. The gravities of the oils from the Nebraska fields are higher than those of the McLouth oils. The percent of sulphur, percent of carbon residue of the crude, and percent of residuum, although large, are less than in the McLouth oils. The correlation index curves show that some of the distillation fractions of the oils from the Nebraska fields are slightly more paraffinic than the corresponding fractions of oils from the McLouth field. The correlation index curves of the oils from the three pools in Nebraska and those from the McLouth field in Kansas, as well as the items shown in table 25 are roughly comparable, however, and suggest that these oils represent a group or class that is greatly different from another class such as one which would include the oils from the Madison and Hazlett fields.
Table 25—Data obtained from analyses of oils from the McLouth field and three other fields.
| ° A.P.I. | Sulphur, percent |
Carbon residue of crude, percent |
Residuum, percent |
|
|---|---|---|---|---|
| Average of three samples of oil from McLouth sand in McLouth field |
23.7 | 0.87 | 10.2 | 45.2 |
| Average of two samples of oil from Mississippian dolomite in McLouth field |
23.3 | 0.79 | 9.9 | 43.9 |
| Averages of three samples of oil, two from Hunton limestone and one from Viola limestone, Falls City field, Nebraska |
30.1 | 0.37 | 5.5 | 41.3 |
| Average of three samples of oil from Burbank (so-called Bartlesville) sand in Madison field, Greenwood county, Kansas |
39.6 | 0.20 | 1.6 | 20.5 |
| One sample of oil from Mississippian limestone in Hazlett field, Butler county, Kansas |
40.4 | 0.13 | 1.6 | 15.0 |
| Average of four samples of oil from Hunton limestone, Falls City field |
25.6 | 0.22 | 5.0 | 42.6 |
Figure 19—A, Curves showing percentage of distillation fractions of Hempel analyses of McLouth and Falls City oils. B, Curves of correlation indices of Hempel analyses of McLouth and Falls City oils and comparison with correlation index curves of Burbank and Mississippian oils in southeastern Kansas.
A, Average of three samples of oil from the McLouth sand, McLouth field, Kansas. Analyzed at 635 mm at Casper, Wyo.
B, Average of two samples of oil from the Mississippian limestone, McLouth field, Kansas, Analyzed at 635 mm at Casper, Wyo.
C, Average of three samples, two from "Hunton" and one from Viola limestone, Falls City field, Nebraska, Analyzed at 740 mm at Bartlesville, Okla.
D, One sample of oil from Mississippian limestone, Hazlett field, Butler county, Kansas. Analyzed at 740 mm.
E, Average of three samples of oil from the Burbank (so-called Bartlesville) sand, Madison field, Greenwood county, Kansas. Analyzed at 740 mm.
F, Average of four samples of oil from "Hunton" limestone, one from each of four pools, Falls City field, Nebraska, Analyzed at 635 mm at Casper, Wyo.
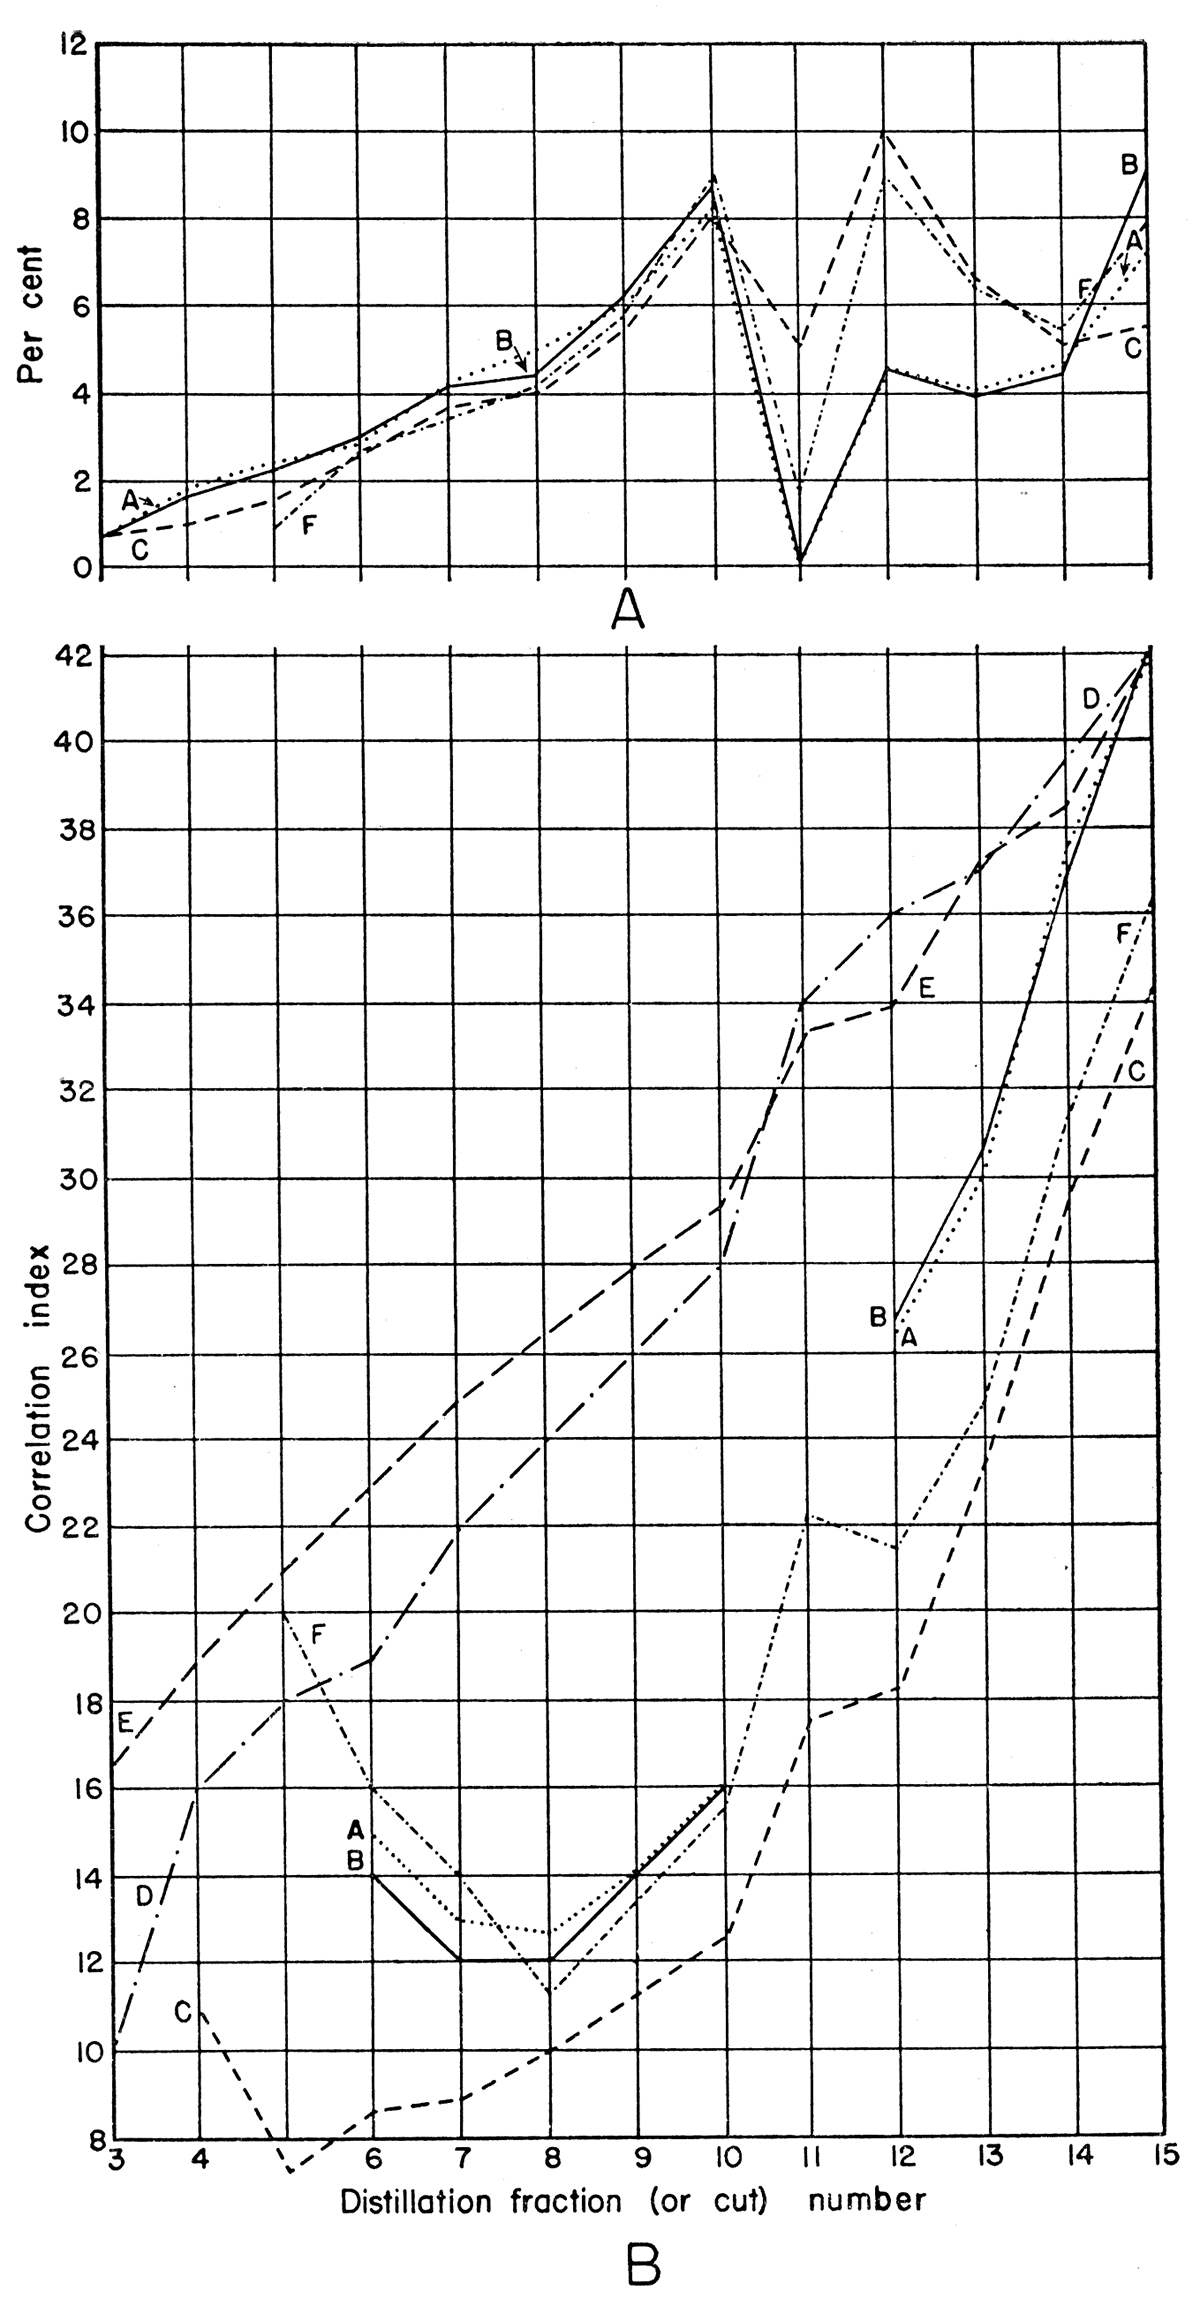
Comparison of Oils from the McLouth Field with Oils from the Falls City Field
The analyses of oil from the McLouth field, curves A and B of figure 19, were made at Casper, Wyoming, where the average barometric pressure is 635 mm. The correlation indices for McLouth oils have been taken from tables calculated for pressures of 635 mm by J. G. Crawford, associate petroleum chemist, U. S. Geological Survey, Casper, Wyoming (Crawford and Larsen, 1943). The analyses of oils from the Falls City field (curve C of figure 19) were made at Bartlesville, Oklahoma, where the average barometric pressure is 740 mm. The correlation indices for Falls City oils (curve C) have been taken from tables published for pressures of 740 mm by Harold M. Smith of the U. S. Bureau of Mines, Bartlesville, Oklahoma (1940). The correlation indices of oils thus analyzed at different atmospheric pressures are not strictly comparable. As pointed out in a letter from J. G. Crawford, "The lower boiling Hempel fractions at Casper contain heavier material and the specific gravities are correspondingly heavier than at Bartlesville. The indices at Casper pressures are from 1 to 3 points higher than those in use at Bartlesville." Inasmuch as the boiling points of the two sets of samples overlap, neither the volume of the fractions nor their specific gravities are strictly comparable. Fractions 11 to 15, however, which are separated in both laboratories by vacuum distillation at 40 mm, are comparable.
Although the index curves for oils from McLouth (A and B) and oils from Falls City (curve C) differ in the fractions distilled at atmospheric pressure, the curves for the two fields show a marked resemblance in the character of the low temperature fractions which in both fields are markedly paraffinic. Bearing in mind that correlation indices of the oils analyzed at Casper are from 1 to 3 points higher than the corresponding fractions at Bartlesville, it is apparent that under identical pressures the index curve C would have shown a closer resemblance to curves A and B.
Since the discussion of the oil in the McLouth field was prepared by Bass, four analyses of oil from the Falls City field have been made in the laboratory of the Federal Geological Survey at Casper, Wyoming, by J. G. Crawford. These analyses are given in tables 21, 22, 23, and 24. The oils analyzed are all from the "Hunton" limestone - one each from the Dawson, Shubert, Barada, and Falls City pools. The average percentage volumes of the distillation fractions arid the average correlation indices of the four oils are shown in figure 19 by the curves marked F. Although the averages represented by curve C include one sample of oil from the Viola limestone, a comparison of lines C and F shows approximately the difference in the correlation indices caused by distillation at Bartlesville at a pressure of 740 mm (curve C) and at Casper at a pressure of 635 mm (curve F). Curves A, B, and F are strictly comparable with each other, all the analyses having been made at pressures approximating 635 mm. Curves C, D, and E are also mutually comparable inasmuch as the oils represented were analyzed at pressures approximating 740 mm. The Falls City and McLouth oils, although showing some differences, are radically different from oils in other parts of Kansas.
The average volumes of separate distillation fractions of oils from the McLouth field and from the Falls City pools as determined by the Hempel analyses also are shown in figure 19. It will be noted that there is an approximate agreement especially in the volumes of fractions in the earlier distillation cuts under atmospheric pressure although the fractions of the Falls City oils are consistently slightly lower in volume. The fractions distilled under a pressure of 40 mm have a greater range of volume but, in general, the increase and decrease in volumes occur in the same fractions.
The senior writer believes that the oil in the McLouth sand reached its present position from the dolomite zone of the Mississippian limestone, and that both the oil in the McLouth sand and that in the Mississippian were originally derived from a still deeper source. The unique character of the oil in the McLouth and Falls City pools revealed by the curve of correlation indices implies a similarity of source materials and a similar dynamic history. The fact that the oils from the Falls City pools were produced from pools in Devonian limestone and in Kimmswick (= Viola) limestone and the fact that in the McLouth field and elsewhere in the Forest City basin in Kansas shows of oil are not infrequent in dolomite in the upper part of the Devonian suggest that the oil in both fields may have been derived from source material at least as old as the Kimmswick limestone.
Analyses of Gas
Table 26 gives analyses of gas from the McLouth field. The first three samples show the results of analyses of samples of gas from the McLouth sand. Nos. 1 and 2 show analyses of gas from the McLouth pool, No. 3 of gas from the North McLouth pool; No. 4 is an analysis of gas from the St. Louis limestone, and No. 5 of gas accompanying oil from the Misssisippian dolomite zone. No. 6 is an analysis of gas from the upper part of the undifferentiated Burlington and Keokuk limestones above the dolomite zone from which oil is produced.
Table 26—Analyses of gas from the McLouth field.
| No. | Well | Date | Carbon dioxide CO2 |
Oxygen O2 |
Methane CH4 |
Ethane C2H6 |
Residue | Heating value* |
|---|---|---|---|---|---|---|---|---|
| 1 | McLaughlin and Sons No. 1 Dark1 (McLaughlin) SW NW 4-10-20 E. (McLouth sand). |
8-17-1940 | 0.21 | 0.00 | 92.61 | 0.86 | 6.32 | 952 |
| 2 | McLaughlin and Sons No, 1 Ragan2 NW NW, 3-10-20E, (McLouth sand) |
9-10-1941 | 0.36 | 0.00 | 97.25 | 0.94 | 1.45 | 998 |
| 3 | Hatcher and Fisk No. 1 Tabor Edmonds2 SW SE 16-9-20E. (McLouth sand) |
9-10-1941 | 0.48 | 0.00 | 87.45 | 3.41 | 8.66 | 943 |
| 4 | Mosbacher No. 1 Dolman2 NW NW SE 27-9-20E, (St. Louis limestone) |
3-18-1942 | 0.24 | 0.00 | 89.40 | 2.69 | 7.67 | 950 |
| 5 | Apperson-Stark No. 1 McLaughlin2 SW NW NW 4-10-20E. (accompanying oil in Burlington-Keokuk dolomite) |
6-1-1943 | 0.97 | 0.00 | 88.15 | 5.13 | 5.75 | 981 |
| 6 | Jackson No. 1 Bowers2 NE NE SW 5-10-20E. (upper part of Burlington and Keokuk) |
9-16-1943 | 0.39 | 0.00 | 89.65 | 1.84 | 8.12 | 937 |
| * per cubic foot (dry) at 60° F, and 30 inches of mercury. B.t.u. 1 Analysis by V. M. Gustafson, Chemist, Kansas Light and Power Company, McPherson, Kansas. 2 Analyses by H. C. Allen, Department of Chemistry, University of Kansas, Lawrence, Kansas. Analyses Nos. 1, 2, and 4 courtesy A, A, Armstrong. A and B Pipeline Company; No. 3 courtesy E. H. Hatcher. |
||||||||
Most of the gas from the Pennsylvanian pools of southeastern Kansas includes larger amounts of ethane than the gas at McLouth, but the gas from many pools in northeastern Kansas consists almost entirely of methane. The ethane content of the gas in the McLouth field is therefore intermediate between that accompanying the high-gravity oil in the fields of central Kansas and that in the "shale gas" fields of the northeastern part of the state. It is of interest to note that the gas accompanying the oil from the Mississippian limestone in the McLouth pool has an ethane content of only 5.13 percent. H. C. Allen (1929) of the Department of Chemistry, University of Kansas, has pointed out that the proportion of ethane in a gas pool varies directly with the distance of the gas from its contact with oil. This relation is substantiated by the few samples of gas available from the McLouth pools. Samples Nos. 1 and 2 which are on the crest of the McLouth pool contain respectively only 0.86 and 0.94 percent ethane. No. 3, with 3.73 percent ethane, is a well in the North McLouth pool two locations from wells yielding oil in the base of the McLouth sand. No. 4, with 2.69 percent ethane, is an edge well on the northeastern edge of the McLouth pool in the St. Louis limestone. The-gas accompanying the oil in the McLouth pool, No. 5, contains 5.13 percent ethane. No. 6 is the analysis of gas from the upper part of the undifferentiated Burlington and Keokuk in the Jackson No. 1 Bowers well. This well was marginal to the oil pool and found water in the dolomite. The low ethane seems to reflect its distance from the oil. The incombustible residue (chiefly nitrogen) is relatively high but the helium content is low. Dr. H. P. Cady of the Department of Chemistry, University of Kansas, analyzed two samples of gas from the McLouth field, and found only 0.25 percent helium in one and 0.30 percent helium in the other. The relatively high incombustible residue, which varies from 1.45 to 8.66, results in a reduction of the heating value of the gas somewhat below that of other gas fields in eastern Kansas. The average heating value of the gas from the three wells representing the bulk of the gas run from the field is 964 B.t.u.
Figure 20—Charts showing pressure decline in gas pools of the McLouth field. A, Pressure decline curve of the McLouth gas pool. B, Pressure decline curve of the North McLouth gas pool. C, Pressure decline curve of the Ackerland gas pool. Numbers refer to wells listed in well index (table 27).
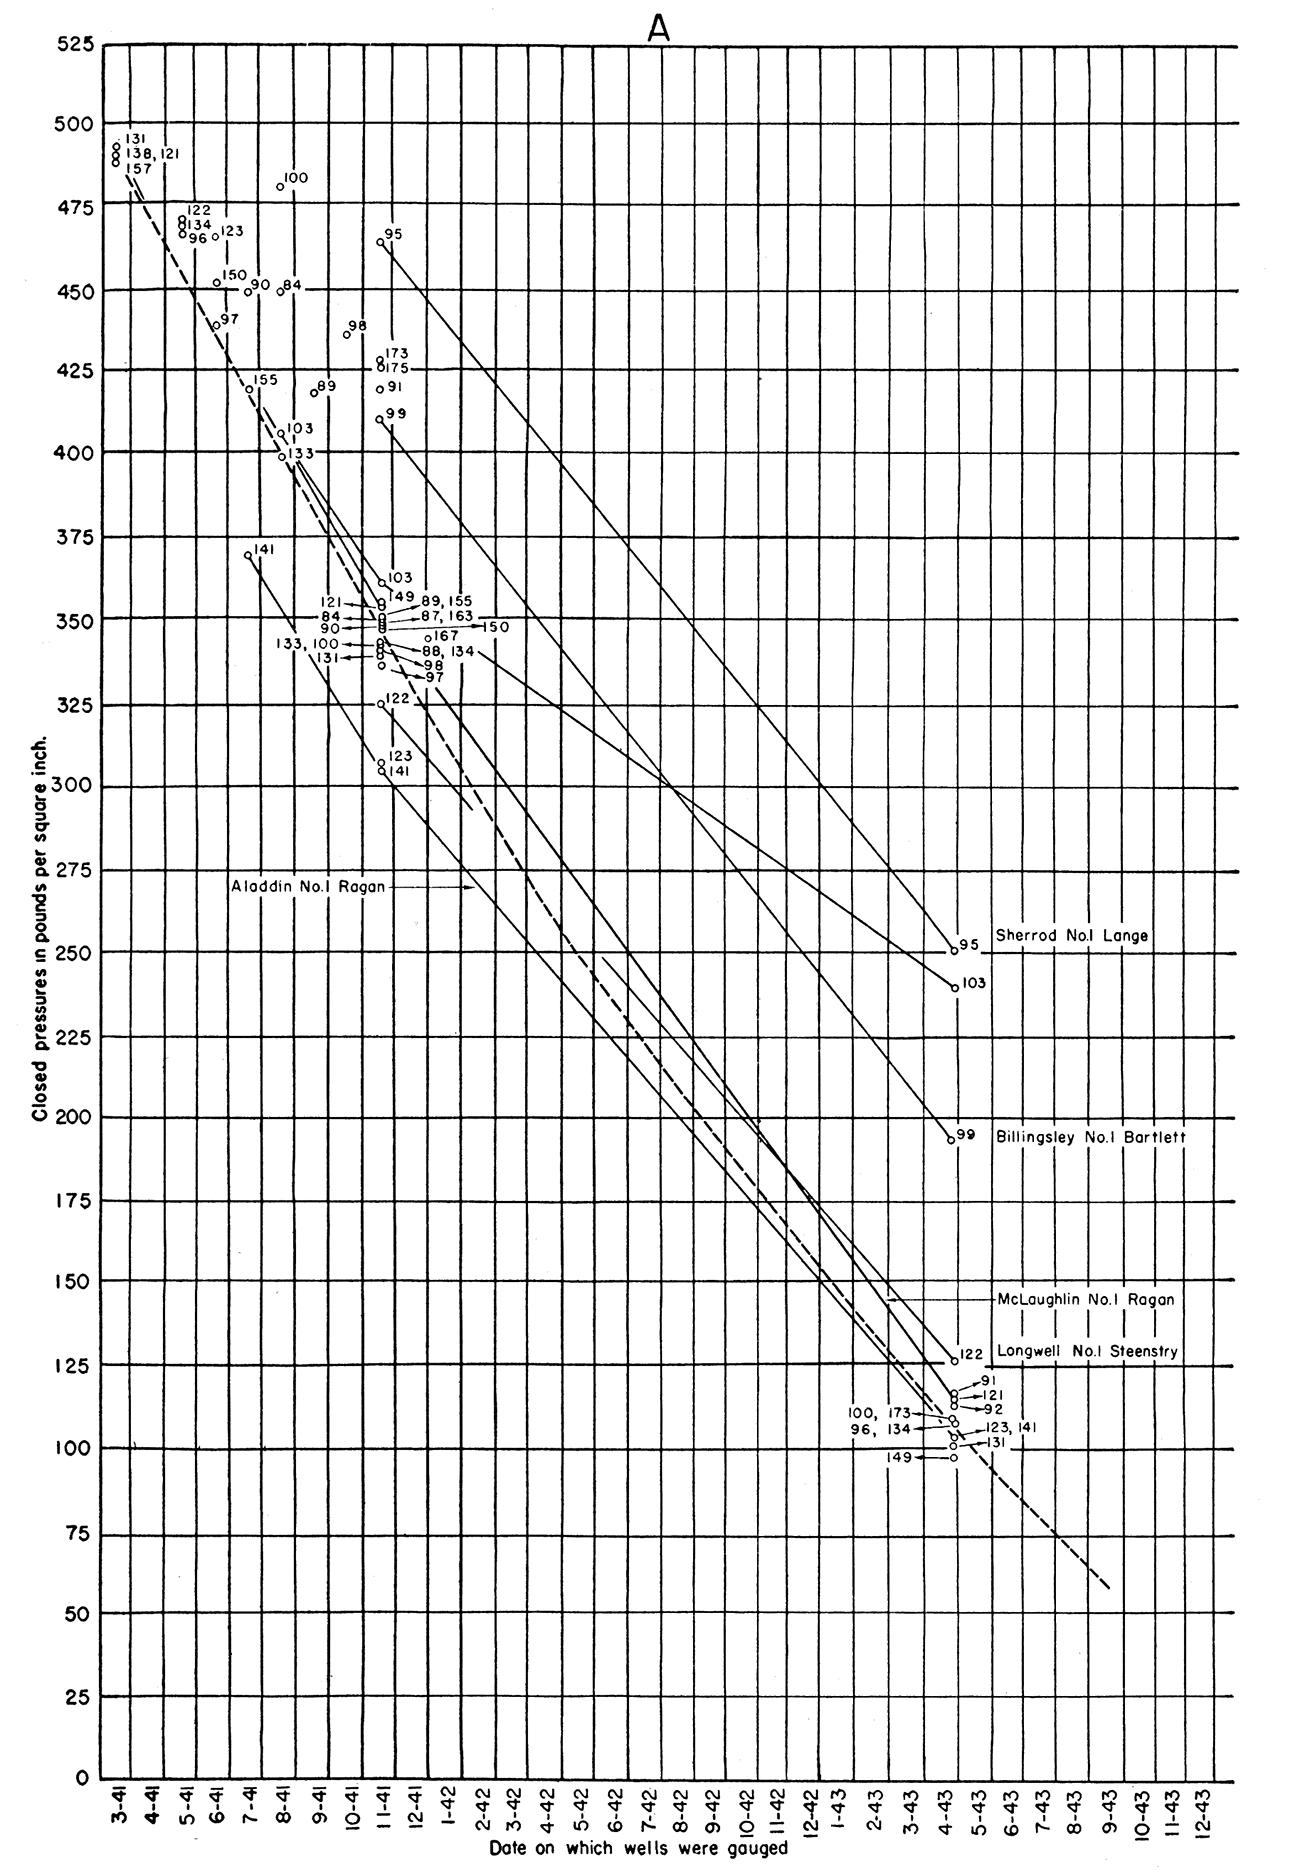
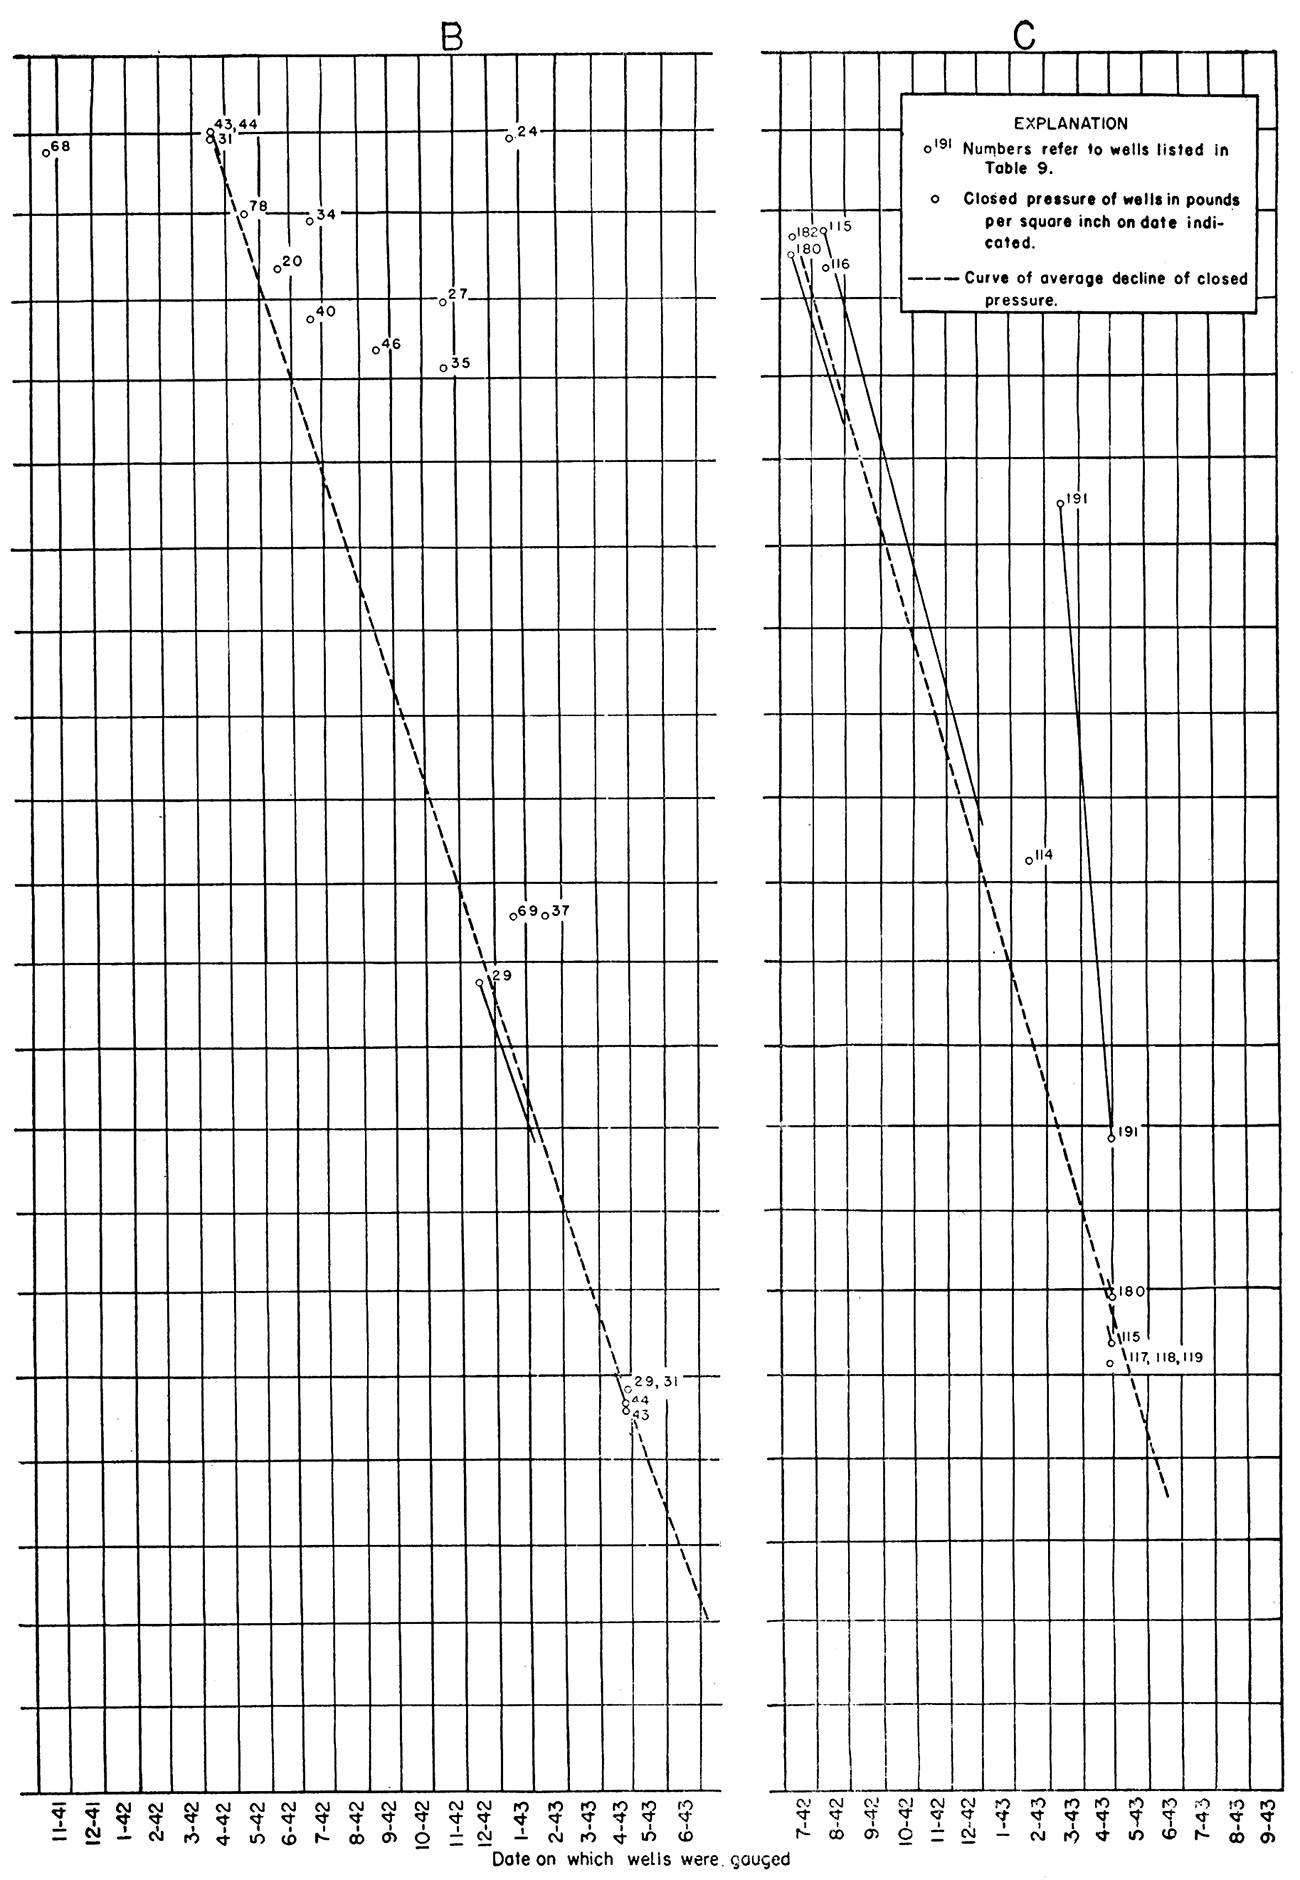
Future Development of Oil in the McLouth Field
The oil-producing area in the McLouth sand in the Bankers Life pool (sec. 3, T. 10 S., R. 20 E.) is separated from the gas-producing area to the north in the same section by a structural displacement (either a fault or a monoclinal fold) in the Mississippian limestone. This displacement, initiated before Pennsylvanian time, was revived before the deposition of the McLouth sand and seems to have been active during its deposition and seemingly afterward also, although it dies out toward the surface.
The oil occurs on the lowered side of the displacement and, as has already been pointed out in the chapter on Distribution of gas, tar, oil, and water in the McLouth sand, the oil on the lowered extension of the semidetached dome in sec. 3 does not rise above the level of the contact of the gas and tar in other parts of the pool (regional dip eliminated). Gas accompanies the oil only in amounts sufficient to operate the pumps.
It is not known whether the Mississippian rocks underlying the Bankers Life pool contain oil, but if the oil-water contact was originally (regional dip eliminated) at the same level as in the Mississippian limestone in the McLouth oil pool, the limestone immediately below the Bankers Life pool is structurally too low for oil. The crest of the Mississippian structure north of the fault may, however, be productive. The sand in the Bankers Life pool abuts against the plane of displacement, and channels for upward migration of deeper-seated oil, either vertically or with lateral components, must have been available in the shattered zone. No oil is found in the McLouth sand above the fault in secs. 4 and 5 because in this area the sand is impervious and provides no reservoir directly above the fault for either gas or oil.
The May Dick well in the northern part of the North McLouth pool is 3% miles distant from the Mississippian oil pool beneath the McLouth anticline. The oil in this well, as shown by the Hempel analyses, is similar to oil in the McLouth anticline. The oil is of slightly lower gravity but has a slightly higher pour point and a higher viscosity than oil from the McLouth pool. It seems probable that the oil from the May Dick well is also the result of escape from a deeper source, although the channels of escape have not been determined. Oil in small amount occurs in the McLouth sand in a number of other wells, most of which are on the flank of the gas area. In the Ackerland pool, three gas wells on the crest of the anticline are producing some oil from the McLouth sand and oil is being produced from the basal sandy zone in two wells low on the east flank. The Ackerland pool is bounded on the north by a sharp displacement.
It seems probable, therefore, that oil may be found in the Mississippian rocks beneath the Ackerland gas pool under conditions similar to those in secs. 4 and 5 and beneath at least some of the other structural crests revealed by the structure of the McLouth sand. It is probable, however, that not all the domes shown will be productive and that some will prove to be of limited areal extent. Possibilities for oil production in the Devonian limestone have not been exhausted.
Prev Page—Cherokee and Distribution || Next Page—Conclusions
Kansas Geological Survey
Comments to webadmin@kgs.ku.edu
Web version July 2019. Original publication date June 1944.
URL=http://www.kgs.ku.edu/Publications/Bulletins/53/08_prod.html