![]()
Prev Page--Land Subsidence Areas || Next Page--Conclusions
Part III: Land Subsidence Areas Associated with Oil and Gas Operations in Kansas
General Statements
Land subsidence: a rare event
Eight areas of land subsidence associated with salt dissolution due to oil and gas operations in Kansas are known to the author. They are mapped in Figure 3. Within the State of Kansas, an estimated 80,000 oil and gas test holes have been drilled through the Hutchinson Salt Member of the Permian Wellington Formation. Over several years, a thorough search for subsidence areas caused by dissolving salt in connection with oil operations disclosed only these eight examples. This is a ratio of one land subsidence area for each 10,000 oil and gas test holes penetrating the Hutchinson Salt. Land subsidence due to this cause may, therefore, be considered as a rare event related to oil and gas operations. Its severity, however, under proper geological conditions must not be discounted.
Similarity to subsidence areas due to salt mining
In appearance, size, and variation in time frame, the oil-related subsidence areas closely resemble the five previously described surface subsidence areas associated with solution mining of salt. The most conspicuous difference is that in the oil and gas related land subsidence areas all dissolved salt is transported downward to a suitable permeable zone. Because the dissolved salt is not produced at the surface, as in salt operations, we thus have no directly visible evidence of salt, or of saturated brine resulting from the dissolution of the rock salt.
Related to salt water disposal systems
Although some salt dissolution does occur during the drilling of wells, it is of limited extent and, because of limited volume, is not expected to have caused land subsidence. Likewise, after drilling ceases, whether the hole is abandoned as "dry" or completed as an oil well, little or no additional dissolution of salt occurs if the hole has adequate casing cemented in place opposite fresh water zones. This practice was adopted by the industry and has been required since 1935 by state regulations. The rare instances of land subsidence due to salt dissolution associated with oil and gas activity have all been caused by the disposal of produced oil-field brines, undersaturated as to sodium chloride, by reinjecting them into deep aquifers through salt water disposal wells with corroded or faulty casing allowing uncontrolled dissolution of salt. To aid in understanding this situation, oil production practices employed in central Kansas are briefly discussed in general terms, particularly as regards disposal of brines produced with the oil.
Oil production, central Kansas
Oil production in the study area (Figs. 1 and 3, shaded area of 10 counties) dates from the discovery of the Fairport Oil Field in western Russell County in 1923. The underground reservoirs from which vast quantities of oil were produced in the central Kansas oil fields over this 53-year period are all brine aquifers. Oil in them is associated with reservoir brines which are produced in decreasing amounts in the dissolved gas-drive oil reservoirs, and in increasing amounts in the water-drive reservoirs as the oil wells become older. The Arbuckle dolomite, reservoir for perhaps 75 percent of the oil produced in the study area, is an enormously large aquifer; hence Arbuckle oil reservoirs have a strong water drive. Wells producing from the Arbuckle Group (Walters, 1958) are seldom abandoned because they run out of oil, only because it becomes no longer profitable to pump and dispose of so much brine. Scores of Arbuckle wells in the Chase-Silica Oil Field each produced 500 barrels or more of salt water each day, along with oil in amounts decreasing to one percent for years prior to abandonment.
The State of Kansas Department of Health and Environment, the state agency charged with supervision of waste brine disposal operations, has long-established requirements that brines be disposed underground in salt water disposal wells. These wells are commonly completed in the Arbuckle dolomite, and frequently take large volumes of brine by gravity flow. A single Arbuckle salt water disposal well in the Tobias Oil Field of eastern Rice County, for example, disposes brine pumped by 50 Arbuckle oil wells, most producing over 100 barrels of brine each, or over 5,000 barrels of brine per day. The well takes the brine by gravity flow through approximately 3500 feet of plastic-coated 5 1/2-inch casing used as tubing. One can bear the roar of the falling water while standing many feet distant from the disposal well. The energy input into such a salt water system is enormous. Here, 50 large motor-driven pumps lift oil and brine from 3350 feet, then the separated brine flows horizontally in a gathering system, followed by gravity drop of the brine through the same 3500 feet.
The disposed brine is unsaturated as to chlorides. The average of 33 Arbuckle brine analyses from the Chase-Silica Oil Field (Martin, 1968) is 13,870 ppm chlorides. This figure is quite low as compared with 98,000 ppm chlorides for a ten percent salt solution (common in drilling mud), or 260,000 ppm chlorides in a saturated solution. There is tremendous capacity for this disposed brine to dissolve more salt. Here then in the disposal wells is the potential for appreciable salt dissolution--high energy input, large volumes of water undersaturated as to chlorides, and an enormous brine outlet in the Arbuckle dolomite. Moreover, the waste brines are corrosive to metals; the Arbuckle brines characteristically contain dissolved H2S.
The undetected corrosion of the casing opposite the salt section has in a few instances permitted the downward flowing undersaturated brines to gain access to the salt. The high energy input extending over many years of disposal well operation has in these cases permitted dissolution of sufficiently large quantities of salt to cause progressive upward collapse of the rock layers culminating in surface subsidence. This process is described in connection with the Panning Sinkhole. Generally, with the abandonment of all of the oil wells in the oil field, and the plugging and abandonment of the disposal wells, the energy input is curtailed, circulation is terminated, dissolution ceases, and subsidence at the land surface declines, eventually to zero. Important exceptions occur in western Kansas, where brine-bearing aquifers (Cretaceous Cheyenne sandstone and Permian Cedar Hills sandstone) are present above the salt. These aquifers are not required by state regulation to be isolated by surface casing as are fresh water aquifers. They were utilized for many years as shallow salt water disposal zones. Undersaturated brines from these aquifers flow downward across the salt through old improperly plugged boreholes. Gravity provided, and continues to provide, the energy input into such a dissolution system; hence surface subsidence continues at the Crawford and Witt Sinks even though most of the oil wells have been plugged and abandoned.
In the case of the two easternmost sinks (Fig. 3), the Lovett and Pierce Sinks, surface subsidence was caused by disposal of oil-field brines at shallow depths (now illegal) into the Hutchinson Salt itself within the natural dissolution zone, or "Wellington lost circulation zone" of drillers, described [in Part I]. The disposed undersaturated brine dissolved additional salt, resulting in surface subsidence.
Oil-field subsidence areas
The eight subsidence areas are listed in Table 1. Considerable information is recorded for the Crawford and Witt Sinks in the Gorham Oil Field, which affect U.S. Interstate Highway 70, west of Russell, Kansas. Subsidence has been precisely measured by detailed surveying for the eleven years since the highway was built in 1965-66, and is known from pre-highway vertical aerial photographs taken in 1957, or a time span of 20 years. Because of extensive subsidence, it was necessary to rebuild one mile of both lanes of the highway in 1957, at a cost of about $250,000, or an average maintenance cost of about $1,000 a week. Subsidence is continuing, but at a diminishing rate.
The Panning Sinkhole, located in the Barton County portion of the extensive Chase-Silica Oil Field, received much publicity in 1959. It closely resembles the 1974 Cargill Sinkhole in size and geological setting. Both developed rapidly and dramatically in a matter of hours, receiving widespread news coverage. It is described in some detail with quantitative data on fluid movements.
The remaining five land subsidence areas related to oil and gas operations subsided slowly, and had but minimal economic and environmental impact, and hence only the relatively meager facts of their occurrence are preserved.
Possible undetected oil-related subsidence areas
It is possible, but unlikely, that there are undetected oil-related subsidence areas in central Kansas, other than the eight listed in Table 1. Surface indications of salt dissolution at depth may go unnoticed. Even leaks in the casing in salt water disposal wells opposite the salt section may be undetected if the well continues to take brine in undiminished amounts. Ground cracks, an early indication of subsidence, show best in paving or solid material, but not at all in plowed ground. In central Kansas, precise level surveys are lacking; routine oil well elevations are accurate only to plus or minus one foot. The oil fields are typically located in agricultural areas where the possibility of detection of subsidence is minimal. This is in contrast to the urban situation described by Landes and Piper (1972) where salt is produced near the City of Detroit. There, many precise reference point elevations were surveyed in units of 1/1000ths of a foot, recorded, mapped, and graphed semi-annually or annually. Subsidences of one-fourth inch (0.021 feet) per year were recognized and considered acceptable in that area. In agricultural areas in central Kansas, slow subsidence of one foot may easily go entirely unnoticed. It is, however, unlikely that subsidence of two feet or more will go unnoticed because of interference with agriculture by ponding of water in the low spots, and because officials of the state regulatory agencies systematically inspect oil leases checking for infractions in water disposal, surface casing, and hole plugging.
Table 1--List of Land Subsidence Areas Associated with Inadvertent Salt Dissolution in Oil and Gas Test Holes, Central Kansas.
| Crawford No. 12 Crawford No. 16 Sec. 2, T. 14 S., R. 15 W. Twin wells in C NW NW SW Gorham Oil Field Russell County, Kansas |
These twin wells, 50 feet apart, are the site of more than 26 feet of settling affecting both lanes of Interstate Highway I-70. The Kansas Highway Commission drilled a test hole between these wells. The area is precisely surveyed, intensely studied (Burgat and Taylor, 1972), and affords conclusive evidence that subsidence is due to dissolution of salt in old oil and gas test holes. Discussion... |
| Witt No. 1 Sec. 3, T. 14 S., R. 15 W. C NW NW SE Gorham Oil Field Russell County, Kansas |
The Witt No. 1 is next to the south right-of-way fence of U.S. I-70. Subsidence of 17+ feet around the well makes a gathering basin for rainwater which drains directly off the highway into the well bore, exposed in a gully. Discussion.... |
| Hodge No. 2 Sec. 25 T. 20 S., R. 6 W. C S2 NW NE Welch-Bornholdt Oil Field Rice County, Kansas |
There is a mature shallow dished depression with a small pond at this location. Gilbert Toman (personal communication) said this was due to settling of the ground around the old disposal well. |
| Hilton No. 6 Hilton No. 7 Sec. 6, T. 20 S., R. 9 W. C NW NE SW Chase-Silica Oil Field Rice County, Kansas |
Abandoned oil-field brine disposal wells 200 feet apart. Well 6 was used until Oct. 1951, and Well 7 until June 1965. The subsidence area around these holes appears stabilized. There is a shallow fresh water lake in the gentle depression. Discussion.... |
| Berscheit Heirs No. 14 Sec. 6, T. 20 S., R. 10 W. C SW SW NW Chase-Silica Oil Field |
N. W. Biegler (personal communication) was present at the site during plugging of this Arbuckle disposal well in April 1972. The ground was then sinking. Discussion.... |
| W. M. Panning No. 11 Sec. 2, T. 20 S., R. 11 W. C SW SE SE Chase-Silica Oil Field Barton County, Kansas |
On April 24, 1959 at 9:00 a.m., the landowners observed a cavity forming around this well. It developed into a pit 300 feet in diameter within a few hours time. At present the site is a fenced fresh water lake used as a game preserve. Discussion.... |
| Daisy E. Pierce No. 5 Sec. 33, T. 23 S., R. 4 W. C NE SE NE Burrton Oil Field Reno County, Kansas |
Gilbert Toman (personal communication) reports disposal into this shallow well in 1968 caused about four feet of settling of the section line road. The well is 10 miles east and south of Hutchinson, Kansas, near Well 17 of Figure 2, within the zone of natural salt dissolution. Depth to salt is about 400 feet. Well abandoned. Road rebuilt. Appears stable. |
| Lovett SWD No. 2 Sec. 14, T. 20 S., R. 4 W. C SW SW SW Groveland South Oil Field McPherson County, Kansas |
This shallow brine disposal well, drilled in 1958, encountered salt at 489 feet total depth, with 7-inch casing set at 487 feet. Brine was introduced directly into the salt section within the zone of natural salt dissolution. Subsidence area, about 100 feet in diameter, is east of the section line road and north of the creek. The disposal well and all adjacent oil wells are now abandoned. N. W. Biegler (personal communication) considers the area stabilized. |
Salt Dissolution in Oil and Gas Test Holes During Drilling
Methods of investigation
Salt dissolution in oil and gas test holes during drilling can be measured by (1) study of caliper logs, (2) calculation of cement volume in holes in which casing is cemented through the salt section, or in the few unusual holes plugged with cement through the salt section, (3) by study of recorded geophysical logs, especially the neutron log which is highly sensitive to hole size and "washes out" (loses character) in enlarged sections of the hole, (4) by information from "fishing" operations opposite the salt, and (5) by recording and calculating volume and the increased salinity of the drilling fluid.
Caliper logs
The first method, use of caliper logs, is by far the most important. In Figure 16, caliper logs from four holes drilled through the Hutchinson Salt with rotary tools were reproduced. The wells are identified in Table 2. These four logs provide examples of:
- Hole out-to-gauge with near zero alteration of the borehole by drilling;
- Carrot-shaped hole due to mechanical abrasion, no dissolution;
- Hole moderately enlarged by abrasion and by dissolution of salt;
- Extensive hole enlargement by dissolution of salt.
Table 2--Index to Boreholes "A", "B", "C", "D" of Figure 16. All are in Rice County, Kansas.
| Borehole "A" |
|---|
| USAEC Test Hole No. 2 Section 35, T. 19 S., R. 8 W. Drilled and cored by the U.S. Corps of Engineers 1970 Hutchinson Salt: 755.0 feet to 1002.5 feet Cored from 737.9 feet to 1099.6 feet Diameter of cores = 4"; Reamed to 6 1/4" Caliper Log shows borehole out-to-gauge Salt-saturated brine and low-water-loss starch mud Nine days spent coring and/or reaming from base of 8 5/8" surface pipe at 247.5' to 1216' T.D. |
| Borehole "B" |
| USAEC Test Hole No. 1 Section 26, T. 19 S., R. 8 W. Drilled and cored by the U.S. Corps of Engineers 1970 Hutchinson Salt: 815.1 feet to 1084.1 feet Cored from 0 feet to 1300.8 feet Diameter of cores = 6"; Cored with 7 3/4"' core bit Salt-saturated brine and low-water-loss starch mud Caliper Log shows hole is carrot-shaped due to abrasion Twenty-five coring days from base of 8 5/8" surface pipe at 309.5' to 1300.8' T.D. |
| Borehole "C" |
| Barnett Oil Company, No. 1 Wright Section 35, T. 19 S., R. 8 W. Drilled and cored in Oct. 1971 Hutchinson Salt: 758 feet to 1036 feet Four cores and four drill stem tests of fluid Drilled with 7 7/8" bit Caliper Log shows maximum hole size 13 1/2" Fresh water and starch mud Fourteen drilling days from base of 8 5/8" surface pipe at 223' to 3583' T.D. |
| Borehole "D" |
| Woodman & Iannitti, No. 2 Stockham Section 34, T. 19 S., R. 8 W. Drilled in Nov. 1970 Hutchinson Salt: 775 feet to 1062 feet No cores. No drill stem tests Drilled with 7 7/8" bit Caliper tool fully extended at 15 inches Clear fresh water and no mud additives Six drilling days from base of surface pipe at 179' to 3466' T.D. |
Figure 16--Caliper logs from four holes in Rice County, Kansas. Figures indicate hole diameter in inches and well depth in feet. Top and base of Hutchinson Salt indicated. Wells are identified in table 2.
For Borehole "C" an approximate calculation of hole enlargement during drilling can be made from the caliper log. The hole was drilled with a 7 7/8-inch bit. The average hole diameter above and below the salt measured about 10 1/2 inches. The average hole diameter through the salt section measures approximately 12 1/2 inches (maximum 13 1/2 inches). We may, therefore, calculate for the 277 feet of salt section a measured hole volume of 236 cubic feet, of which 94 cubic feet were cut away by the bit, 70 cubic feet of rock removed by mechanical abrasion including mud flow erosion, and the remaining 72 cubic feet removed by dissolution of the salt by the fresh water drilling mud. The measured hole is 2 1/2 times (251%) the volume of the cylinder drilled by the 7 7/8-inch bit. A total of 142 cubic feet of rock salt (or 60% of the measured hole volume) was removed by dissolution and/or abrasion. Borehole "C" is not a typical borehole. It was drilled with a bentonite mud program (rather than clear water and native muds) which partially inhibited salt dissolution. Borehole "C" is also illustrated in Figure 17.
Figure 17--Wire line geophysical logs from Wright No. 1, Well "C" of figure 16 and Table 2. Caliper log repeated in mirror image to indicate shape of hole through the Hutchinson Salt, depth 759 to 1036 feet.
Borehole "D" is representative of the usual borehole enlargement due to rotary drilling of the Hutchinson Salt with fresh water. This hole was drilled with a 7 7/8-inch bit. Average hole size above and below the salt is nine inches. The caliper log illustrated recorded a maximum diameter of 15 inches. We may, therefore, calculate for the 287 feet of salt section a minimum hole volume of 333 cubic feet, of which 97 cubic feet were cut away by the bit, 29 cubic feet of rock removed by mechanical abrasion, and the remaining 207 cubic feet removed by dissolution of the salt by the fresh water drilling mud. This figure is too low by an unknown amount, but some order-of-magnitude approximations can be made. First, this log shows, midway through the salt section, two constrictions due to thin anhydrite beds. Second, a repeat caliper log with a maximum diameter of 16 inches (not shown) was run in connection with a density log. It confirmed the two anhydrite beds and indicated the tips of our additional thin shales and/or anhydrite beds in the extra inch of diameter measured, from which it may be inferred that the hole is only a few inches larger in diameter. Recalculation of the minimum volume on the basis of 16 inches maximum recording gives a hole enlargement of more than two diameters and a minimum volume of 372 cubic feet, or a hole enlargement of nearly four times the drilled volume (383 which is still too low by an unknown amount.
Occasionally older caliper logs recording to 36 inches maximum diameter are available. These logs were recorded with four independent legs probing the borehole, but with only the maximum reading recorded. Such logs dating in the 1960s to 1970s seldom record off-scale measurements in normally drilled holes, but show frequent occurrences of holes in the 24- to 36-inch diameter range. The logs, rare in library collections because customers were loath to pay an extra log charge, were abundantly recorded quietly by the log engineers for their own personal use as they became aware of the sensitivity of the early neutron logs (the most common porosity tool then and now) to hole size corrections. Such logs indicate a common hole enlargement during rotary drilling of 7 7/8-inch holes or 9-inch holes to the 24- to 36-inch diameter range, or about three times the drilled diameter.
Cementing experience
A second line of evidence comes from oil well cementing experience. When cementing oil string casing through a salt section drilled with fresh water, an uncommon operation, cementers expect to use an additional 300 to 500 sacks of cement. Slurry volumes vary with types of cement and additives. Portland cement yields 1.18 cubic feet per sack, but with four percent bentonite (commonly used) yields 1.55 cubic feet per sack, or with eight percent bentonite (the maximum commonly used) yields 1.92 cubic feet per sack. For Borehole "D" as a theoretical example, it can be assumed that the "additional" cement will be required for that part of the hole in excess of nine inches in diameter through the salt section. It can then be calculated that the hole size is within the following range; based on cementer's practical experience:
| if filled with 300 extra sacks cement with 4% bentonite |
19 1/4" diameter; |
| if filled with 300 extra sacks cement with 8% bentonite |
21 1/4" diameter; |
| if filled with 500 extra sacks cement with 4% bentonite |
24"' diameter; |
| if filled with 500 extra sacks cement with 8% bentonite |
26" diameter. |
Similar calculations can be made for cement with salt added in varying amounts.
From these order-of-magnitude figures, it may be estimated that the probable hole size in the salt section in Borehole "D" is near 24 inches. If correct, this calculates as 902 cubic feet of salt removed, only 97 cubic feet of which were cut away by the bit, or a volumetric hole enlargement to about nine times the drilled hole volume due essentially to salt dissolution while drilling with fresh water during which the hole became enlarged to a diameter about three times the bit size (7 7/8-inch bit X 3.05 = 24 inches). These deduced figures are the right order of magnitude and give a good approximation of the usual hole enlargement by salt dissolution during modern rapid drilling with rotary tools in the 1960s and 1970s using fresh water and no mud additives as is the common practice in the study area.
An example of a hole plugged with cement through the salt section is the Cook No. 1, dry hole, in Section 27, Township 19 South, Range 8 West, Rice County, Kansas, illustrated in the reentry diagram, Figure 18. The hole diameter is calculated as 19.3 inches through the salt section, or two and one-half times the drilled size of 7 7/8 inches.
Figure 18--Reentry diagram, Imperial Oil Co., Cook No. 1, Sec. 27, T. 19 S., R. 8 W., Rice County, Kansas.
Neutron logs
The sensitivity of neutron logs to hole size provides a third line of evidence of hole enlargement during drilling of the salt section. An example is Borehole "C" of Figures 16 and 17. The caliper curve is drawn in mirror image to give a visual impression of the shape of the hole. Even the measured small amount of hole enlargement from 7 7/8 inches to a maximum of 13 1/2 inches was sufficient to cause the neutron log to lose character through the salt section. This combination of gamma-ray, neutron, and resistivity logs, but without the caliper log, is the most commonly recorded log suite in oil and gas test holes in the study area. The flattening of the neutron curve in conjunction with low gamma and high resistivity readings on such logs provides evidence that salt was drilled and partially dissolved, but does not provide useful quantitative evidence of the amount of hole enlargement due to dissolution of salt. See Figure 6 for an example of a neutron log in salt in an out-to-gauge hole.
On occasion, logging engineers running logs in hole after hole, as for example in a salt solution well field, are able to approximately calibrate the sensitivity of their neutron log by comparison with known hole sizes from caliper or sonar surveys. One logging engineer has determined that his 34-inch scintillometer-recorded neutron curve "washed out" completely at a hole diameter of 34 inches, and his similarly recorded gamma-ray log "washes out" in holes larger than 36 inches in diameter. His experience with older Geiger-Muller counter tools indicated figures a little larger. He sometimes applies this aspect of log failure to locate "cavities" in cased salt solution holes. The neutron logs usually available to the writer do not permit quantitative hole measurement but record hole enlargement by salt dissolution.
Recovery of objects, or tools, termed "fishing"
"Fishing" operations give a fourth method of approximating hole diameter due to salt dissolution while drilling. During the period of slower drilling by rotaries, and less or no use of commercial mud additives, there are instances of great hole enlargement during drilling. Holes drilled by rotary in the 1940s had many "fishing jobs" to recover twisted-off drill pipe. Drill pipe parted opposite the salt section (a common position) was difficult to recover because the "fish" fell to the side of the hole back in the solution cavern under shale ledges, and, thus concealed, could not be retrieved. Fishing tools such as a "knuckle joint" which extended outward as much as five feet were slowly rotated to sweep the salt cavern in a sometimes successful effort to connect with the pipe and move it to a position centered in the well bore for recovery. Some salt washouts where the knuckle joint tool touched no iron were believed to be enlarged to more than 10 feet in diameter during drilling, an enlargement of over 13.3 diameters (9-inch bit) with a volume increase to over 178 times that of the cylinder cut by the bit.
Calculation of salinity of the drilling fluid
While method five, calculation of volume and salinity of the circulating fluid, is routine in solution mining of salt, it is of limited applicability to oil and gas well drilling. Commonly the hole is started with fresh water which becomes salt saturated during drilling but which is not then replaced with fresh water. Rather, as the hole is deepened and hole volume increases, more fresh water is added which in turn becomes salt saturated. An approximation of the amount of salt dissolved during drilling could be made if the volume of fresh water was accurately known. Such data is difficult to obtain, however, because water trucked to rotary rigs is billed on a trucking time basis, not a water volume basis. Often the water hauler will substitute a load of salt water (oil-field brine) if more easily available when roads are muddy, etc.; hence this is not a meaningful source of data.
Holes drilled with cable tools
Instances of zero or near zero hole enlargement by salt dissolution during drilling are limited to the rare salt test holes drilled with brine saturated as to sodium chloride and to old-time cable tool holes. The latter, though often of large drilled diameter in the salt section (18 inches or more), used small amounts of drilling water. Actual samples of the salt itself were recovered and the holes were not appreciably enlarged by salt dissolution during drilling.
In conclusion, salt dissolution in oil and gas test holes during drilling may range from no dissolution (brine drilled rotary holes and cable tool holes) to extensive dissolution (more than 10 feet in diameter), but in modern rotary drilled holes such enlargement is commonly of the order of magnitude of three times the diameter of the drill bit or nine plus times the volume of the drilled hole as derived by the direct and indirect measurements discussed.
Salt Dissolution in Oil and Gas Test Holes after Drilling
Method of investigation
The subject is less difficult to investigate than one might assume on first impression. When information from abandoned holes reentered years later (Fig. 19), plus information from cased hole logs, is combined with knowledge of the hydrological principles involved, the conclusion is reached that, most commonly, no salt dissolution occurs after drilling ceases, shutting off that source of energy input. To understand why this is so, we must consider the four essential components--salt, water, energy, brine outlet--with the added factor of a 50-year time interval for extensive oil and gas test well drilling in the study area.
Figure 19--Reentry diagram, Imperial Oil Co., Pulliam No. A-1, Sec. 35, T. 19 S., R. 8 W., Rice County, Kansas.
The salt itself has not changed--it is still in place where it has been for over 200 million years, but now with its protective shale envelope pierced by boreholes. Water, including fresh water, is usually present in Kansas in aquifers penetrated by the drill at depths more shallow than the salt. A constant natural energy source, gravity, is available to move the fresh water down the drilled hole past the salt section, unless impeded by the well plugging materials or by cemented surface casing left in the hole (required in Kansas oil and gas test holes since 1935). Other aquifers (sometimes termed "salifers") below the salt contain brine in varying concentrations, but unsaturated as regards sodium chloride. Absent in most cases is the critical factor of a brine outlet; hence post-drilling salt dissolution usually does not occur. Exceptions are old test holes with no surface pipe cemented through the shallow fresh water aquifers and eight instances of salt water disposal wells (high energy input, high volume of fluid flow) with corroded leaky casing where inadvertent extensive salt dissolution has resulted in subsidence at the surface. Also excepted is approximately ten percent of the study area including the Gorham Oil Field, site of the Witt and Crawford Sinks, where limited post-drilling salt dissolution is believed to be continuing at the present time.
To investigate post-drilling salt dissolution in oil and gas test holes we must briefly consider the hydrology of the aquifers drilled and their ability to flow from one to the other across the salt face through man-made boreholes with only gravity as an energy source.
Hydrology
To summarize the hydrology of multiple aquifers in a 4,000-square mile study area in Russell, Lincoln, Barton, Ellsworth and Rice Counties (Fig. 3) penetrated by 22,200 oil and gas test holes in a brief but meaningful way, we begin with a specific example, applicable in principle to 90± percent of the area, then discuss the difference in the other 10± percent of the area. In general, the aquifers drilled at depths less shallow than the salt are fresh-water-bearing; in general, the redbeds above and below the salt and the salt itself are nonaquifers or aquitards with very low transmissibility; and, in general, the multiple aquifers below the salt (some of which are oil and gas reservoirs) are brine-bearing, but all brines are unsaturated as to sodium chloride at reservoir temperatures and pressures.
Cross Section C-D, Figure 4 (list of wells and shaft, Appendix B), in Rice County, Kansas shows in natural scale (vertical and horizontal scales equal) the relative position of the aquifers (indicated by the letter "W" on the cross section) here discussed as a specific example. Omitted from the cross section are the many shallow fresh water test wells drilled by the Kansas Geological Survey (Bayne and Ward, 1971). Drill stem test data from Wells 6 and 9, cable tool water information from Well 8, and potentiometric surface data from shallow wells are combined in Table 3.
Table 3--Aquifer Data, Rice County, Kansas.
| Aquifer Number |
Depth (Base) Feet |
Sea Level Datum |
BHP psi |
Pot. Surface |
Sp. Gr. | Water Quality (ppm) | ||||
|---|---|---|---|---|---|---|---|---|---|---|
| Chlorides | Total Solids | |||||||||
| Surface water--rain | 1 | 0 | +1694 | +1694 | 1.000 | 0± | 0± | |||
| Quaternary | ||||||||||
| Pleistocene--sand, gravel | 2 | 50 | +1644 | +1680 | 71 | 445 | ||||
| Cretaceous | ||||||||||
| Dakota--sandstone lenses | 3 | absent | ||||||||
| Kiowa--sandstone lenses | 4 | 170 | +1524 | +1680 | 78 | 488 | ||||
| Permian | ||||||||||
| Nippewalla Group "redbeds" | aquitard | |||||||||
| Sumner Group "redbeds" | aquitard | |||||||||
| Hutchinson Salt Member | aquitard | |||||||||
| Chase Group | ||||||||||
| Florence dolomitic limestone | 5 | 1451 | + 243 | 435 | +1249 | 1.162 | 155,000 | 270,000 | ||
| Pennsylvanian | ||||||||||
| Wabaunsee Group limestone | 6 | 2075 | -344 | +1350 Est. |
||||||
| Shawnee Group | ||||||||||
| Lecompton limestone | 7 | 2604 | -910 | 1035 | +1480 | 1.146 | 132,000 | 237,000 | ||
| Douglas Group sandstone | 8 | 2823 | -1129 | 1150 | +1527 | 1,145 | 132,000 | 234,000 | ||
| Lansing-Kansas City Group limestone | 9 | 3043 | -1349 | 1167 | +1346 | 1.135 | 127,000 | 195,000 | ||
| Cambro-Ordovician | ||||||||||
| Arbuckle Group dolomite | 10 | 3526 | -1783 | 1221 | +1037 | 1.033 | 24,000 | 41,000 | ||
Aquifer 1 of that table, "rain," was not entered to be facetious. In the Gorham Oil Field one abandoned oil well serves directly as a storm sewer for rainwater runoff from Interstate Highway 70, draining a closed subsidence basin caused by salt dissolution at the Witt Sinkhole. Aquifer 3, the Dakota sandstone, is absent in the cross section but widely present to the west as a shallow fresh water aquifer protected by surface casing. For the other shallow Quaternary and Cretaceous fresh water aquifers (Aquifers 2 and 4 in Table 3) the potentiometric surface was measured directly in water wells drilled for that purpose by simply measuring the depth to water in the open hole and correcting for well elevation. For Aquifer 6, the cable tool drillers' log of Well 8 recorded "three bailers of water per hour at 2075 feet." All other aquifer data for brines below the salt section is derived from fluid recoveries and charts of bottom hole pressures recorded while using the drill pipe with one or more packers as temporary casing isolating the zone. Such a test, called a drill stem test (DST), gives accurate pressure information and provides recovery of the actual formation fluid, although in part contaminated by drilling fluid. DST bottom hole pressures (BHP) are here converted to the potentiometric surface figure of hydrologists by dividing the BHP by .433 psi per lineal foot, the weight of a column of fresh water specific gravity 1.000; and correcting the answer to a sea level datum. For example:
| A. Chase Group, Florence Limestone, Aquifer 5 | ||
| From an elevation of | 1694 feet above sea level | |
| at a depth of | 1451 feet in the well bore | |
| or a datum of | +243 feet above sea level | |
| the BHP will support | 1006-foot column of fresh water (435 psi/.433) |
|
| or a potentiometric surface of | +1249 feet above sea level. | |
| B. Shawnee Limestone | ||
| From an elevation of | 1694 feet above sea level | |
| at a depth of | 2604 feet in the well bore | |
| or a datum of | -910 feet below sea level | |
| the BHP will support | 2390-foot column of fresh water (1035 psi/.433) |
|
| or a potentiometric surface of | +1480 feet above sea level. | |
The resulting derived and measured potentiometric surface figures are graphed in Figure 20. Hydrologists who are accustomed to working with fresh water in unconfined reservoirs find the simple concept of potentiometric surface adequate for much of their work as it is axiometric that flow (by gravity downward) is from higher to lower values on the potentiometric surface. By simple inspection of Figure 20, it is apparent that Aquifers 1, 2, and 4, all fresh-water-bearing and located above the salt, will flow into any or all of Aquifers 5 through 10, if a suitable borehole is available, with a "head" difference obtained by subtracting the potentiometric surface figures and such How will be across the salt face if borehole conditions permit.
Figure 20--Static fluid levels in Aquifers 1 to 20 of Table 3, and Cross Section C-D, Fig. 4. Each column depicts a hypothetical well with casing bottomed in an individual aquifer. Shading indicates static fluid level, dashes depict higher level (potentiometric surface) to which fresh water would rise.
But as regards actual flow from one deeper aquifer to the other, the potentiometric surface can be misleading. Hydrologists working in the future with confined aquifers (or "salifers") of varying salinity, will have to rely more on pressure data because in confined reservoirs the flow direction may be up, down, or sideways. For example, Aquifer 9, Kansas City, has a higher potentiometric surface (+1346) than Aquifer 5, Chase Group (+1249), but the actual flow direction is the opposite of that indicated by the potentiometric surface figures due to differences in the specific gravity of the contained brines.
The potential flow directions for Aquifers 1 through 10, if interconnected, may be derived graphically. The construction of such a graph is shown in four steps. Figure 21 shows a graph of a DST of Aquifer 5, Chase Group dolomitic limestone, with depths in feet and position relative to sea level as ordinate and BHP in psi as abscissa. The actual fluid fillup data is recalculated as a static fillup of brine (not rotary mud). The pressure gradient is then drawn. In the graph, Figure 22, the subsurface position of the salt is plotted and the position of three deeper aquifers is shown.
Figure 21--Graph of drill stem test data, Chase Group.
Figure 22--Graph showing position of Hutchinson Salt relative to four aquifers.
Figure 23 graphs the fillup data and pressure gradients for all four aquifers. Note that the four static fluid levels are all above or within the salt interval which means that if an underground salt operation inadvertently mined into an unknown abandoned and unplugged oil and gas test hole, the mine would be flooded (Lomenick, 1972). Flow from one zone to another, if interconnected by a suitable borehole, will be from higher pressure to lower pressure. Thus at the depth of the Florence Flint, Aquifer 5, brine will flow from it into the borehole, down and into the Kansas City, Aquifer 9. This flow is the opposite of that indicated by the simplistic potentiometric surface data, Table 3, used by hydrologists. Such flow, however, would occur only after flow from the Lecompton and Douglas aquifers, 7 and 8 (in equilibrium with each other), had equalized with the brine in the Kansas City, Aquifer 9. Common static level for all aquifers below the salt, 5, 6 (not shown), 7, 8, and 9, will be slightly higher than +864. Note that flow from zone to zone among these aquifers to equalize pressures does not involve flow across the salt face itself; hence no dissolution occurs even with borehole communication between all aquifers below the salt and above the Cambro-Ordovician Arbuckle dolomite, Aquifer 10, which has by far the greatest capacity to either yield or take fluid.
Figure 23--Graph showing derivation of pressure gradients for four aquifers.
The graph in Figure 24 repeats the previous four pressure gradients and adds a pressure gradient from four DST pressures in the Cambro-Ordovician Arbuckle dolomite in a nearby well, No. 9 (Fig. 4).
Figure 24--Graph of aquifer pressure gradients, Rice County, central Kansas.
For all aquifers interconnected by a suitable borehole, flow direction can be read on the graph and will be from higher pressure (right) to lower pressure (left) until a common static level is reached. Flow from zone to zone to reach equalized static will occur at the aquifer depth level and there will be no flow across the salt face, hence no dissolution of salt.
Note that the pressure data developed in the graphs, Figures 21-24, assume interconnected zones in an open borehole. They are, therefore, valid for all oil and gas test holes in the study area which have properly set surface casing "protecting" (isolating) fresh water aquifers as required by ruling of the Kansas Corporation Commission. This permits the conclusion for all oil and gas test holes, whether "dry holes" in which only surface pipe has been set, or oil wells cased to the pay zone, or abandoned oil wells with a casing stub left in the hole, or salt water disposal wells, that FLUID WILL EQUALIZE IN HOLES HOWEVER PLUGGED OR EVEN NOT PLUGGED AT ALL, WITH NO FLOW ACROSS THE SALT FACE, HENCE WITH NO SALT DISSOLUTION in oil and gas test holes after drilling, provided adequate surface pipe, internally plugged, is cemented in place through the near surface fresh water aquifers. This important conclusion applies to geological conditions over about 90 percent of the study area. It does not apply to 10± percent of the area including the Gorham Oil Field where two additional aquifers, Cretaceous Cheyenne sandstone and Permian Cedar Hills sandstone, occur above the salt and are not required to be "protected" by surface pipe because their contained fluid is brine. This situation can, has, and will cause salt dissolution in oil and gas test holes as discussed in the section on the Witt and Crawford Sinks in the Gorham Oil Field, Russell County.
Because of the critical importance of properly cemented surface pipe, as required of all operators, we will consider briefly the regulations covering the protection of fresh water. Surface casing is required for all oil and gas test holes, its amount is specified, and advance notice of intent to drill is required by the Kansas Corporation Commission. Violations are uncommon to nonexistent. The presence of surface pipe is easily monitored by cased hole logs. Final plugging of abandoned oil and gas test holes is under the direct field supervision of a "state plugger," and notarized well plugging reports showing surface casing are required and permanently filed. Such regulation of hole plugging, and concomitant surface pipe supervision by the state and well record file roes back to 1935. For the period prior to that there was limited supervision on a county-by-county basis from about 1930, prior to which there was no regulation, no protection of fresh water, and no supervised hole plugging. Drilling for oil, and earlier for salt, within the study area extends back to 1888. There are instances, seldom documented, of uncased unplugged early oil and gas test wells in which post-drilling salt dissolution could and did occur. Two such holes are described along with the case history of one other adjacent partially plugged hole.
Case histories--no surface casing
An example of extensive post-drilling salt dissolution in an old test hole due to absence of surface pipe and lack of proper borehole plugging is provided by the Taylor No. 1, total depth 3552 feet in the Arbuckle dolomite, drilled from July 28 to October 10, 1934, in the Center of the NW SE of Section 25, Township 19 South, Range 8 West, Rice County, Kansas. This cable tool dry hole was abandoned prior to state regulation of well plugging and protection of fresh water by surface casing. it is located just east of the abandoned Lyons Arbuckle gas field which Northern Natural Gas Company redrilled for use as an underground natural gas storage reservoir. To ensure proper plugging of old test holes to avoid leakage of valuable stored gas from the Arbuckle reservoir, several abandoned holes were reentered in 1974, including the Taylor No. 1 on the south side of U.S. Highway 56 which was located without difficulty by use of 1938 aerial photographs. Discolored soil marked the location. Bulldozer excavation revealed the old cellar 12-feet deep filled with large concrete rig foundation blocks between which black topsoil was tamped. No surface casing was present. When the bulldozer was 17 feet below the surface, it found a 48-inch hole empty and open. To reenter the hole it was necessary to set 18 feet of 48-inch conductor pipe, then to set 8 5/8-inch surface pipe at 134 feet. Even so, drilling was made more difficult by the presence of Cretaceous sand from 170 to 190 feet, a fresh water aquifer (4 of Table 3). At a total depth of 3495 feet, 5 1/2 hours were required to circulate a sample of cuttings from the bottom. Using this information, Bill Luck (personal communication), field superintendent for Northern, calculated that it required the pumping of 11,000 barrels of fluid to bring the cuttings to the surface. Using this as a minimum estimate of the volume of the old hole, the author calculated an average hole diameter in the salt section from 800 feet to 1060 feet to be 8.43 feet, due to solution removal of salt. Any hole enlargement due to caving of an upper part of the hole would be compensated by filling a lower portion. This is a documented example of an old hole with no surface casing, and no plugging.
The salt section in the Taylor No. 1 was drilled with a 15-inch cable tool bit; hence there was little or no solution enlargement during drilling. The estimated minimum diameter at reentry, 8.43 feet, represents a post-drilling hole enlargement of about seven diameters, or of a removal of about 12,000 cubic feet of salt by post-drilling dissolution due to gravity flow from a fresh water aquifer down the borehole of an uncased unplugged oil and gas test hole into the permeable Arbuckle dolomite which provided the needed brine outlet. It is thought that the hole partially plugged itself by bridging as a larger amount of dissolution could be expected in 40-years time with the available abundant fresh water supply.
A second example in the same area is the Pulliam No. A-1 in the Center of the S2 N2 NE of Section 35, Township 19 South, Range 8 West, Rice County, Kansas, reentered by Northern Natural Gas Company in 1974. The reentry diagram, Figure 19, of this well illustrates the complex subsurface conditions in old holes--here a 1936 cable tool hole completed with rotary tools below 3305 feet. Note the complete lack of surface pipe left in place in this abandoned gas well. This provided the first minor problem in reentry for the reason that the well could not be located by magnetic survey. After considerable bulldozer work, the old 6 ft X 6 ft cellar ten feet deep was located considerably south of its reported location. As excavation proceeded, the old sills and blocks were found to be in place at the bottom of the cellar. Below them was an open unfilled hole 48 inches in diameter to a depth of 28 feet. When this gas well was abandoned in 1945, it was plugged in the Simpson and Arbuckle near 3200 feet, but all casing which could be removed was salvaged leaving no surface pipe at all, and apparently no plugging of the hole above the Arbuckle reservoir. No information is available as to the diameter of this hole in the salt section at reentry in 1974, but it may have been enlarged as much as, or more than, the adjacent hole just 150 feet south, next discussed.
A test hole in the same section only 150 feet south, in the Center of the NE of Section 35, Township 19 South, Range 8 West, Rice County, Kansas, the Pulliam No. 1, reentered by Northern Natural Gas Company, provides some information on hole enlargement in the salt, presumably in part due to post-drilling dissolution. The Pulliam No. 1, a dry hole, had surface pipe set at 204 feet with no casing below that point. It was drilled in 1962, fifteen years after the abandonment of the nearest gas wells. It was an easy hole to reenter and had a deep penetration, 102 feet, in the Arbuckle (see Figure 4, cross section, Well 9, and Table 3, Aquifer 10). The author studied pressure and fluid recovery information from the drill stem tests and calculated equivalent specific gravity figures for three intervals. Figures were 0.996 (fresh water), 1.033 (equivalent 41,000 ppm), and 1.047 (equivalent 65,200 ppm). These calculations suggested dilution of normal Arbuckle brine by leakage of fresh water into the Arbuckle dolomite through older abandoned gas wells improperly plugged. This test hole was, itself, left unplugged (except for "heavy mud") below the surface casing in 1962. Northern set a new string of casing in the reentered hole in 1974 for use as an input-withdrawal gas storage well. From cementing information, the author calculated the average hole size in the salt section, depth 777 feet to 1042 feet, as 37 inches average diameter. This amount is approximately 50 percent more hole enlargement than would be expected due to normal rotary drilling with fresh water.
These examples confirm the premise that absence of surface pipe isolating fresh water aquifers can cause post-drilling salt dissolution in unplugged, or poorly plugged, holes. Older holes drilled before 1935 are most suspect. Apparently, these holes plug, or partially plug, themselves by bridging as there are no known examples of surface subsidence associated with these 40- to 50-year old holes.
Recognition of salt dissolution
At best, the subsurface measurement of salt dissolution in a borehole is an evasive and difficult subject. Once the hole is closed by abandonment and/or plugging, there are very few methods of monitoring subsurface conditions. Although many abandoned "dry holes" are routinely reentered each year in central Kansas in search for overlooked hydrocarbons, such borehole reentry work is done as quickly and cheaply as possible with little regard for the salt section. Only rarely is there a major reentry program like that of Northern Natural Gas Company in the Lyons Gas Field where 18 holes were reentered and carefully replugged at a cost of over $600,000 in 1974. Three of the reentered holes provided salt dissolution case histories for this study, the Taylor No. 1, Pulliam No. A-1, and Pulliam No. 1.
The presence of these now confirmed unplugged oil and gas test holes was suspected correctly by Charles K. Bayne (Bayne and Ward, 1971) who directed a detailed subsurface hydrological investigation of shallow aquifers in and near the immediate vicinity in 1970-71. At that time, the area was undergoing intensive investigation as to its suitability for long-term (200,000 years) use as a repository for high level radioactive wastes. The groundwater study, funded by the United States Atomic Energy Commission, included the drilling by the Kansas Geological Survey of 36 shallow (100 feet±) water wells with its own drilling rig, plus four deeper (300 feet) holes for hydrologic testing. The Survey's groundwater investigation disclosed a "pressure sink" in the potentiometric surface of the Cretaceous Kiowa aquifer (Table 3, Aquifer 4) about which Bayne wrote with regard to their hole 2-S, ". . . the anomalous hydraulic potential in this test hole can only occur if water is being or has been withdrawn either through a well pumping from the aquifer, or being discharged downward through an old drill hole or fracture. There is no record present or past of water being pumped from this zone ... there is a strong argument for downward leakage of water. Several oil and gas test holes have been drilled within a few hundred yards of the site of test hole 2-S." This example indicates that when special needs justify funding the costly and time consuming effort, a detailed subsurface hydrological investigation of shallow aquifers by drilling and testing may provide pertinent information on uncased, unplugged oil and gas test wells which by inference may be the locus of salt dissolution.
Methods of detecting salt dissolution at depth after drilling ceases include: (1) changes in, or redirection of, drainage patterns, (2) presence of unusual drainage patterns foreign to the geomorphology, (3) ponding of water under certain soil conditions, (4) minor downwarping detectable by precise level surveys, (5) cracks in the ground surface or roads, (6) cracks in the walls of buildings, (7) tilting of structures such as derricks, (8) casing leaks opposite the salt section, (9) casing failures at progressively shallower depths with the passage of time, (10) contamination of fresh water aquifers by brine from subsurface sources. Often, however, salt dissolution at depth may be undetected.
Hutchinson Salt in the Chase-Silica Oil Field
Chase-Silica Oil Field
The Chase-Silica Oil Field (Fig. 25) is a major oil field in Barton and Rice Counties, covering 135.3 square miles as redefined through the years since its discovery in 1929. Within it are three subsidence areas related to oil activity, the best known of which is the Panning Sinkhole described and illustrated below. The official field boundaries, as defined by the Kansas Corporation Commission, include 4845 oil and gas test holes of which 3738 produced oil, 19 produced gas, and 1088 were nonproductive "dry holes" encountering salt water in porosity zones. As of January 1, 1975, there were 694 active oil wells by field count. The wells are nearly all "stripper" oil wells (definition less than 10 BOPD for one year) averaging 4.68 barrels of oil per day per well (BOPDPW). During the year 1974, oil production was 1,185,331 barrels. Cumulative production from this giant oil field is over 250 million barrels of oil.
Figure 25--Index map: Chase-Silica Oil Field, central Kansas. Shows location of three subsidence areas: (1) Panning Sink in Barton County, (2) Berscheit Heirs (T. 20 S., R. 10 W.), and (3) Hilton (T. 20 S., R. 9 W.) in Rice County.
In defining the field limits and regulating allowed oil production, the Kansas Corporation Commission has had the advice of many industry geologists serving on the Kansas Nomenclature Committee. In recent years the "lumpers" have won over the "splitters" with the resulting sprawling oil field held loosely together by its official boundary, and by the common production of oil from the Cambro-Ordovician Arbuckle dolomite reservoir at depths near 3200 and 3300 feet. There is evidence of an original common oil-water contact near subsea--1585 feet in the enormous water-drive Arbuckle reservoir over much of the field, justifying the position of the "lumpers." Merged into the Chase-Silica Oil Field are 35 former oil fields. The author estimates that 85 percent of the total oil was produced from the Arbuckle dolomite.
The name "Chase-Silica" is derived from the town of Chase, Kansas in Sections 31 and 32, Township 19 South, Range 9 West, where a townsite oil play with the last of the wooden derricks occurred with prolific wells (100,000 barrels each) on five-acre spacing (Clark, Tomlinson, Royds, 1944), and from grain elevators at the former settlement of Silica, Kansas in Section 32, Township 19 South, Range 10 West.
The field was a learning ground for the oil operators. Early wells drilled with steam-powered cable tools required 30 to 60 days to drill. Then, in the 1930s, the first of the rotary rigs with derricks (not masts) moved into Chase-Silica. Geologists found the transition from excellent rock samples and fluid measurements of cable tools to the scrambled cavings of the rotary very difficult, and many logs and records of the 1930s are practically worthless. Rotary holes to 3250 feet, now commonly drilled in five days, took up to 24 days to drill. Drilling methods of the 1930s with no mud except native clays, with an abundance of easily available fresh water, with ram and cram drilling, with no drill collars, and with the drill pipe slapping the caving redbeds, resulted in hole enlargement to about five feet in diameter in the 300-foot thick salt section with many twistoffs and pipe recovery or "fishing" jobs. Here, too, is where geologists learned that the unconformity surface at the top of the Cambro-Ordovician Arbuckle was a carbonate karst plain with unpredictable "sinkholes" of limited extent (Walters, 1946) and here, too, the unexpected Precambrian quartzite monadnocks were encountered (Walters, 1953).
All early regulation of oil wells by the Kansas Corporation Commission in the 1930s was based on actual physical pump tests for 24 hours, with big machinery, everything bolted down, and the wheels flying. These physical tests (we now believe) coned bottom water upward in the first 24 hours. Rapid depletion of reservoirs in the 1930s when all the wells in the field averaged over 100 BOPDPW, is thought to have caused reservoir damage. This resulted in the handling of vast quantities of Arbuckle water, as much as 500 BWPDPW or more. At first, this was dumped wherever convenient (1920s), then vast "evaporation ponds" were built on the leases (1930s). In the 1940s, subsurface disposal in wells designated as salt water disposal (SWD) wells was required. These SWD wells commonly handled over 100 BW per hour by gravity flow into the porous lower Arbuckle dolomites. There have been a total of 154 SWD wells in the Chase-Silica Oil Field, converted for this use from 86 former oil wells and 68 former dry holes. In connection with the operation of these 154 SWD wells over a 30-year period, in only three SWD wells has casing corrosion caused excessive salt dissolution leading to surface subsidence, which may be viewed, therefore, as a relatively rare and unusual event.
Thickness and quality of salt
The Hutchinson Salt Member of the Permian Wellington Formation was penetrated by all of the 4845 oil and gas test wells drilled in the Chase-Silica Oil Field. As mapped in Figure 26, the salt has a thickness of 250 feet in its thinnest areas, across the summits of buried Precambrian bills in Township 19 South, Range 10 West. Over much of the Chase-Silica Oil Field the salt has a thickness of approximately 300 feet. In synclinal areas and regionally along the south portion of the maps, the salt thickness exceeds 350 feet. The depth to the top of the salt is approximately 900 feet in the east portion of the field and 1000 feet in the west, or Barton County, portion of the oil field. The thickness map was prepared from all surviving available log information. Indicated on the map are the locations of the key wells in which the wire line geophysical logs permit determination not only of the salt thickness but of the quality of the salt. The resolving power of such logs is about one foot. A careful study and tabulation was made of the logs capable of such resolution. Within the Wellington Salt are beds, one foot in thickness or more, of nonevaporite material (principally gray shale) totaling about 25 percent of the total thickness. The figure is derived from the calculation of 109 logs of the salt section in Rice County which averaged 24.09 percent nonevaporite material plus 32 logs in the Barton County portion of the Chase-Silica Oil Field which averaged 30.69 percent nonevaporites, or a composite figure for 141 calculated logs of 24.57 percent nonevaporite beds, one foot or more thick, within the gross salt section. This means that, if the salt sections were dissolved, one-fourth of the total section, or approximately 75 feet, would remain as water insoluble residue. Actually such residue would increase its bulk considerably during the process of falling into the lower portions of the solution cavities. Landes and Piper (1972) term this process "bulking."
Figure 26--Map: thickness of salt, Chase-Silica Oil Field. Contour interval 50 feet. This figure also available as an Acrobat PDF file.
Salt dissolution in early tests during drilling
During the drilling of many of the early holes in the Chase-Silica Oil Field in the 1930s, as many as 24 drilling days were required to reach 3250 feet, resulting in hole enlargement of the salt section during drilling to five feet or more. Twistoffs of rotary drill pipe were common, usually occurring opposite the salt section. Experience of operators in fishing for stuck and twisted-off drill pipe provided many instances of evidence for hole size enlargement in the salt section exceeding five feet, and even exceeding ten feet occasionally. Information concerning hole enlargement by salt dissolution during drilling is provided by (a) such fishing experience, (b) calculation of cement volumes in the few holes in which casing was cemented through the salt section, and (c) wire line logs. One hole which was intensely studied, the Panning 11-A, in Section 2, Township 20 South, Range 11 West, had cement placed behind the casing opposite the lower portion of the salt section. The author calculated from cement data that the average hole size above and below the salt section was 16 and 17 inches respectively, whereas the hole size within the salt section was calculated from cementing data to be 44 inches and 54 inches. Hole size information from cased hole gamma-neutron logs does not give precise figures but beyond critical limits, usually 36-inch diameter, the curves "wash out" or fail to record. An unusual and peculiar shift in the gamma-ray logs in much enlarged holes, and its meaning, is discussed next.
In the Chase-Silica Oil Field many cased hole gamma-neutron logs were recorded in the 1940s, usually by the Lane Wells Company. The holes were of uncontrolled large diameter--drilled nine inches but washed out to five feet or more in the salt section. Surface pipe, cemented in the Permian redbeds near 200 feet, serves to shut off fresh water aquifers above the salt. Oil string production casing, commonly 7-inch OD, set in the Arbuckle near 3250 feet isolated that reservoir, but commonly only 100 sacks of cement were utilized leaving the casing uncemented except for the bottom 200 feet or so. In log after log there is the usual well-defined shift of the gamma-ray curve to the left (decreased radioactivity) defining the top of the salt, followed by an equally sharp but unexpected gamma-ray shift to the right, here discussed, some 200 to 250 feet lower (example, Fig. 29-C). The lower shift has been read by geologists as the base of the salt leading to erroneous and erratic salt determinations. We now conclude that their shift is not the base of the salt, but that the actual salt base is from 10 to 70 feet lower with the gamma-ray curve giving a shale-like reading for this interval due to packing of former void space behind the casing with fallen shale. The shift occurs opposite the lower salt beds, the cleanest, purest, most easily dissolved portion of the 300-foot salt section. Usually the accompanying neutron log is essentially not recording because of hole enlargement. These two logs are the only cased hole logs available. A secondary characteristic of logs showing the anomalous shift is that the gamma-ray log, reading far to the left (low radioactivity) in the upper salt section lacks character. James Dilts who worked scores of logs for the author, measuring foot-by-foot the salt section recorded on wire line logs, concluded that the gamma-ray log, too, was essentially recording hole enlargement.
When casing is run in the rotary hole, it is floated into place in a fluid-filled hole. With the passage of time (logs usually recorded four to ten years later), the fluid level behind the casing adjusts to the common static level 1000 feet ± lower, removing fluid support from cantilevered shale partings in the Permian redbeds and in the upper salt section which then fall into the water-filled cavity opposite the lower salt, but which bridge above the constricted hole opposite the anhydrites below the salt. With this understanding of the gamma log shift, mapping of the salt beds in the Chase-Silica Oil Field, even though modern open hole multiple curve logs are rare, became orderly and predictable as shown in Figure 26. Similar gamma-ray shifts are present in logs of the same age elsewhere, for example, in the Gorham Oil Field, Russell County, but are not observed in gamma-neutron logs of holes drilled in recent years in which hole enlargement in the salt section is less severe, 20 to 24 inches in diameter. This observation tends to confirm our interpretation that the gamma-ray shift is recording shale-packed solution voids behind the uncemented portion of the oil string casing in the lower salt section.
Salt dissolution within the Chase-Silica Oil Field after drilling
No dissolution of salt takes place ordinarily after drilling ceases. The reason for this is that the four essential requirements for salt dissolution are not present. Fresh water in the shallow Quaternary and Cretaceous beds is cased off in all test holes by cemented surface casing which is left in place permanently and filled internally when the hole is plugged. Aquifers below the salt, as discussed elsewhere in this report, adjust to a common static fluid level above or within the salt section, but flow from one aquifer to the other does not cross the salt face in the borehole. The Arbuckle reservoir has a static fluid level above the salt, but fluids produced from the Arbuckle reservoir were confined within the oil string casing, set and cemented at some point within the Arbuckle dolomite. Rarely, in three holes only, all of which are salt water disposal wells, casing corrosion has caused leaks which have led to extensive salt dissolution followed by surface subsidence. These areas are discussed individually. They are named "Panning," "Berscheit," and "Hilton," after the fee owners of the land on which the disposal wells were drilled.
Panning Sinkhole, Barton County, Kansas
Well history, Panning 11-A
The Panning sinkhole developed around an oil well known as the Panning 11-A, then in the process of abandonment after extensive use as a salt water disposal well. Location is in the Center of the S2 SE of Section 2, Township 20 South, Range 11 West in the Barton County portion of the Chase-Silica Oil Field, Figures 25 and 26.
The following paragraphs pertaining to well history are based largely on data recorded at the time of surface collapse by Bruce F. Latta (personal communication), who submitted intradepartmental reports to the Director, State Board of Health, dated April 18, 1959 and May 5, 1959, and who generously furnished copies of these reports to the author.
Oil Well
September 1938, drilled with rotary tools. Set 184 feet of 10 3/4-inch surface casing at 190 feet with 200 sacks of cement. Producing casing 6-inch OD set at 3268 feet in the Arbuckle and cemented with 100 sacks cement. Top of Arbuckle Dolomite 3267 feet (subsea -1502 feet). Completed on September 30, 1938 for a potential of 2001 BOPD. During testing the well swabbed 104 BOPH, natural (without acidizing), pulling swab from 1800 feet off bottom and swabbing through the 6-inch casing with the then total depth of 3276 feet.
Recompletion
Five years later, March 22, 1943, the well was deepened to 3285 feet (subsea -1520 feet) and acidized with 3000 gallons and then pumped 4 barrels fluid per hour (99% water). It was plugged back to 3270 feet (subsea -1505 feet), reacidized with 500 gallons 15% HCI, and again pumped 4 barrels fluid per hour (99% water). An echometer fluid level test showed fluid level 912 feet from the top (+865 feet above sea level).
Conversion to SWD
Three years later, March 23, 1946, the well was deepened with cable tools for use as a salt water disposal well at a total depth of 3850 feet in Precambrian granite, top at 3844 feet (subsea -2079 feet). Inside the 6-inch casing a 5-inch liner was run from 3223 to 3328 feet (subsea -1563 feet). At this time it was planned to place cement behind the oil string casing, but this plan was only partially followed.
Cementing procedures, which have an input bearing on the subsequent failure of the SWD well, were as follows (data from Latta personal communication, except that estimated hole sizes are calculated by the author):
Perforated at 2500 feet (-735 feet) opposite Wabaunsee Group and circulated to surface i.e. no cement at all then present from 2500 feet to the surface. Pumped 750 sacks cement 2500 to 1240 feet, just above base of the salt which is variously reported as 1245 feet (+520 feet), or 1225 feet (+540 feet), or 1275 feet (+490 feet--author's figure). Average hole diameter calculated as 16 inches. Perforated at 1225 feet and pumped 500 sacks cement to 1150 feet in salt. Calculated hole diameter 44 inches. Perforated at 950 feet and cemented with 500 sacks to 109,0 feet in salt section. Calculated average hole diameter 54 inches. See Figure 29 A-D.
There was no cement placed opposite 115 feet of the upper salt section from its top at 975 feet to 1090 feet. Hole size cannot be calculated, presumably 54 inches or larger. Perforated at 1090 feet and cemented with 500 sacks cement to 230 feet. Calculated hole diameter 17 inches.
There is no cement from 230 feet to the base of the surface casing at 190 feet which was reportedly set in bedrock, casing off Cretaceous shales and sandstone 190 feet to 98 feet and loose Quaternary sand and gravel present from 98 feet to 8 feet above which is loess-like clay soil. The base of the surface pipe, commonly a washed out zone of large diameter, was not here supported with cement. A string of 3-inch plastic lined tubing (to inhibit corrosion from the H2S bearing corrosive Arbuckle brine) was set on a packer at 3320 feet to conduct the waste brine downward and keep it out of contact with the 6-inch casing to avoid corroding it. Completed as a SWD input well May 2, 1946, acidized with 3,000 gallons HCl. The well took 410 barrels of water per hour by gravity flow, or in terms familiar to hydrologists this is 287 gallons per minute. Placed in service as a disposal well.
In Use as SWD
Three years later, in 1949, the tubing was removed "because of inadequate capacity through tubing" (Latta, personal communication). Water was injected directly down the 6-inch casing. The total water injected in this well in 11 1/2 years of use, May 2, 1946 to December 31, 1958, is reported as 11,486,238 barrels of brine. This is an average of 2485 barrels of brine per day, or 103.55 barrels of salt water per hour, day and night, for 11 1/2 years, or 72.6 gpm. The figure is believable because in December 1958 the measured injection rate was 140 barrels water per hour by gravity flow.
Abandonment
The Panning 11-A was abandoned (but not plugged) in January 1959 because "the area around the well started settling causing the derrick to tilt and water to stand around the well" (Latta, personal communication). The derrick was cut down and moved in January 1959. Subsidence was first noted in late 1957, or early 1958, by oil-field workers according to S. W. Fader (1975).
Plugging
After standing idle for four months, the Panning 11-A was plugged April 14, 1959. The 6-inch casing was shot off at 230 feet, but operators could not pull the pipe. Shot off again at 188 feet (inside 10 3/4-inch surface casing) and recovered 189 feet of 6-inch casing which was laid on the ground at the location. The 188 feet of 10 3/4 inch surface casing cemented at 190 feet was left in the hole. The official plugging record on file with the Kansas Corporation Commission is somewhat ambiguous in that "the hole was bridged from 3850 feet to 360 feet." Note that the bridging materials, and the amount used are not stated. The Arbuckle at the bottom of the hole was probably plugged with sand or whatever was thrown into the hole. The report states that the hole was plugged back to 190 feet from 3850 feet, and squeezed (grouted) with 150 sacks cement, with cement fill to 110 feet. Filled the surface pipe from 110 feet to 20 feet with clay and rock, then ran 10 sacks of cement from 20 feet to the bottom of the cellar at 8 feet.
Collapse
Ten days later, April 24, 1959, the ground collapsed from 9:00 a.m. until evening (12 hours ±) when vertical movement stopped. At that time, the hole was about 300 feet in diameter with water level 50 to 60 feet below the surface (Latta, personal communication). Four days later when Latta was at the location, the water level was 11.5 feet below the land surface and the vertical walled pit had not increased in size. A week or two later the pond with 6-foot vertical banks above water level was fenced with a 6-foot chain link fence in a square 500 feet on a side.
Observations by witnesses
At 9:05 a.m., April 24, 1959, Larry Panning and his father, Alfred Panning, saw dust, mud, and dirt being blown in the air from the well, a distance of one-fourth mile east of their farmhouse. They drove to the site and photographed the sinkhole forming so rapidly that it drained water from the sand and gravel aquifer (Fig. 27). The rapidly enlarging hole was about 40' feet deep and about 75 feet across. The cone-shaped, or funnel-shaped, hole was forming in loose sand and gravel with large flows of fresh water rushing in, swirling around, and flowing down the hole. Within the first few hours there disappeared down the hole 190 feet of 8 5/8-inch surface pipe formerly cemented in place, six joints (189 feet) of 6-inch casing which had been pulled and were lying on the ground beside the well, debris from a 500-barrel redwood salt water receiving tank (diameter 20 feet, height 10 feet), the concrete well apron, and four concrete derrick corners (each corner 5 by 5 by 6 feet). The Pannings report (personal communication, Alfred Panning, December 17, 1974) that as they arrived at the location there was a sudden burst of dust, clods, and sand. They observed that this was repeated and that each burst, or shower, of dirt clods occurred just after each concrete rig corner block disappeared. The growing cone-shaped pit was a moving slurry of sand, gravel, dirt, and water. The hole grew rapidly to about 200 feet in diameter in three hours. The eyewitnesses estimated that the cone-shaped pit was about 100 feet deep. The pit was then filling rapidly with water with the result that its depth could no longer be estimated. Development of the crater continued until evening (12 hours ±) forming a nearly circular pit 300 feet in diameter (Figure 28), with the water level 50 or 60 feet below the surface, at which time major vertical movement ceased. The water level was 11.5 feet below grade and the pit size unchanged when observed three days later, April 26, 1959 (Latta, personal communication).
Figure 27--Photograph by Larry Panning, April 24, 1959. Shows Panning Sinkhole after about one hour. View toward northwest. Vertical casing of abandoned water well, left center. Shows large flows of fresh water from breached near-surface aquifer.
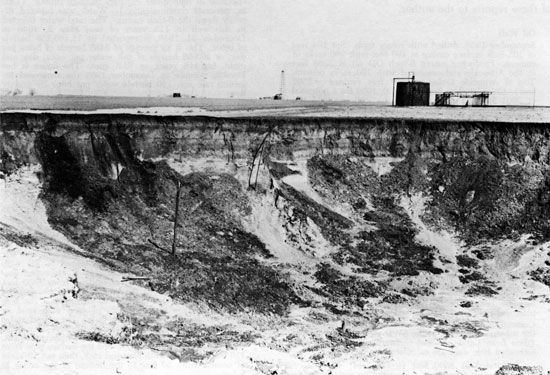
Figure 28--Photograph by Larry Panning, April 24, 1959. Panning Sinkhole, view toward the northwest. Vertical water well casing of Figure 27 at left center. Figure of man, left foreground. The light areas in the sides of the pit are water flows.
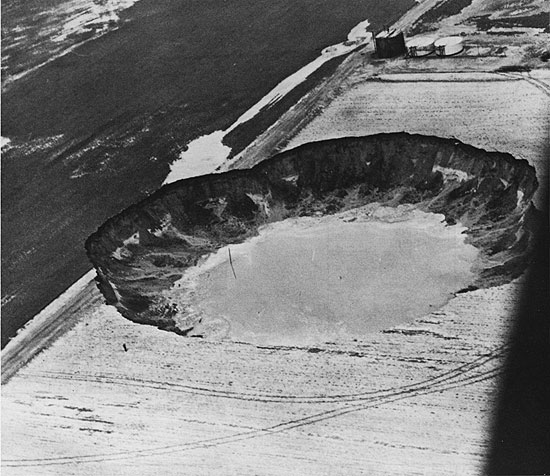
May 3, 1959, a fence enclosing an area 500 feet by 500 feet was built on the undisturbed land surrounding the pond, which at that time had vertical banks six feet high. In the subsequent 17 years, there had been little evidence of subsidence. The fence has buckled near the midpoint of each of the four sides as a result of downward movement of about two feet and inward movement of slightly more than two feet at each midpoint relative to the four corners, providing an indication of the downward and inward adjustment movement in that time period. By erosion and readjustment, the pit has dished out and developed gently sloping banks. Maximum depth of water in the pit was reported as 85 feet in May 1959 by Larry Panning (personal communication). In July 1975, the maximum depth was measured by Clark T. Snider and the author as 64 feet. The bottom has a gentle wave cut notch 15 feet wide from depth of zero to three feet, then a fairly uniform steep 30-degree slope to a depth of 50 feet, a gentle slope to a small flat area (40 by 40 feet) depth 62 feet, with a maximum reading of 64 feet directly above the old well bore. This fenced fresh water pond, now a wildlife preserve, is circular, measuring 370 feet in diameter, with the water level six feet below the general ground level. This is slightly larger than the October 1965 aerial photograph measurements of an approximately circular pond 330 feet in diameter. The enlargement is presumably the result of wave erosion and bank leveling.
Postulated sequence of events
Using these facts, and combining them with knowledge of the hydrology of the Chase-Silica Oil Field aquifers, a sequence of events can be postulated. The reader is cautioned to remember, however, that this reconstruction is made from observations in which the subsidence itself is the principal evidence for salt dissolution: (1) no saturated brine was ever recovered at the surface; (2) there is actually no direct evidence that the salt section was dissolved; (3) the gamma-neutron log (Fig. 29-C) from a nearby well shows normal post-drilling conditions in the salt section; (4) no casing was recovered from the depth of the salt section; hence even the presence of corroded holes in the casing is circumstantial; and (5) there have been no post-subsidence surveys by seismic soundings, or drilling. With these reservations in mind, the postulated sequence of events terminating with the formation of the Panning Sinkhole is as follows:
Figure 29--Diagram, salt section in Panning 11-A. A, After setting 6-inch oil string casing; B, Oil well, oil is pumped up 2-inch tubing; C, Gamma-neutron log, tubing removed; D, Salt-water disposal well (SWD), waste brine mosing down 3-inch plastic-lined tubing.
September 1938 (Fig. 29-A). During the drilling of the Panning 11-A, the fresh water drilling fluid dissolved salt to a diameter of 54 inches. Note that production casing cementing did not proceed up hole this high.
1938-1943 (Fig. 29-B). No dissolution of salt took place while over 100,000 barrels of oil were being produced through tubing. Shale interbeds in the salt section collapsed and fell, accumulating in the void space from 1200 to 1275 feet, just above the constriction in hole size at the first anhydrite bed.
1943-1946 (Fig. 29-C). A cased hole gamma-ray neutron log recorded in a nearby hole showed the static fluid level of the Arbuckle aquifer to be 912 feet from the top of the hole. No salt dissolved in these years during which the well was temporarily abandoned as non-commercial after pumping 99 percent water due to depletion of the oil.
1946-1949 (Fig. 29-D). The well was converted for use as a salt water disposal well ("SWD" in Fig. 29-D) by recementing the casing. Note the presence of cement opposite the lower salt section and the absence of cement opposite the upper salt section. No salt dissolved. Brine was disposed through tubing by gravity flow.
1949-1958 (Fig. 30-A). Tubing was removed from this disposal well and brine was disposed directly down the casing. Corrosion resulted in casing leaks, permitting access for 72 gpm of brine, 14,000 ppm chlorides, to circulate across the salt face, then downward into the Arbuckle aquifer. A huge cavern dissolved in the salt, larger thin 300 feet in diameter. Progressive falls of shale interbeds and shale roof rocks partially filled the cavern. Successive roof falls caused the void space to gradually migrate upward to near the Stone Corral Anhydrite, depth 465 feet (1300 feet above sea level) causing, in turn, surface subsidence, ponding of water, and tilting of the derrick.
1959-January (Fig. 30-B). The Panning 11-A was abandoned but not plugged. The derrick was removed because surface subsidence caused it to tilt dangerously. With disposal brine flow discontinued, salt dissolution ceased.
1959-April 14 (Fig. 30-C). The Panning 11-A was plugged with 150 sacks of cement in the surface pipe to 190 feet, and the Arbuckle was bridged: There was no other plugging. The underground void space at shallow depth was now isolated from both the near surface and the Arbuckle aquifers. Brine in the void space drained downward gradually to reach equilibrium with intermediate aquifers leaving the near surface void space unsupported by fluid and under vacuum.
1959-April 24 (Fig. 30-D). When the upper-most "keystone" bedrock at a depth of 106 feet fell into the newly drained shallow void space, the surface sinkhole formed rapidly in three hours from 9:00 a.m. until noon, with some subsidence continuing until about 9:00 p.m. As the shallow void space filled with fresh water and air, falling material such as concrete derrick corner blocks fell into the narrow aperture and compressed, then ejected, the air. The casing collapsed and fell. At first, the loose sand and gravel moved downward in a fresh water slurry at a rate faster than the flow of the aquifer, forming a deep cone shaped pit. As the void space filled, water accumulated in the surface sinkhole.
1959-April 25 to present (Fig. 30-E). The circular sinkhole diameter near 330 feet, stabilized forming a fresh water pond 64 feet deep, volume near 2,000,000 cubic feet. In 17 years, the surrounding fence buckled downward and inward only about two feet on each side, indicating resumption of stable subsurface conditions. Transported sand and gravel fills the shallow space voided by roof falls. The former cavern in the salt is filled and plugged with fallen Permian shale and redbeds; hence it is thought that no further dissolution is occurring.
Larry Panning (personal communication, July 23, 1976) stated that evidence was submitted during litigation in the early 1960s indicating that the surface pipe may have parted during drilling. If correct, fresh water from the shallow aquifer could have drained downward by gravity flow outside the 6-inch casing, across the salt section dissolving salt and flowing into any or all of the several Permian and Pennsylvanian aquifers during the period of oil production from 1938 until the casing was recemented in 1946 in preparation for use as a disposal well. The author's theoretical reconstruction may, therefore, require modification as to time and cause of salt dissolution, but the resulting sequence of events remains the same.
Figure 30--Cross section through Panning 11-A disposal well. A, Waste brine moving down inside 6-inch casing (plastic-lined tubing removed) and circulating by Permian salt section through holes in casing; B, Well abandoned; derrick removed; C, Well plugged with cement in surface pipe, and bridged in Cambro-Ordovician Arbuckle Dolomite; D, Sinkhole forming April 24, 1959; E, Panning sinkhole with pond; F, Legend for Figure 30.
Berscheit Sinkhole
The Berscheit Sinkhole developed by slow subsidence around the location of the abandoned Berscheit No. 14 disposal well in the Center of the SW SW NW of Section 6, Township 20 South, Range 10 West, Rice County, Kansas. At the time of abandonment of the well in March 1972, Norman W. Biegler (personal communication) photographed the pond forming in the subsidence area around the well. At that time, this 160-acre lease, formerly with 16 Arbuckle oil wells, had only one remaining oil well located one-fourth mile east of the disposal well. The tank battery burned to the ground contributing to lease abandonment.
The amount of subsidence is not known because this agricultural land has not been monitored by precise surveys. The well elevation was 1772 feet derrick floor, and 1769 feet ground level. In 1975, unusually heavy precipitation filled the pond in the subsidence area completely to the spill point on the northwest, and in July 1975, the pond had a water surface elevation of 1764 feet (Clark T. Snider, personal communication). Mr. Allen Kelly, the present landowner, said that swimmers report the water to be 10 feet deep. The subsidence is, therefore, estimated at 15 feet. There has been no collapse or sudden drop. Cretaceous bedrock is close to the surface with a Dakota sandstone ledge exposed a few inches above lake level in a gully on the south side. All slopes are very gentle and a small rise in water level increases the inundated area greatly. The pond measured about 450 feet east-west and 375 feet north-south.
The Berscheit No. 14 was drilled with rotary tools in 1936, with only 114 feet of 12 1/2-inch surface pipe. The Arbuckle was drilled at 3264 feet (subsea -1492 feet) and produced oil from open hole below the 7-inch casing set at 3267 feet, with a total depth of 3272 1/2 feet. When deepened in 1942 for use as a disposal well, weathered granite was encountered at 3794 feet (subsea -2022 feet), with a total depth of 3819 feet. A liner of 5 1/2-inch pipe 543 feet long was set within and below the 7-inch casing from 2842 to 3385 feet (subsea -1613 feet). At the time of plugging, April 6, 1972, only 60 feet of 5 1/2-inch and 60 feet of 7-inch casing were recovered, and both were "very badly eaten away" according to official plugging report by Gilbert J. Toman, State Plugging Supervisor, who noted on the report, "location sinking from washed out salt section." Plugging consisted of pumping 400 sacks of cement into the well through a two inch opening in plate welded into 12 1/2-inch surface casing.
The sequence of events leading to the formation of the Berscheit Sinkhole is thought to be similar to the nearby Panning Sinkhole. The final event, the rapid collapse resulting from inflow of loose sand and gravel, could not occur because alluvial fill is absent at the Berscheit location. Corrosion of the casing causing large leaks was inferred in the Panning 11-A, but is a certainty in the Berscheit No. 14. Photographs by N. W. Biegler (personal communication) of the 120 feet of casing recovered from the Berscheit No. 14, show the pipe "eaten away" with large holes each several square inches in area.
Hilton Subsidence Area
An area of slow subsidence due to salt dissolution developed around the location of twin salt water disposal wells, 200 feet apart, in the NW NE SW of Section 6, Township 20 South, Range 9 West, Rice County, Kansas. At the present time, all oil wells in the W2 of Section 6 have been abandoned and the land restored to agriculture. There is a shallow pond with gentle sloping grassy banks. Well data are as follows:
| Hilton No. 6 C NW NW SW Sec. 6, T. 20 S., R. 9 W. |
Hilton No. 7 200' West of No. 6 Sec. 6, T. 20 S., R. 9 W. |
|
|---|---|---|
| Completed | November 1948 | October 1951 |
| Plugged | October 1951 | June 1965 |
| Elevation | 1731 ground level | 1735 rotary bushing 1731 ground level |
| Surface Casing (8,8' inch) | 198' with 100 sacks | 203' with 125 sacks |
| Arbuckle | 3278 (-1547) | 3278 (-1543) |
| Total Depth | 3542 (-1811) | 3564 (-1829) |
| Production Casing (5 1/2 inch) | 3282' with 25 sacks | 3285' |
| Liner (4 inch) | 3336' | None |
| Plugged | October 10, 1951 | June 25, 1965 |
| Casing removed | 765' of 5 1/2 inch | None |
| Reason for abandonment | Tubing failure. Found top of tubing at 855'--could not fish tubing. | When holes in the 5 1/2-inch casing were squeezed (grouted) With 550 sacks of cement, the collar and surface pipe filled with cement. |
| Plugging | Rock bridge 175'-185' and 20 sacks cement. | Pumped 300 sacks cement in the well down the 5 1/2-inch casing. |
Data recorded by S. W. Fader (1975) in March 1973 indicate that subsidence at this site was first noted in May 1964 (one year prior to plugging the last disposal well) at which time geologists from the State of Kansas Department of Health and Environment estimated that 13 feet of decline occurred at some time between 1948 (first disposal) and 1964. On the basis of the Chase, Kansas topographic quadrangle prepared from aerial photographs taken in 1968, and field checked in 1970, Fader estimated that total subsidence in 1968 was 18 feet in the center of an area about 500 feet by 600 feet, and he notes that an aerial photograph taken in September 1970 shows a pond with surface dimensions of about 320 feet by 380 feet. The area appears to be stabilized but it has not been surveyed.
The sequence of events leading to the formation of the Hilton subsidence area is thought to be similar to the Berscheit Sinkhole. The observance of sinking at the surface at least a year before abandonment is significant as regards the slow development of such areas. The presence of twin disposal wells 200 feet apart with the earliest hole abandoned, the Hilton No. 6, plugged only as described, may have been a factor. In salt mining by solution, pairs of brine wells are commonly employed to dissolve galleries in the salt which are several hundred feet in length.
Hutchinson Salt in the Gorham Oilfield
Gorham Oil Field
Within the Gorham Oil Field, in western Russell County, central Kansas (Fig. 31), there are two areas of surface subsidence caused by salt dissolution in three abandoned oil wells. These subsidence areas seriously affect Interstate Highway 70; hence they were and are carefully surveyed and studied. In the 44.5 square miles of the Gorham Oil Field, all of the 1593 oil and gas test holes drilled penetrated the Hutchinson Salt Member of the Permian Wellington Formation which was encountered near a depth of 1300 feet.
Figure 31--Index map; Gorham Oil Field, Russell County, Kansas.
The 50-year old Gorham Oil Field is localized by a broad gentle anticline overlying a faulted Precambrian basement high. There is a displacement of 300 feet in the Precambrian granite. Faulting accounts for 50 feet of relief on the sub-Pennsylvanian unconformity surface depth near 3250 feet. At the level of the oil producing Lansing-Kansas City limestone, near 3000 feet, faulting is also evident to the extent of 50 feet of the total relief of 100 feet. The Hutchinson Salt has a thickness of less than 250 feet overlying the structurally highest area, as compared with over 300 feet in the surrounding synclinal areas. The Permian Stone Corral Anhydrite at the top of the Sumner Group, depth near 900 feet, shows 30 feet of steep dip overlying the fault zone. Careful surface mapping of the outcropping Cretaceous Fence Post Limestone in the early 1920s disclosed 30 feet of closure, leading to the discovery of the oil field in 1926. The geology of the Gorham Oil Field has been described in detail by Walters (1977), who earlier published a geological cross section through the oil field (1953).
Cumulative oil production in this major oil field totals 86,919,723 barrels of oil to January 1, 1975. It is estimated that 69 percent of this is from the truncated Arbuckle dolomites and Cambrian Basal Sandstone, 25 percent from the Pennsylvanian Lansing-Kansas City limestones, and 6 percent from shallower Pennsylvanian and Permian zones, principally from the Shawnee Group. An unusual feature of the oil field is the presence of a five-mile long fracture zone indicated by the straight line distribution of 20 Topeka (Shawnee Group, Pennsylvanian) limestone oil wells, including two unique giant wells each of which produced over one-half million barrels of oil. The 341 active oil wells, part under secondary recovery by waterflood, averaged 4.55 barrels of oil per day per well during 1974, but these "stripper wells" together accounted for an annual production of 565,991 barrels of oil in 1974. Within the Gorham Oil Field, or immediately adjacent to it, there have been drilled 1593 oil and gas test holes, 1170 oil wells, 386 dry holes, and 37 service wells. In connection with the handling of oil-field brines produced along with the oil, there were 56 deep salt water disposal wells, 17 converted from abandoned oil wells, and 39 converted from former dry holes. In connection with secondary recovery of oil from the Lansing-Kansas City limestones by waterflooding, there are 56 salt water injection (SWI) wells, 19 of which were converted from abandoned oil wells, and 37 of which were drilled specifically for use as injection wells, and hence are classified as service wells.
Wells were drilled in the Gorham Oil Field in the 1920s and 1930s with cable tools (wire line percussion drilling and bailing) requiring 60 days or more for each well (depth 3250 feet ±), and providing excellent rock cuttings (when saved), data on aquifers penetrated, and actual salt cuttings. Wells drilled in the late 1930s and later were among the earliest rotary drilled holes in Kansas, and information on formations penetrated--even oil zones--was meager, with no data on the salt (borehole enlargements to five feet, or even ten feet, in diameter), and almost no useful data on aquifers and the general hydrology of the Gorham anticline. Redrilling of portions of the Gorham Oil Field for secondary recovery of oil by waterflood has provided some modern wire line geophysical logs and fluid data, but most of these logs record only formations below the base of the salt.
Thickness and quality, Hutchinson Salt
The Hutchinson Salt, depth near 1300 feet, is less well known than one would expect in the Gorham Oil Field where it has been penetrated by 1593 oil and gas test holes, or an average hole density of 36 holes per square mile. All that is left from the many early cable tool holes are written drillers' logs which are usually accurate as to the depth of the top of the salt, but which are inaccurate and contradictory as to the base of the salt, and which provide no details, the whole 300-foot section often being described by the one word "salt." Early rotary hole records are worthless as regards information concerning the salt. A thorough review was made of all available log data, and the results are incorporated in Figure 32, a map showing the thickness of the Hutchinson Salt. Only three percent of the total holes drilled, the 47 holes designated as "selected control," had logs of sufficient quality to permit evaluation of the salt beds. These indicate that the salt section (1) is less than 250 feet over the anticlinal crest, (2) thickens to more than 300 feet in the synclinal area, and (3) averages 33.7 percent nonsalt, principally shale, in beds one foot or more in thickness, which is the resolving power of the wire line logs. The salt beds thin over the anticlinal axis principally by the loss of basal beds, indicating the presence of a positive area, perhaps an island ' during the early deposition of salt. There is also some thinning of beds in the mid-salt section and some loss of beds at the top of the salt section along the anticlinal axes, indicating differential vertical movement in mid-Permian time when the Hutchinson Salt was being deposited as an evaporite formation in the shallow sea.
Figure 32--Gorham Oil Field, showing thickness of Hutchinson Salt. Contour interval 50 feet. This figure also available as an Acrobat PDF file.
Indicated on Figure 32, by double circles, are the two locations where salt dissolution associated with oil operations has been so extensive as to cause surface subsidence. These are the Crawford and Witt Sinks. They are illustrated in greater detail in Figure 33, an index map of two square miles, Sections 2 and 3, Township 14 South, Range 15 West, which shows the location of the two sinkholes, of Interstate Highway 70, and of the many oil and gas test holes drilled through the salt. Contours indicate the amount of surface subsidence due to dissolving the Hutchinson Salt, present at depths below 1300 feet. During a 20-year period, slow subsidence has occurred totaling more than 26 feet (Crawford) and 17 feet (Witt), associated with three abandoned oil wells and three nearby abandoned shallow salt water disposal wells ("SWD" of the legend, Fig. 33). This oil-related subsidence has affected 1000 feet and 750 feet, respectively, of both lanes of Interstate Highway 70 at these locations, necessitating costly repairs. The relation of these two subsidence areas to the subsurface formations and aquifers is illustrated in Cross Section I-J, Figure 34, discussed next.
Figure 33--Index map, Gorham Oil Field, Sections 2 and 3, T. 14 S., R. 15 W. Contours show the amount of subsidence in the Witt and Crawford Sinks. Contour interval, 10 feet.
Cross Section, Gorham Oil Field
Cross Section I-J, Figure 34, is drawn without vertical exaggeration. It illustrates the geological rock column drilled in the Gorham Oil Field, the close well spacing with twin and triple well locations, the multiple porous zones which are oil reservoirs and/or aquifers, and the two areas of salt dissolution and surface subsidence the investigation of which is continued in a following section.
Figure 34--Cross section I-J, through the Witt and Crawford sinks, Gorham Oil Field. Natural scale, no vertical exageration. Length of section depicted, 6500 feet. This figure also available as an Acrobat PDF file.
The cross section was compiled by using all available surviving data-plotted cable tool drillers' logs, wire line logs, samples of well cuttings, hydrological data, oil and brine production information, and State Highway Commission surveys. It serves as an introduction to subsurface conditions in undistorted vertical and horizontal relationship.
The many aquifers are indicated by the symbol "W." Note the complete absence of aquifers in the Permian Sumner Group above, within, and just below the Hutchinson Salt. The Sumner Group is an aquiclude serving as a barrier to vertical fluid migration. Within or above the Sumner Group there are no oil shows, but below it there are oil shows (solid dots, Fig. 34) and/or commercial oil production in all porous zones. Where this natural barrier to vertical fluid movement is breached by drilling, or by the abandonment of improperly plugged boreholes, vertical fluid movement can and has taken place-upward movement of oil by flowing during the drilling of some early cable tool holes, and downward movement of water by gravity flow in abandoned boreholes. The aquifers of the Gorham Oil Field are next discussed.
Aquifers in the Gorham Oil Field
Aquifers in the Gorham Oil Field are illustrated on Cross Section I-J, Figure 34, by the letter "W" plotted in the position where water was reported in holes drilled with cable tools, or by a solid dot indicating oil. The aquifers are also shown graphically in Figure 35, in which the sea level position of the lower limit of the aquifer is plotted as though it were the bottom of a well. Dotted shading indicates the static fluid level for each reservoir for the fluid contained in the reservoir. For reservoirs 1 and 2, which are fresh water aquifers, the level shown is the potentiometric surface. For reservoirs 3 to 10, which are brine-bearing, the potentiometric surface, or height of an equivalent column of fresh water, will be somewhat higher or more shallow. General statements which can be made concerning significant relationships shown graphically in Figure 35 include:
- Aquifers 1-4 inclusive, if interconnected, would flow from one to the other in numerical sequence with Aquifers 1 and 2, which are fresh-water-bearing, flowing into Aquifers 3 and/or 4, which contain brines under-saturated as to chlorides;
- All aquifers above the salt, 1-4 inclusive, if connected with any one or all the aquifers below the salt, for example by a well bore, will flow into the lower aquifers because of a "head" difference of 700 feet or more, and in so flowing can dissolve salt;
- All aquifers below the salt, 5-10 inclusive, are brine-bearing "salifers," but with brines undersaturated as to chlorides and in their original virgin pressure condition, had static fillup levels higher than the salt section, hence where capable, for example, of flooding a hypothetical underground salt mine;
- All aquifers below the salt, 5-10 inclusive (except 9-C), if interconnected with each other in any combination, for example by a well bore, will flow from one to another until pressures are equalized, but there will be no flow across the salt section, hence no salt dissolved.
Note that these general statements, which are fundamental principles, can be made without naming the aquifers and without specific figures other than the depths graphed with their implied pressure relationships. The aquifers are summarized in Table 4.
Figure 35--Static fluid level in Aquifers 1 to 10 of Table 4, and Cross Section I-J, Fig. 34, Gorham Oil Field. Each column depicts a hypothetical well with casing bottomed in an individual aquifer.
Table 4--Data: Aquifers, Gorham Oil Field.
| Fig. 35 Number |
Name | Depth | Depth in feet down to static level |
Chlorides in ppm |
Total Dissolved Solids (Sp.Gr.) |
Remarks |
|---|---|---|---|---|---|---|
| 1 | Surface runoff and alluvium |
0-10' | 0 | 0 | 0 | |
| 2 | Cretaceous Dakota-Kiowa Sandstones |
175-400' | 0 | 303 | 1,041 | Average 4 analyses non-oil-field areas Russell County. |
| 7,655 | 16,652 | Average 4 test holes Gorham Oil Field. Data: Frye and Brazil (1943). | ||||
| 3 | Cretaceous Cheyenne Sandstone |
475-515' | 200 | 16,059 | 26,000± (Sp.Gr. 1.021) |
Used for shallow SWD in 1940s. Contaminated and repressured. |
| 4 | Permian Nippewalla Group |
515-900' | 300 | No analyses available. "Highly mineralized water" (Frye and Brazil, 1943). | ||
| 5 | Permian Chase Group |
1700-2000' | Not known | No analyses. | ||
| 6 | Permian Council Grove and Admire Groups |
2000-2350' | Not known | 102,016 | 170,955 (Sp.Gr. 1.117) |
Average of two analyses from adjacent Hall-Gurney Oil Field. |
| 7 | Pennsylvanian Wabaunsee Group |
2350-2700' | Not known | 100,930 | 181,186 (Sp.Gr. 1.111) |
Average of 21 analyses from Russell County. None in Gorham Oil field. |
| 8 | Pennsylvanian Shawnee Group |
2700-3000' | 700 | 99,502 | 162,915 (Sp.Gr. 1.107) |
Average of seven analyses, six from Gorham Oil Field. |
| 9-A | Pennsylvanian Lansing-Kansas City Group |
3000-3300' | 700 | 68,948 | 132,498 (Sp.Gr. 1.075) |
Average of ten analyses from Gorham Oil Field. |
| 9-B | Pennsylvanian Lansing-Kansas City Group |
3,000 | Depleted condition of oil reservoirs, 1940s. | |||
| 9-C | Pennsylvanian Lansing-Kansas City Group |
Up | 600 psi surface pressure, secondary recovery waterflood. | |||
| 10 | Ordovician and Cambrian Arbuckle Dolomite and Basal Sandstone |
3300-3700' | 900 | 26,200 | 44,793 (Sp.Gr. 1.030) |
Chlorides, average of 30 analyses, from Gorham Oil Field. |
History of brine disposal--Gorham Oil field
Throughout the 50-year history of the Gorham Oil Field, there have been many changes in the method of handling oil-field brines produced with the oil. During the 1920s and early 1930s, there were no regulations and it was accepted practice to store brine in surface pits. Ultimately the brine either evaporated or seeped into the soil or alluvium, and eventually made its way into the shallow fresh water aquifers, or else washed into the surface stream drainage during storms which eroded out the earthen embankments. Pits continued to be used into the early 1950s, by which time many of the Basal Sandstone oil wells were producing 90 percent salt water in amounts exceeding 100 barrels of water per day per well. Such pits are abundantly visible on 1938 and 1951 photographs studied. This disposal method was beneficial from the, point of view of salt dissolution as no dissolution occurred, even though it was most deleterious as regards surface runoff water and the shallow fresh water aquifers.
In 1941, the Kansas Geological Survey conducted a study of oil-field brine disposed in the Gorham Oil Field, and in adjacent parts of Russell and Ellis Counties. Test holes were drilled and water samples collected. This study (Frye and Brazil, 1943) was interrupted before completion, but official approval was given by the Kansas Corporation Commission for disposal of oil-field brines in shallow brine-bearing aquifers, the Cheyenne sandstones (No. 3 of Fig. 35), and the Cedar Hills Sandstone Member of the Permian Nippewalla Group (No. 4 of Fig. 35), at depths near 500 to 800 feet. Frye and Brazil mapped 22 such wells within the present Gorham Oil Field of which four, mapped in Fig. 33 (indicated as "SWD"), affected the Witt and Crawford Sinks. Operations were not always discriminating as to the shallow sandstones used, and it is in this period that the chloride count in the Dakota reached 7,655 ppm, Table 4, as compared with 303 ppm chlorides in non-oil-field areas. This period was disastrous as regards the integrity of the salt. The over-pressured aquifers above the: salt transmitted brine laterally for distances of 1500 feet or more to available well bores in oil wells with uncemented casing, or to abandoned oil wells plugged only in the surface pipe (200 to 400 feet). This is the period of initiation of the dissolution of salt beneath the Witt and Crawford Sinks. Nearly all of the shallow disposal wells were abandoned prior to the March 1, 1967 change of regulations, because of the impracticability of operating such shallow wells. Some were redrilled twice because of plugging off at the sand face, leaving three holes, often unplugged, at one location. In short, such wells did not do the job of brine disposal.
Disposing of large quantities of brine produced from Basal Sand wells flanking the Precambrian granite high in the older portion of the Gorham Oil Field was particularly difficult because no Arbuckle dolomite was present in which deep disposal wells could be completed. During the past 15 years, two extensive oil-field brine-gathering systems were constructed each with a pipeline three miles long to two Arbuckle disposal wells in Section 22, Township 14 South, Range 15 West. Many other Arbuckle disposal wells are also in use. There are no unlined surface brine ponds and no shallow disposal wells licensed for use in the Gorham Oil Field at present (1976). Water produced in secondary recovery water-flood projects is recycled.
History of well plugging
To understand the relationship of the Hutchinson Salt to the aquifers in their present condition, it is necessary to briefly review the history of plugging (or nonplugging) of wells in the Gorham Oil Field. Until 1930, there was no supervision, no regulation, and essentially no hole plugging, just abandonment with the salvage removal of all casing which could be pulled, tossing of available junk in the hole, and use of a fence post or concrete rig corner block as a surface plug. From 1930 to 1935, there was minimal regulation by the county. The first systematic plugging records date from 1935 when the state used county employees for plugging supervision on a fee basis. From 1941 to January 1, 1966, the State Corporation Commission, the regulatory agency, had salaried field plugging supervisors, but still the only plugging requirement, even in these years, was to protect zones of fresh water, defined as zero to 500 ppm chlorides. From January 1, 1966 to March 1, 1967, for the first time a cement plug was required opposite the depleted oil producing zone. At this time, too, "usable water" (500 to 5,000 ppm) was first recognized in plugging requirements. From March 1, 1967 to May 22, 1969, surface pipe regulations to protect fresh and usable water were revised more stringently and in addition, for the first time, it was required that any hole, not just oil and gas test holes, penetrating a salt water formation (over 5,000 ppm chlorides) be plugged so as to prevent migration of salt water into fresh or usable water zones. Previously exempt from plugging regulations were stratigraphic tests, structural core holes, seismic drill holes, salt test holes, water wells, etc.
This brief review shows that only in very recent years has there been any requirement for hole plugging beyond the minimum of protecting shallow fresh and usable water zones. The history of well plugging in the 50-year old Gorham Oil Field is more truly a history of nonplugging.
Present status, aquifers, Gorham Oil Field
The complications introduced by well plugging, or lack of plugging, and by the varied salt water disposal practices, has messed up the aquifers within the Gorham Oil Field to the extent that it is difficult to decipher pressure relationships and zone interconnections. It is also difficult to characterize the chemistry of the individual waters because they have been so badly mixed. Such mixed waters can be particularly corrosive. An example of rapid corrosion is the State Highway Commission test well in the Crawford Sink area in which new 4 1/2-inch casing leaked from corrosion in 18 months. With this background, the ten aquifers, or aquifer zones, recognized in Figure 35, and summarized in Table 41 are discussed as regards their relationship to the Hutchinson Salt in the Gorham Oil Field.
Aquifer 1, surface runoff water, is thought to be an important source of fresh water causing salt dissolution in the Witt Sinkhole.
Aquifer 2, the Dakota-Kiowa sandstones of Cretaceous age, is an excellent aquifer zone, depth range 175 to 400 feet, and there is no doubt that these sandstones were originally fresh-water-bearing within the Gorham Oil Field. They were never legally utilized for salt water disposal, but there was a prolonged period of use of extensive surface salt water ponds, evident on the 1938 and 1951 vertical air photographs examined, during which contamination of fresh-water-bearing aquifers did occur. Comparison of the two sets of water analyses in Table 4 shows the influence of oil-field operations. In all oil test holes, the Dakota-Kiowa sandstones are "protected" by surface casing. Even the older cable tool holes had 350 to 400 feet of casing through these rocks because of the physical impossibility of efficiently drilling deeper with a hole full of water. The Dakota-Kiowa sandstone aquifer, therefore, does not usually have much effect on salt dissolution.
Aquifer 3, the Cheyenne Sandstone, Cretaceous age, depths near 500 feet, thickens from a zero wedge edge east of the Gorham Oil Field in central Russell County to 60 feet within the oil-field limits. This evenly bedded marine sandstone formation apparently has always been brine-bearing, but because of its extensive use in the 1940s as a shallow disposal zone, it is difficult to get a water analysis that is representative. Although the average of five analyses is 16,059 ppm chlorides, the range is from 4,920 to 34,916 ppm chlorides. Information from fluid level measurements in the State Highway Commission's test well in the Crawford Sink indicates a 1967 static level near 200 feet from the surface for the Cheyenne aquifer. Of greatest significance is the presence of an excellent aquifer it shallow depth above the salt, with excess pressure, good permeability, and contained water quite capable of dissolving salt. Note, too, that waste oil-field brines injected into this aquifer for disposal from 1940 to 1961 were all unsaturated as to NaCl.
Aquifer 4, the Permian redbeds of the Nippewalla are water-bearing, particularly iii the uppermost 80 feet where the Cedar Hills Sandstone Member is developed. This member thins to zero east of the Gorham Oil Field, but thickens appreciably to the west and northwest. Where Cheyenne Sandstone rests directly on Cedar Hills Sandstone, as in the State Highway Commission's test well, the two are difficult to distinguish in modern rotary drilling and on gamma-neutron logs. They were easily distinguished by the cable tool drillers as in the Crawford No. 12 and No. 16 twin wells, depths 515 and 510 feet, by the brownish-red color of the Permian sandstone. Sufficient water was encountered from this zone to require setting 15 1/2-inch casing at 599 feet and 598 feet in these two holes. No analyses are available for the water in the Nippewalla aquifer in the Gorham Oil Field, but Frye and Brazil (1943) state that, "highly mineralized water has been encountered." The static water level of this aquifer was near 300 feet in the State Highway Commission's well after the 4 1/2-inch casing leaked, from March 6, 1969 to July 22, 1970, when the casing broke and hung loose. Because of the skimpy information available concerning the Nippewalla aquifer, before, during, and after its use as a shallow disposal zone, its role in salt dissolution is difficult to assess, but as an aquifer above the salt, it has potential for salt dissolution by gravity flow down old unplugged well bores.
The Sumner Group is not in aquifer; it is an aquitard. The top of this 800-foot thick group is marked by the Stone Corral Anhydrite encountered near 900 feet. Below the 40-foot anhydrite members are about 300 feet of impervious shaly silty redbeds above the 300-foot thick Hutchinson Salt Member, below which occur highly impervious anhydrites and interbedded red clay shales with a thickness of about 150 feet. The Hutchinson Salt Member has survived for 200 million years since mid-Permian time because it was so securely wrapped in a protective envelope of these aquitard redbeds. Only with the breaching of this protective cover in the past 50 years in the Gorham Oil Field by the 1600 oil and gas test holes (average density, 36 holes per square mile, with 10 holes in the least drilled square mile) has water been able to intrude into this impermeable aquitard to dissolve salt.
It is noteworthy that all of the aquifers below the Sumner Group, from the Chase Group, next below, to and including cracks in the Precambrian granite, depth near 3350 feet, are in some area of the Gorham Oil Field an oil or gas reservoir, indicating general saturation of the anticline with hydrocarbons and upward leakage probably through fracture systems such as that known in the Topeka Limestone, Shawnee Group. None of the aquifers above the Chase Group have any hydrocarbon "shows" testifying again to the imperviousness of the Sumner Group redbeds and salt as an aquitard, serving as a seal inhibiting fluid movement, either up or down, of hydrocarbons, or water.
Aquifers below the Sumner Group relate to the Hutchinson Salt principally by their presence as porous zones into which fluids from aquifers above the salt might drain by gravity flow if interconnected. Several of these aquifers are similar as indicated in Figure 35 and Table 4. They include: Chase, Council Grove-Admire, Wabaunsee, and Shawnee Groups. Note the inferred common pressures (Fig. 35) and similar chemical analyses, Table 4, with about 100,000 ppm chlorides.
In Aquifer 9, the Lansing-Kansas City Group, the brines have about twice the salinity of the underlying Arbuckle-Basal Sandstone Group, and about one-half the salinity of the more shallow Pennsylvanian and Permian aquifers. It is interesting and probably significant that in spite of the differences in chlorides, total solids, and specific gravity, the brines in the Lansing-Kansas City in their original reservoir condition appear to have been in pressure equilibrium with the shallower brines. This is illustrated in Figure 35, where Aquifers 5, 6, 7, and 8 are shown as having the same static fluid level as Aquifer 9-A, all about 700 feet below the surface of the ground. Column 9-A pertains to the original condition of the Lansing-Kansas City aquifer. During the 50 years that oil has been produced from these limestones, fluid conditions have varied widely. During the 1940s in many portions of the oil field, and specifically in the older area near the town of Gorham, bottom hole pressures were depleted to near-zero condition as indicated by column 9-B of Figure 35. During the 1960s and 1970s, secondary recovery by waterflood employed water from a Cheyenne sandstone supply well which was injected into the producing Lansing-Kansas City zones at 600 psi wellhead pressure. This is a bottom hole pressure of over 1900 psi as is suggested diagrammatically in column 9-C, Figure 35. The example shown by columns 9-A, 9-B, and 9-C emphasizes that the static fluid level of an aquifer or reservoir varies, and cannot be adequately described without a qualification as to time of measurement.
Aquifer 10, the Arbuckle Dolomite, is an aquifer of enormous capacity. The author considers the entire area of the Arbuckle Dolomite and Basal Sandstone within the Gorham Oil Field to be a single reservoir (aquifer) with an original oil-water contact near subsea -1450 feet. This broad picture fits with the concept of long distance migration of oil and gas and differential entrapment (Walters, 1958).
The truncated beds of the Ordovician and Cambrian Arbuckle Dolomite and Basal Sandstone are bounded on the lower side by the Precambrian basement rocks, and on the upper side by the sub-Pennsylvanian unconformity, a former land surface. Porosity and permeability were greatly enhanced by subaerial weathering in Pennsylvanian time with accompanying increase in carbonate porosity by partial dissolution. Inherited from the long exposure on a karst peneplain are the present dilute brines of this great common aquifer. The brines averaging 26,100 ppm chlorides are far less saline than those in shallower aquifers (Table 4) presumably because of dilution by and mixing with ancient rainwater. Pennsylvanian clays and limestones unconformably overlying the truncated Arbuckle beds acted as aquitards confining highly mobile hydrocarbons within the Arbuckle for about 250 million years since mid-Permian time.
The capacity of the Arbuckle Dolomite reservoir to either yield or receive fluid is so great as to often be limited by mechanical constraints such as size of casing, tubing, or pump. Three wells (January 1, 1975) with 3-inch tubing were each pumping 900 barrels of fluid per day and one well was regularly pumping 2000 barrels of fluid per day with a bottom hole Reda pump, or 58 gallons per minute from a depth of 3300 feet. The brine from these and other wells flows into an Arbuckle disposal well which has disposed up to 10,000 barrels of water per day, or about 300 gallons per minute, by gravity flow day and night for more than ten years without trouble or repairs. The principal role of this aquifer as regards salt dissolution within the Gorham Oil Field is that it served, and still serves, as an outlet or "sewer" of almost limitless capacity for receiving brines moved downward by gravity whether controlled within the casing of salt water disposal wells or uncontrolled through boreholes left unplugged below surface casing.
Surface Subsidence Areas--Gorham Oil field
History of investigation
In July 1970, Wallace K. Taylor, Regional Geologist, and Virgil A. Burgat, Chief Geologist, State Highway Commission of Kansas (renamed Kansas Department of Transportation, August 15, 1975), submitted an intradepartmental report, "Sinking Ground Along Interstate Highway 70 West of Russell, Kansas." An abstract of their report was published by Burgat and Taylor (1972). S. W. Fader (1975) published in redrafted and simplified form two maps and two cross sections from the Taylor and Burgat report. Using their data, he made theoretical calculations as to the amount and rate of salt dissolution at the two localities, and concluded that a flow rate of three to four gallons per minute across the salt face for 30 years would suffice to cause the measured subsidence.
Burgat and Taylor named the eastern area of sinking ground the "Crawford Sink," and the western location the "Witt Sink," using names originally given to the abandoned oil wells in the sink areas. The Crawford Sink surrounds abandoned twin oil wells 50 feet apart, Crawford No. 16 and Crawford No. 12, in the center of the NW NW SW of Section 2, Township 14 South, Range 15 West. The wells are 175 feet and 165 feet south of the hub of the highway. In August 1967, they supervised the drilling of the Highway Commission's test hole (location indicated by an open circle in Figures 33 and 34), 155 feet south of the highway hub, between these abandoned wells. Maximum subsidence occurs at the wells and totals more than 26 feet in 1976, affecting approximately 1000 feet of the highway lanes. The Witt Sink developed around the Witt No. 1 oil well, abandoned and plugged in 1957, located one-half mile west in the center of the NW NW SE of Section 3, Township 14 South, Range 15 West, 180 feet south of the hub of the highway. Maximum subsidence is at the well site and totaled about 17 feet in 1976. Subsidence affects about 750 feet of the highway lanes. Sinking is thought to have commenced shortly after the well was abandoned in 1957, and is still continuing.
A chronology of events concerning Interstate Highway 70 and these twin subsidence areas includes:
- 1938
- Aerial photograph. Crawford lease, 15 oil wells Witt lease, 15 oil wells. Many brine ponds, but no evidence of subsidence.
- 1951
- Aerial photograph. Witt No. 1 producing oil. Crawford Sink wells abandoned (plugged in 1941 and 1945). No indication of subsidence.
- 1957
- Aerial photograph. Pond 400 feet by 200 feet at Crawford location, indicating subsidence. Witt No. 1 oil well visible, butt no evidence of subsidence.
- 1965-1966
- Highway constructed. "Neither the existence of these wells nor the sinking ground was discovered until the highway was near completion" (Burgat, personal communication, October 1, 1975).
- 1967
- Highway Commission test hole (Crawford) drilled in August, as part of geological investigation of sinking ground.
- 1970
- Taylor and Burgat report submitted in July.
- 1971
- Highway rebuilt in summer months at a cost of about $250,000 after subsiding 4.0 feet (Witt area), and 3.50 feet (Crawford area).
- 1976
- To January 15, 1976, the subsidence of the rebuilt highway totals 3.35 feet (Witt), and 2.85 feet (Crawford). Bridge No. 3.99 (Crawford) undergoing differential settlement. Subsidence continuing at rate of one-half foot per year at points on the highway closest to the abandoned oil wells.
No other subsidence areas are known in the Gorham Oil Field. It is recognized that in this agricultural region other areas of subsidence of one or two feet, if not affecting a carefully surveyed highway, might go unnoticed unless water standing in a low spot interfered with farming.
Direct evidence of dissolution of salt
The Crawford Sink is unique in that several observations provide direct evidence of dissolution of the salt section, depth from 1293 to 1533 feet in the Highway Commission's observation well. The most conclusive data consists of measurements not included in the Taylor and Burgat reports, but preserved in their photographs, well logs, and files, all of which they considerately made available to the author. Figure 36 is a sketch from their photograph of the wellhead of the State Highway Commission of Kansas' test well at the Crawford Sink. When photographed in June 1969, the downward subsidence of the 8 5/8-inch casing relative to the 4 1/2-inch casing was 7.43 inches in 461 days, or a subsidence rate of about one-half foot per year. Most important is the fact that the subsidence is bracketed as occurring within and above the salt section. This is because the 4 1/2-inch casing was set at 1638 feet and cemented to 1372 feet, hence securely anchored to the rocks below and within the lower salt section. The 4 1/2-inch casing, completely free above the top of the cement, was under compression due to gravity. The 8 5/8-inch surface casing was set at 447 feet with cement circulated to the surface, hence was securely bonded to the near-surface rocks above the salt section. Because of evident strain, the 4 1/2-inch casing formerly welded to the 8 5/8-inch casing was cut loose on March 26, 1968, at which time it jumped up one-half inch. The 4 1/2-inch casing protruded further above the 8 5/8-inch casing with the passage of time.
Figure 36--Wellhead equipment, State Highway Commission of Kansas test hole, Crawford Sink. Sketch made from their photograph taken in June 1969.
Measurements were made every few months, and recorded for over a year during which the the casing continued to protrude at a rate measured at about one-half of an inch per month. On May 5, 1970, it was found that the 4 1/2-inch casing was broken near 990 feet with the fluid level inside the casing at 291 feet, the static level of the Permian Cedar Hills aquifer. On July 22, 1970, the 4 1/2-inch casing could be probed only to 947 feet. It had dropped and was hanging in the hole supported by the clamp. The 4 1/2-inch casing was again welded to the 8 5/8-inch casing. On July 14, 1971, the 4 1/2-inch casing could be probed only to 470 feet, indicating another break, and the fluid level both inside and outside the casing was at 233 feet, the static level of the Cretaceous Cheyenne Sandstone brine aquifer.
The 4 1/2-inch casing, originally dry, first leaked March 6, 1969 due to corrosion and/or settling after only one and one-half years of service. Static fluid level inside the casing was then at 296 feet. The first actual casing break near 950 feet, or stratigraphically opposite the Stone Corral Anhydrite, is thought to be due to slumping of a huge block of the massive anhydrite, shearing the casing. The last break near 470 feet opposite the Cheyenne Sandstone is thought to be due to corrosion from mixed waters formerly injected into that reservoir plus gravity adjustment in a salt dissolution subsidence area.
This direct evidence from the Highway Commission's observation test hole of subsidence specifically due to salt dissolution is confirmed by several other observations made by Taylor and Burgat including:
- The sudden drop of the bit for seven feet upon entering the void or cavern at 930-foot depth just above the top of the Stone Corral Anhydrite during the drilling of the Highway Commission's test hole.
- The lowering of the Stone Corral Anhydrite by removal of supporting material below the Stone Corral, as shown by comparative well logs.
- Lost circulation, or the complete and irrecoverable loss of fluid returns during drilling with rotary tools from the depth of 540 feet to 1670 feet total depth.
- Cementing of casing--when 4 1/2-inch casing was cemented near 1670 feet, it was desired to fill the hole with cement to the surface; calculations of double the volume of the drilled hole were used in ordering cement, yet the top of the cement reached only to 1372 feet, or stratigraphically within the salt section, coinciding with the base of a fast drilling zone from 1320 to 1380 feet.
In 1967, when the Highway Commission's test well was drilled, the near-surface Fence Post Limestone (slumped depth 46 feet) had subsided 19 feet. From the gamma-neutron log recorded August 30, 1967 (0.5 feet above the casing head; elevation 1861.55 feet on September 8, 1967) as compared with the drillers' logs of the Crawford No. 12, drilled December 1936, and the Crawford No. 16 twin well, drilled in June 1937, it may be determined that there was then 28 feet of subsidence on the top of the Permian redbeds, Nippewalla Group, depth 538 feet; 38 feet of subsidence on the Permian Stone Corral Anhydrite, depth 938 feet (marks the top of the Sumner Group, Cross Section I-J, Fig. 34); and about the same amount on the top of the salt encountered near 1300 feet. The twin Crawford wells are 50 feet apart, with the Highway Commission test hole between them. This increase in amount of subsidence is additional evidence for salt dissolution as the cause of subsidence.
Evidence for solution of salt by other than surface water
The earliest sign of localized subsidence of the Crawford Sink was the "ponding" of an intermittent stream recorded in vertical aerial photographs taken in 1957. The area of the pond was about three acres on April 2, 1963. The highway was constructed in 1965-1966. The very presence of ponded fresh water infers lack of downward connection with the salt section.
During exploratory drilling for shallow mapping of the structure of the subsidence area, it was found that a test hole 150 feet from the proposed location of the Highway Commission's deep test hole had flowing fresh water in the upper Dakota Sandstones at a depth of approximately 200 feet. A water well was completed and used for the rotary drilling of the Highway Commission's test hole to a depth of 550 feet, or stratigraphically to just below the Cheyenne Sandstone, at which depth circulation was suddenly lost, never to be regained during drilling operations, indicating a connection with the void area (presumably salt section void) below. At that time, the water well suddenly went dry. In the test hole itself, water could be heard falling. To complete the drilling of the Highway Commission's test hole, it was necessary to drill "blind" which is without return circulation. All available water trucks, fifteen, were utilized in hauling water for drilling fluid. They hauled 14,685 barrels (616,770 gallons) of fresh water. The history of these two holes provides evidence, therefore, that the surface water pond at the Crawford Sink and the fresh water in the Dakota Sandstone water well, near 200-foot depth, are part of a perched water table separated from the salt section by shale beds from 225 feet to 296 feet in depth. It is concluded that very little, if any, of the extensive salt solution resulting in collapse and development of the surface sink area and highway subsidence is due to surface water.
Source of water dissolving salt
The Cretaceous Cheyenne Sandstone, depth 496 to 568 feet, in the Highway Commission's test hole is a source for water undersaturated as to sodium chloride capable of dissolving large quantities of salt and corroding casing. Likewise, the Permian Cedar Hills Sandstone, Nippewalla Group, encountered within the interval from 568 to 938 feet, is an excellent aquifer. Both zones were utilized for salt water disposal in the closest shallow disposal well, shown in Figures 33 and 34 as 1500 feet southeast of the Crawford Sink. This shallow disposal well, total depth 665 feet with 8-inch casing set at 443 feet, was in use for many years after its completion in September 1936. Another shallow disposal well is known to have been present 1500 feet northeast of the Crawford Sink, and a third shallow salt water disposal well is located in the S2 of Section 3, 3000 feet southwest of the Crawford Sink, and 1300 feet south of the Witt Sink, as mapped in Figure 33 by the symbol for "SWD." One such shallow disposal well in Section 1, about 8000 feet east of the Crawford Sink, was still in use January 1, 1975. Large quantities of salt water were introduced into both the Cheyenne and Cedar Hills formations under more than static pressure, so that the sandstones were thoroughly charged with a mixture of their native water and brine from Kansas City limestones and/or from the Basal Sandstone. Such mixed waters are commonly corrosive and may themselves have been the cause of casing corrosion leading to leakage in the Crawford No. 12, Crawford No. 16, Witt No. 1, and in the Highway Commission's test hole.
It is concluded that the principal source of the water which dissolved salt under the Crawford and Witt Sinks was oil-field brine disposed in shallow disposal wells in the vicinity. With the abandonment of the shallow salt water disposal wells and with the passage of time, excess pressure on the Cheyenne and Cedar Hills sandstones appears to have been relieved by downward drainage through such holes as the Crawford and Witt holes under discussion. Evidence of this is provided by the fluid levels measured in the Highway Commission's test hole in 1967 at which time the static level of the Cheyenne aquifer was near 200 feet, and the static level of the Cedar Hills Sandstone aquifer was near 300 feet. Subsidence is continuing, but at a declining rate.
Table 5--Subsidence: U.S. Interstate Highway 70, Russell County, Kansas.
| Maximum Subsidence in Feet |
Time in Days |
Ending Date |
Rate of Subsidence in Feet Per Year |
|---|---|---|---|
| Crawford--Westbound Lane | |||
| 1.85 | 1-26-1970 | ||
| 0.75 | 476 | 5-17-1971 | 0.575 |
| 2.60 | |||
| 1.20 | 863 | 12-20-1973 | 0.507 |
| 0.85 | 756 | 1-15-1976 | 0.410 |
| 2.05 | |||
| Crawford--Eastbound Lane | |||
| 2.40 | 1-26-1970 | ||
| 1.10 | 476 | 5-17-1971 | 0.844 |
| 3.50 | |||
| 1.60 | 850 | 12-7-1973 | 0.687 |
| 1.25 | 769 | 1-15-1976 | 0.593 |
| 2.85 | |||
| Witt--Westbound Lane | |||
| 3.15 | 1670 | 5-17-1971 | 0.688 |
| 3.15 | |||
| 2.00 | 850 | 12-7-1973 | 0.859 |
| 0.80 | 769 | 1-15-1976 | 0.380 |
| 2.80 | |||
| Witt--Eastbound Lane | |||
| 4.00 | 1670 | 5-17-1971 | 0.874 |
| 4.00 | |||
| 2.30 | 850 | 12-7-1973 | 0.988 |
| 1.05 | 769 | 1-15-76 | 0.498 |
| 3.35 | |||
| Notes: Highway constructed in 1965-1966. Highway rebuilt through sink areas, summer 1971. |
|||
Figure 37--Subsidence in feet of eastbound lane of Interstate Highway 70, 1971-1976. Arrows indicate positions of abandoned oil wells about 150 feet south of highway.
Present status, Crawford Sink
The Crawford Sink area is a "prairie pothole" pond about five acres in size, with marshy conditions, cattail vegetation, and (Spring 1974) a pair of nesting Canvasback ducks. Most of the oil wells are abandoned, as mapped in Figure 33 which shows well status on January 1, 1975. The SW of Section 2, on which the sink is located, has been returned to agriculture, and there is no surface evidence other than the subsidence area and pond to show for nearly 50 years of oil activity. The bridge on the section line road between Sections 2 and 3 over Interstate Highway 70 has settled differentially two feet on the nearest (southeast) abutment, and is under torque stress. The wellhead equipment for the Highway Commission's test hole, illustrated in Figure 36, is under water. Subsidence affecting both lanes of Interstate Highway 70 and the section line bridge is continuing, but at a diminishing rate. Table 5 shows the maximum highway subsidence in feet for the period from highway construction in 1966 to the time of rebuilding the highway in the summer of 1971, and compares the pre-1971 subsidence with that occurring after rebuilding the highway. Subsidence affecting the eastbound lane at both sinks since the highway was rebuilt is shown graphically in Figure 37.
Present status, Witt Sink
The Witt Sink, one-half mile west of the Crawford Sink, is smaller, less conspicuous, and not as thoroughly studied. A closed sinkhole depression (Fig. 33) has developed around the Witt No. 1 abandoned oil well located a few feet south of the highway fence. A steep gully leads from the highway directly to the sunken well bore of the abandoned well. Subsidence has caused rainwater to run directly from the highway into the well bore which acts as a storm sewer. It is reported that during heavy rains, a temporary pond forms. This unplanned method of draining a small area of Interstate Highway 70 is a factor affecting the rate of subsidence in this sink. The maximum measured rate of about one foot per year for the eastbound lane occurred in 1973. Subsidence since has diminished to about one-half foot per year, as listed in Table 5 and illustrated on Figure 37.
It is thought that the principal cause of salt dissolution was the former use of shallow disposal wells within 1500 feet of the Witt Sink. Surface water intake directly into the abandoned well bore is considered a secondary contributing factor. It is not understood exactly why and how the well bore takes fluid, as the official well plugging report filed with the Kansas Corporation Commission shows both 7-inch and 5 1/2-inch casing left in the hole, with a total of 200 sacks of cement used in plugging both the hole and the annular space between the two casing strings.
The present status of the Witt Sink is that it is a problem area for the Department of Transportation. Continuing subsidence enlarges the sinkhole area, and increases the internal storm water drainage down the well bore of the abandoned Witt No. 1.
Prev Page--Land Subsidence Areas || Next Page--Conclusions
Kansas Geological Survey, Geology
Placed on web July 24, 2009; originally published February 1978.
Comments to webadmin@kgs.ku.edu
The URL for this page is http://www.kgs.ku.edu/Publications/Bulletins/214/05_oil.html