![]()
Prev Page--Introduction || Next Page--Land Subsidence Areas
Part I: Salt Deposits of Kansas: Regional Geology
Hutchinson Salt Member of the Wellington Formation
Extent
The Hutchinson Salt Member of the Permian Wellington Formation is present in the subsurface under much of central and south-central Kansas, as is depicted in Figure 1. Thickness of the salt reaches a maximum of 555 feet in northwestern Oklahoma; the increased thickness of the unit is supplied by increased thickness of the salt beds and also by an increase in number and thickness of anhydrite interbeds. The zero thickness line marks a depositional edge to the west, the northwest, the north, and the northeast. The east edge of the salt, where the contours are close together, is an erosional edge. On the southwest the Hutchinson Salt Member undergoes a facies change to anhydrite and dolomite.
Figure 1--Extent and thickness in feet of the Hutchinson Salt Member of the Wellington Formation, Permian System. Kansas portion modified from Schumacker (1966). Oklahoma portion by Johnson (1976). The location of Cross Section A-B (Fig. 2) is indicated within the shaded area (Fig. 3).
Figure 2 is a northwest to southeast cross section representative of a section 150 miles long, which illustrates the westward dip of the salt, the westward gentle rise in the elevation of the land surface, and shows the natural solution truncated eastern updip edge of the salt. Commercial salt operations in Kansas traditionally have been located as far east as possible to minimize the depth to the salt, yet still encounter the salt section intact and unaffected by the eastern natural dissolution edge. This explanation accounts for the concentration of salt mines at Hutchinson, known since the turn of the century as "The Salt City." The more modern concentration of salt cavity liquefied petroleum gas (LPG) storage operations at Hutchinson, at Conway just west of McPherson, Kansas, and elsewhere (mapped in Fig. 3) are sited at locations which will provide adequate depth confinement to contain the products under pressure in liquid phase.
Figure 2--Cross section A-B. Length of section depicted is 150 miles. Vertical exaggeration x 100. Figures indicate elevation in feet above mean sea level. Locations of cross sections indicated in Figures 1 and 3. Control borings drilled for oil, gas, salt, or water, numbered 1 to 25, are listed in Appendix B. Shaded areas = unconsolidated beds, water-bearing; R = river.
| Strata | |||
|---|---|---|---|
| C | Cretaceous | ||
| P | Permian | ||
| P-1 | Nippewalla Group | ||
| P-2 to P-5 | Sumner Group | ||
| P-2 | Ninnescah Shale | ||
| P-3 | Wellington Shale | ||
| P-4 | Hutchinson Salt Member | ||
| P-5 | Wellington Shale-Anhydrite | ||
| P-6 | Chase Group | ||
Appendix A provides a descriptive listing of subsidence areas, salt test holes, underground salt mines, solution mining sites, and LPG storage installations in salt, the approximate locations of which are mapped in Figure 3. Appendix B lists the borings--oil test holes, salt test wells, water wells used in the construction of Cross Section A-B--through locations mapped in Figure 3, and lists the locations of test holes illustrated in other cross sections.
Figure 3--Index map, ten counties in central Kansas. Indicates location of (a) Cross Section A-B, (b) subsidence areas, and (c) salt mines, etc. Abbreviations: Hutchinson Naval Air Station (HNAS); ;U.S. Atomic Energy Commission (AEC); Liquefied Petroleum Gas (LPG).
Figure 4 is a natural scale cross section (no vertical exaggeration), length represented 1.7 miles, near Lyons, Kansas, about midway of the regional Cross Section A-B, Figure 2. Figure 4 shows the Hutchinson Salt, the Carey Salt Company mine at Lyons, Kansas, the relation of the salt to the deeper and shallower rocks, and to the water-bearing zones ("W") or aquifers. Depth from ground surface to mine floor is 1024 feet. Wells and shafts numbered 1 to 9 are listed in Appendix B.
Figure 4--Cross section C-D, natural scale, near Lyons, Kansas. Length of section depicted is 1.7 miles. Wells and shafts are listed in Appendix C. Also shown is the Lyons, Kansas, mine of the Carey Salt Company in the Hutchinson Salt Member. Abbreviations used: W = water; QUAT = Quaternary, unconsolidated deposits; CRET = Cretaceous; PENN = Pennsylvanian; LANS-KC = Lansing-Kansas City Group; MISS = Mississippian; ORD = Ordovician; C-ORD = Cambro-Ordovician; PRE-C = Precambrian basement rocks.
Overview
Viewed in the perspective of the regional index map (Fig. 1) the Hutchinson Salt is seen as a laterally persistent but thin rock unit covering 27,000 square miles within the State of Kansas. The ten-county study area is marginal to the Kansas salt basin, and viewed even more broadly the entire Hutchinson Salt area is marginal to the great Permian Basin salt deposits of Oklahoma, Texas Panhandle, and southeastern New Mexico (Bachman and Johnson, 1973) which covers an area of about 100,000 square miles.
It has long been recognized that the west, northwest, north, and northeast edges of the Hutchinson Salt (Fig. 1) are depositional edges (Bass, 1926), and that the updip east edge was solution-eroded due to natural access to the water table. This has been confirmed in general by Kulstad's (1959) map of the salt beds in Kansas, prepared in the middle 1950s but not published until 1959, and by Schumaker's map (1966). It has been further verified by Dellwig (1963 and 1971) in detailed studies of salt mines and cores. Considering the shoal water and basin margin environment of salt deposition, the lateral persistence of the Hutchinson Salt as a unit is remarkable. Within the outline of the salt area in Figure 1, no boreholes failed to penetrate salt, although thickness and quality vary. The fact that the salt is everywhere present is well recognized by the oil and gas drilling industry in Kansas. The salt beds are characterized by very rapid drilling penetration rate, commonly as much as 180 feet an hour with modern rotary tools. In oil and gas well drilling, the salt beds are routinely drilled with fresh water which is readily available (salt water is not as cheap or easily obtained). Drilling mud programs are engineered for salt brine mud systems with the salt provided by dissolution of the Hutchinson Salt during drilling.
Although the Hutchinson Salt Member is remarkable for its wide lateral continuity as a unit, individual salt beds, separated by shale interbeds and with shaly partings, commonly are continuous only a few miles. Dellwig (1971) states, "the salt consists of a succession of layers. The area underlain by any single bed is small compared to the area underlain by the entire salt unit, indicating a continual shifting of the locus of deposition. Correlation (based entirely on logs) also indicates that individual strata are imbricate and have an oblique relationship to the upper and lower boundaries of the salt unit as a whole. Key beds can be correlated only for short distances. In studies of mine areas, correlation of key beds offers no problem but it is important to note that one should not expect to project local stratigraphic units from marginal areas (Hutchinson, Lyons, and Kanopolis mines; AEC holes) toward the basin center and anticipate an increase in thickness or improvement in quality of a salt unit . . ."
Perhaps even more remarkable than the lateral depositional extent of the Hutchinson Salt is the intact preservation of these water-soluble halite beds over the time period of about 250 million years since the Leonardian Stage of the Permian Period. This preservation is due to the seal afforded by the impermeable Permian redbeds, shale and silty shale, immediately overlying the salt and to the Kansas locality in the geologically stable heart of the North American continent. These salt beds have been subject to no intense tectonic forces but only to gentle, vertical, epeirogenic movements for that time period. The redbeds can be quite thin and still preserve the salt beds. Dellwig (1963) has published a detailed cross section based on cores of salt encountered in Sedgwick County at depths just below 200 feet showing undissolved halite beds truncated by the overlying Permian shales, but "the contact between the salt and the overlying shale is clean and sharp and there is no indication of post shale-deposition solution of the salt and collapse of the overlying shale unit."
Natural dissolution
Just east of the area where salt occurs at depths as shallow as 200 feet is the area shown on Figure 1 by the parallelism and convergence of the 200-foot and zero salt thickness lines which mark the updip east edge of the Hutchinson Salt. For over 100 miles, time active dissolution front in which the Hutchinson Salt is being dissolved by ground water on its updip east edge is marked by the erratic and poorly mapped "Wellington lost circulation zone" of oil well drillers. This is a zone of partial to total dissolution of rock salt due to natural causes in which the void space created by salt removal has only partially been closed by collapse and gravity slumping, leaving cavernous void space forming a brine-filled conduit which is capable of either yielding large quantities of brine when pumped or of taking large quantities of fluid such as drilling mud. Penetration of this zone while drilling can cause lost circulation problems which at times can lead to the loss of the hole. Redrilling sometimes only 50 feet distant may miss the zone. The circulation path of this narrow zone extends along the salt front from near Wellington, in Sumner County, over 100 miles north to the proximity of Salina, Kansas. It has been investigated by O. S. Fent (personal communication) whose work is acknowledged here, and by Lane and Miller (1965, pp. 15-21).
The only natural dissolution of the Hutchinson Salt occurs along this updip east salt face. In Pleistocene time and continuing to the present, surface subsidence above the solution front resulted in sink and valley formation. A succession of such subparallel north-south valleys, now sediment filled, formed as the salt dissolved and the salt front receded westward. The study of these valleys which have extensive "closed lows" indicative of solution origin and the dating of the Pleistocene to Recent sediments filling them which are important fresh water aquifers has enabled Fent to conclude that the westward retreat of the salt front due to natural dissolution occurred at an average rate of four miles a million years during early Pleistocene time and at a rate of about two) miles a million years in late Pleistocene time, continuing to the present.
In Cross Section A-B, Figure 2, near the Little Arkansas River (Well Nos. 20 and 21), the cross section transects a portion of the extensive well field developed for time municipal water supply of Wichita, Kansas. In the deepest part of the solution-slump valleys, formed as a result of the removal of 300 feet or more of salt, the water-bearing sand and gravel fill of Pleistocene age reaches a thickness of 275 feet.
Except for natural dissolution along the updip east edge of the Hutchinson Salt there are no instances of dissolution within the salt mass over hundreds of square miles prior to the advent of man's drilling oil and gas tests during the past 50 years and mining salt during the past 88 years, the effects of which are the subject of this investigation. In short, no natural dissolution (or subrosion) of the Hutchinson Salt from its top downward has been detected to the knowledge of the author.
Lithology
Because an evaporite sequence such as the Hutchinson Salt and the associated underlying massive anhydrites does not crop out at the surface in a humid climate such as Kansas had in Pleistocene time, there is no "type locality" for the Hutchinson Salt in the usual sense. The salt is named from the mines at Hutchinson, Kansas (Fig. 5). Although salt has been produced continuously at Hutchinson since 1888, the mines themselves provide a poor type section because underground mining of salt is usually confined to a single bed (thought to be approximately the same bed in all mines) selected for its high purity. Commonly the shaft which provides the only penetration of the entire salt section is cemented over, and the shafts frequently are not dug as deep as the base of the salt. Wells drilled with cable tool type drilling rigs for salt and/or oil or gas from 1888 to the 1930s yielded samples in the form of cuttings representing a 10 foot drilling run; hence details of the salt beds are obscured. Excellent suites of wire line geophysical logs of holes drilled more recently with rotary tools provide detailed information, but the best information concerning the Hutchinson Salt is provided by actual cores of the salt itself. In 1958 a test hole located south of Hutchinson was cored through the entire Hutchinson Salt. The site was the former Hutchinson Naval Air Station; hence the test hole is known as HNAS Core Hole No. 1. Its location is in the SE NE of Section 29, Township 24 South, Range 5 West, Reno County, Kansas (Fig. 3). Its core description now serves as a reference locality for the Hutchinson Salt.
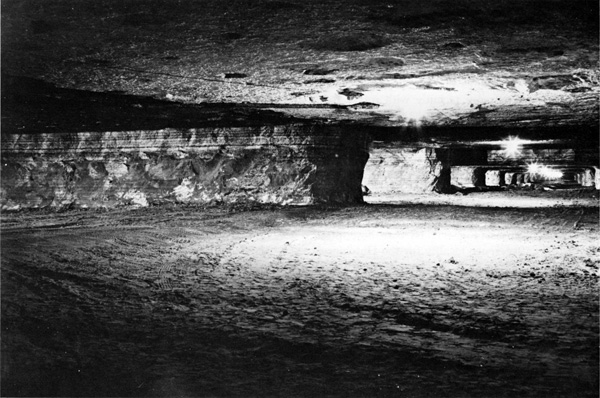
Figure 5--Carey Salt Company mine, Hutchinson, Kansas, showing light and dark banding in the Hutchinson Salt. Photograph courtesy of Underground Vaults and Storage, Inc. Hutchinson.
C. L. Jones (1965) published a detailed lithologic and petrographic description of the 286 feet of salt section and interbedded rocks present in the cores from HNAS Core Hole No. 1 from 426 feet to 712 feet, together with gamma-ray and neutron logs of the hole. Because of the importance of HNAS Core Hole No. 1 as a reference section for the Hutchinson Salt Member, and because the USGS Bulletin by C. L. Jones provides the only published details concerning lithology and mineralogy of a complete section of the Hutchinson Salt in Kansas, an error of omission in his published lithologic description is hereby corrected by use of photocopies lie furnished of his original core description notes (C. L. Jones, personal communication, July 9, 1974) from which the following additions (marked by asterisks) are abridged:
| The Geotechnical Corporation HNAS Core Hole No. 1 SE NE of Section 29, Township 24 South, Range 5 West Reno County, Kansas Addenda to core description by C. L. Jones (USGS Bulletin 1201-A, 1965) [*Indicates additions to core log as published by C. L. Jones (1965).] |
|||
|---|---|---|---|
| 520'-2" | 525'-7" | 5'-5" | Halite rock, description correct as published on page A-58 |
| *525'-7" | 526'-9" | 1'-2" | Clay shale, medium bluiSh gray cut by veins of orange halite |
| *526'-9" | 527'-4" | 7" | Anhydrite rock; has a 2-inch clay shale seam with orange halite veinlets |
| *527'-4" | 528'-5" | 1'-1" | Halite rock, anhydritic and argillaceous; coarse grained (1/4" to 3/8"), grayish color |
| *528'-5" | 531'-0" | 2'-7" | Clay shale; interlaminated medium bluish gray and gray; prominent veins of amber halite in part cut by anhydrite nodules |
| *531'-0" | 532'-0" | 1'-0" | Halite rock; interval incorrectly published but description correctly published at top of page A-59 |
| 532'-0" | 534'-2" | 2'-2" | Halite rock; description and interval correctly published on page A-59 |
Jones (1965) determined from complete lithologic and petrographic examination, using rock units as thin as one inch, that the 286-foot thick Hutchinson Salt Member in the reference locality, HNAS Core Hole No. 1, included 82 percent halite, 3 percent anhydrite, 4 percent carbonate (either magnesite or dolomite), and 11 percent shale including minor amounts of siltstone.
C. L. Jones (personal communication, July 9, 1974) correlates a 7-inch anhydrite seam near 647 feet with a similar anhydrite bed one to four feet below the mine floor in the Carey Salt Company underground mine at Hutchinson, and considers the salt cored from about 635 feet to 645 feet to be the bed mined. Likewise he considers the fossiliferous layer at depth of 698 feet as very similar to a fossiliferous layer at the base of the salt 44 feet below the mine floor in the Carey underground salt mine at Lyons, Kansas.
When the U.S. Atomic Energy Commission (AEC) undertook all investigation of the area surrounding the Carey Salt Mine at Lyons, Kansas in which they had been conducting experiments for almost a decade, it was found that specific information concerning the subsurface salt (other than the one 9-foot bed mined), the Permian redbeds above the salt, and the anhydrites below, was almost nonexistent. The AEC contracted the coring of two holes at Lyons in 1970, designated as AEC Test Holes No. 1 and No. 2. Not until cores were recovered in 1970 was it relearned why miners laboriously hand digging a mine shaft in 1889 in search of salt had continued their shaft more than 200 feet below the top of the salt. Cores from AEC Test Hole No. 1 showed that the first 100 feet of salt section included 25 percent shale, measuring only beds one foot in thickness or more. In addition, thin shale partings were present in the dirty (clayey) salt. These cores confirmed what the old miners knew, that the mined bed near the base of the salt, depth 1013 feet to 1024 feet in the Carey Salt Mine, was the cleanest and most minabie bed (free of shale partings) encountered. The same bed, and no other, is still being mined underground at the American Salt Company mine at Lyons (Lomenick, 1972), and is believed to be the same bed mined 30 miles north in Ellsworth County. Even the bed which is mined because it is the "cleanest" salt often shows light and dark banding or laminae ("Jahresringe"--Dellwig, 1963) of clay or anhydrite spaced 0.25 inches or more apart, with no regular spacing of the laminae, and the salt crystals show considerable variance in size. This is illustrated in Figure 5.
The gross lithology of the Hutchinson Salt and the beds directly above and below it, plotted from field descriptions of cores recovered from AEC Test Hole No. 1, Section 26, Township 19 South, Range 8 West, Rice County, Kansas, is illustrated in both Figure 6 and Figure 7 as the center lithology column. The various wire line geophysical logs, and their usefulness for delineating salt are discussed below. Appendix A lists the five holes in Kansas from which cores of the entire salt section were recovered for the U.S. Atomic Energy Commission, and states the repository of each of the cores. No detailed lithologic or petrographic study comparable to that of Jones from the HNAS Core Hole No. 1 was made.
Thickness
The generalized thickness of the Hutchinson Salt Member is mapped in Figure 1 with a contour interval of 200 feet, and is illustrated in the regional cross section (Fig. 2). The maximum gross thickness of the Hutchinson Salt Member in Kansas is 515 feet (Schumaker, 1965). By selective use of quality-controlled well logs, the principle was established by the author that the salt is locally thinner over anticlinal structures and locally thicker in the intervening gentle synclines. The mapped areas of thin salt coincide with most of the major oil fields in the central portion of the map. The thick salt areas overlie synclines separating oil fields. Examples illustrated on Cross Section A-B, Figure 2, are Well Nos. 2 and 6 (anticlines with thin salt) and Well Nos. 3 and 7 (synclines with thick salt). Although exact bed-by-bed correlations cannot be carried across the several hundred square miles of area from log study, it can be shown that the salt thickness varies due to some combination of:
- Loss of salt beds at base of salt section;
- Absence of salt beds in upper middle portion of the salt section;
- Loss of salt beds at the top of the salt section.
From available well logs it is relatively easy to accurately determine the top of the salt, but relatively difficult (and often impossible) to accurately determine the base of the salt section because a transition zone is present at the base of the salt section. For example, Dellwig (1971) identified fifteen lithological units, largely salt, in nine feet of core from 1077 feet to 1086 feet (base of the salt section 1084 feet) from AEC Test Hole No. 1 (Fig. 6) and specifically correlated each of the fifteen equivalent beds (largely devoid of salt) as all present in four feet of core from 1002 feet to 1006 feet from AEC Test Hole No. 2 (1 1/4 miles distant) in which the base of the salt was 1004.5 feet. Such fine discrimination requires cores studied by experts and is beyond the resolving power of even the best geophysical log suites. This example confirms the presence, recognized on a broader scale in log studies, of a basal transition zone sometimes salt-bearing, sometimes not, with a thickness varying from zero to over 40 feet. This basal transition zone indicates that anticlinal areas which were also gentle topographic highs were present in mid-Permian time during the deposition of salt in Kansas, with more and thicker salt beds deposited in the lows than on the highs.
Legend for Figures 6 and 7
| Gamma | Gamma-Ray Log in API units. Radioactivity increases to the right. |
| Density | Gamma-Gamma Log or Formation Density Log compensated for variations in hole diameter. Scale indicates bulk density in grams/cc. Commonly printed on the right side of multi-log prints, but here placed on the left near the gamma log to emphasize the similarity of the two logs (in shale and salt) and the dissimilarity (in anhydrite). Anhydrite commonly records as 2.9, halite as a little over 2.0 units. |
| Caliper | Measures the diameter of the hole in inches within limits of the "reach" of the logging tool. |
| Neutron | Neutron Log in API units. This log is highly sensitive to hole size and is only effective in nearly out-to-gauge holes through the salt section. In enlarged holes this log loses character. |
| Resistivity | A resistivity log made with current focused. Measures electrical resistivity in ohms per square meter per meter (m2m), recorded on a logarithmic scale. |
| BHC Sonic | Borehole Compensated Sonic Log, corrected for variations in hole size with interval transit time of sound recorded in microseconds per foot. Ideal travel time in halite is 67, and in anhydrite is 50 units. Also termed "Compensated Acoustic Velocity Log." |
Figure 6--Wire line geophysical logs (depths in feet from ground surface). AEC Test Hole No. 1--Sec. 26, T. 19 S., R. 8 W., Rice County, Kansas. Gamma ray, density, caliper, and neutron logs
Figure 7--Wire line geophysical logs (depths in feet from ground surface). AEC Test Hole No. 1--Sec. 26, T. 19 S., R. 8 W., Rice County, Kansas. Gamma ray, caliper, resistivity, and BHC sonic logs.
The absence of salt beds in the upper middle portion of the salt section is associated with one or more disconformities marked by shale beds with a thickness from 1 to 10 feet. In the upper 100 feet of the salt section, shale beds, each more than one foot thick, constitute 25 percent of the interval thickness. The depositional environment of the Hutchinson Salt was a broad shallow embayment, perhaps with extensive tidal mud flats. Desiccation cracks, large-scale polygons, and salt hopper crystals confirm the very shallow water environment (Dellwig, 1971). The absence of salt beds, locally, in this part of the section may be due to redissolution of the salt by incursions of muddy fresh water depositing the shale interbeds. Shale-filled channels can be seen exposed in the walls of the Carey Salt Mine at Lyons.
The local loss of salt beds at the top of the section may be due to nondeposition, but has been shown by Dellwig (1971) to be in part due to early post-depositional truncation in Permian time, based on three core holes near Clearwater, Sedgwick County, Kansas. This may also be the situation at Hutchinson. Cargill, Inc.'s Core Hole No. H-9, drilled in 1976 in the E2 SW of Section 19, Township 23 South, Range 5 West, penetrated 355 feet of salt from 409 feet to 764 feet. This is 69 feet, or 24 percent, more salt than the 286 feet present seven miles south in the reference locality, the HNAS No. 1, described by Jones (1965). The additional salt section consists of massive salt beds at the top of the section in the No. H-9 core hole. They may have been removed by erosion in Permian time in the vicinity of the HNAS Core Hole No. 1. Jones describes contact of the salt and the overlying Permian shale as "sharp but somewhat sinuous" in cores from the HNAS Core Hole No. 1.
There is no direct evidence of thickening and/or thinning of salt beds by salt flowage. The beds are nearly horizontal with regional dips of only about 30 feet per mile (1/3 of 1°). It is thought that the maximum depth of burial in the 200+ million years since deposition of the salt is less than 4000 feet. The present overburden thickness ranges from 400 feet to 2500 feet within the study area. These observations provide indirect evidence of the absence of thickness variations due to salt flowage. The stable continental position and the depth of burial too shallow to mobilize salt flowage on a regional basis (Gera, 1972) confirm this conclusion.
Younger Permian Salts in Kansas
Lower Cimarron Salt
This salt, named from the Cimarron River area of Oklahoma, is developed under the Cimarron Anhydrite (Stone Corral of Kansas) and is mapped by Schumaker (1965) as present in five counties in southern Kansas, adjacent to the Oklahoma border. Jordan and Vosburg (1963) have described and mapped the extent of this salt plus the upper Cimarron Salt (absent in Kansas) and two younger salts in an excellent brief publication, "Permian Salt and Associated Evaporites in the Anadarko Basin of the Western Oklahoma-Texas Panhandle Region." No comparable publication exists summarizing Permian salts in Kansas.
Blaine Salt
This salt is present in western Kansas west of the area of the Hutchinson Salt Member of the Permian Wellington Formation, and in eastern Colorado. Bayne (1972) reproduces a map prepared in the 1950s by Robert O. Kulstad for the State Geological Survey of Kansas showing a maximum thickness of 600 feet. The equivalent salt in the Oklahoma and Texas Panhandle is termed the Flowerpot Salt (Jordan and Vosburg, 1963).
In 1972, the Blaine Salt was cored in AEC Test Hole No. 5 near the center of Section 22, Township 19 South, Range 37 West, Wichita County, Kansas. This is believed to be the only hole cored entirely through this salt. The rocks recovered included 253 feet of salt with discrete large (1/4"-1") halite crystals mostly free of inclusions but separated by intercrystalline red clay. Holdoway (1978) attributes the origin of this unusual and thick salt to mud flat conditions in a continental basin which was subject to occasional flooding by the sea.
Commercial development
With the exception of one LPG storage area operated by Amoco in Grant County, there is no commercial development of the Lower Cimarron Salt and the Blaine Salt in Kansas.
Land subsidence
Both the Lower Cimarron Salt and the Blaine Salt are associated with lost circulation zones caused by natural dissolution of salt and with areas of land subsidence which have been called solution-collapse basins. These include, in Clark County, Big Basin measuring one mile from rim to rim, and the adjacent Little Basin, one-fourth mile from rim to rim, which in its lowermost portion breaches the water table in what is known as Saint Jacob's Well (Shumard, 1974). In Meade County, the Meade Salt Sink (Frye, 1940), the Jones Ranch Sink, and others (Frye, 1950), have been described by Frye and by Frye and Schoff (1942). All examples are natural occurrences. There are 110 known areas of land subsidence in Kansas associated with the dissolution of these younger salts due to man's activity.
Prev Page--Introduction || Next Page--Land Subsidence Areas
Kansas Geological Survey, Geology
Placed on web July 24, 2009; originally published February 1978.
Comments to webadmin@kgs.ku.edu
The URL for this page is http://www.kgs.ku.edu/Publications/Bulletins/214/03_salt.html