![]()
Prev Page--Geology || Next Page--Geologic Formations
Ground Water
Principles of Occurrence
The rocks and surficial deposits that form the crust of the earth generally are not solid but contain many open spaces, called voids or interstices. It is in these spaces that water is present below the surface of the earth and from some of which, those in the zone of saturation, a part of it is recovered through springs and wells. There are many kinds of rocks and they differ greatly in the number, size, shape, and arrangement of their interstices and therefore in their water-bearing properties. The occurrence of ground water in any region, therefore, is determined by the geology of the region.
The interstices of rocks range in size from pores of microscopic dimensions to openings several feet wide, and they can be divided into two classes, primary and secondary. The primary or original interstices, of which the commonest are pores in fragmental rocks such as sand and sandstone, were formed when the rock was deposited. The secondary interstices, the commonest of which are fractures, were formed by the different processes that affected the rock after deposition. In Cloud County all the water-bearing rocks are sedimentary rocks, and the openings that hold the water are either the open spaces between the grains of the rocks, which are primary interstices, or joints, crevices, and openings along bedding planes that have resulted from deformation of the rocks, which are secondary interstices.
The amount of water that can be stored in a rock depends upon its porosity. Porosity is expressed quantitatively as the percentage of the total volume of the rock that is occupied by interstices. When all interstices in a rock are filled with water the rock is said to be saturated. The amount of water that a saturated rock will yield to the pull of gravity is known as the specific yield. The amount of water that a given rock can hold is determined by its porosity, but the rate at which it will yield water to wells is determined by its permeability. The permeability of a rock is its ability to transmit water under a hydraulic gradient and is measured by the rate at which it will transmit water through a unit cross section under a unit loss of head per unit of distance. Beds of clay or shale may have a high porosity, but because the interstices are very small, may transmit little or no water and may be regarded as impervious. Rocks differ greatly in their, permeability, according to the number and size of their interstices and the degree to which the interstices are interconnected.
Source
In Cloud County ground water is derived from precipitation in the form of rain or snow that falls on the county or on nearby areas. Part of the precipitation becomes surface runoff to streams; a large part of the precipitation is absorbed by the soil, from which much of it evaporates directly or is absorbed by vegetation and later evaporated into the atmosphere. The rest percolates slowly downward through the soil and underlying strata until it reaches the water table, where it joins the body of ground water in what is known as the zone of saturation. This is the zone saturated with water under hydrostatic pressure.
The ground water percolates slowly through the rocks in directions determined by the geology, topography, and geologic structure until it is discharged eventually through wells and springs or by evaporation and transpiration in areas where the water table is shallow.
Artesian Conditions
Artesian conditions may exist where a water-bearing bed is overlain by an impermeable or nearly impermeable bed that dips from its outcrop toward the discharge area. At the outcrop of the water-bearing bed, water percolates downward to the water table and then moves downdip beneath the impermeable bed ("confining bed"). The hydrostatic pressure of the ground water is due to the weight of the water at higher levels in the aquifer. The pressure head of water at a given point in an aquifer is its hydrostatic pressure expressed as the height of a column of water that can be supported by the pressure. The pressure head is the height that a column of water will rise in a tightly eased well that has no discharge. If the pressure in the aquifer is sufficient to lift the column of water above the top of the aquifer, artesian conditions are said to exist. A well will not flow at the surface unless the difference in height of the aquifer between the outcrop and the point of discharge is sufficient to develop a pressure equal to the weight of the column of water in the well plus the head loss caused by friction within the aquifer. To put it in another way, the head must be sufficient to raise the water above the land surface at the well.
One flowing artesian well was found in Cloud County. This well (8-1-13ad) is in a valley and flows a small quantity of water of very good quality from the Dakota Formation; the recharge area is probably the nearby upland. An oil test well drilled many years ago in the valley of Solomon River about 1 mile south of Glasco reported a strong artesian flow. No record of the head of the artesian flow or of the quality of water from this well was made. Logan (1897, p. 213) reported an artesian well having a head of 12 feet in the salt marsh near Wayne and Talmo in Republic County. Although only one flowing artesian well was found in Cloud County, probably most of the deep aquifers in the Dakota Formation are under artesian pressure, but the water does not flow at the surface because the artesian head is insufficient to raise the column of water in a well above the land surface.
The Water Table
The water table is defined as the upper surface of the zone of saturation in a porous rock (Meinzer, 1923). Where the upper surface is intersected by an impermeable rock, the water table is interrupted and artesian conditions exist. If an aquifer lies above an impermeable bed, the water contained in the aquifer may be perched and the surface of this water may be a perched water table.
The water table is not a plane surface, but is generally a sloping surface, which has irregularities caused by differences in permeability of water-bearing materials, by unequal additions to or withdrawals from the aquifer, and by topographic features. The water table is not stationary, but fluctuates in, response to additions of water to or withdrawals of water from storage. Plate 2 shows the location of wells and test holes in Cloud County in which the depth to water was measured, the altitude of the water surface with respect to sea level, and contours on the water table. The water table is shown in the valley and in the upland. In the upland only those wells that were drilled into the deeper part of the Dakota Formation were used in drawing the water-table contours, inasmuch as water in the Greenhorn Limestone and very shallow water in the Dakota Formation seem to be perched or semiperched.
The shape and slope of the water table in Cloud County are shown on Plate 2 by means of contours. Each point on the water table on a given contour is at the same altitude, and the water-table contours show the configuration of the water surface just as contours on a topographic map show the configuration of the land surface. The ground water moves downslope in a direction at right angles to the contours.
In the major valleys in Cloud County the water-table contours are relatively widely spaced, indicating a downstream slope of the water table of about 5 feet per mile. Along the edges of the valleys the contours, as they enter the valley from the upland, curve sharply upstream. This indicates that water is entering the valley from the upland.
In the upland the contours are more closely spaced, indicating a steeper slope on the surface of the ground-water body. The steepest slopes lie just east and south of the outcrop of the Greenhorn Limestone and where the Dakota Formation is composed principally of sandstones on the outcrop. The steeper slopes are probably due in part to recharge in these areas. A west-northwest-trending ground-water divide crosses the county from a point near the northwest corner of T. 6 S., R. 5 W., to the northeast corner of T. 8 S., R. 1 W. Ground water from storage moving north from this divide is discharged into the drainage system of Republican River, and ground water moving south from this divide is discharged into the drainage system of Solomon and Smoky Hill Rivers. The highest point on the water table is near the northwest comer of T. 8 S., R. 2 W. This point lies on the ground-water divide, and water moves east and west as well as north and south from this point. Recharge conditions at this point are ideal and probably account at least in part for the high water table. A southwest-trending trough or saddle extends from the northeast corner of T. 6 S., R. 4 W., to a point near the southwest comer of T. 7 S., R. 5 W. Water moves toward this trough from the southeast and the northwest. This trough seems to have an important bearing on the quality of water in the area, as the water west of this trough is of poor quality whereas water nearly everywhere to the east is of good quality. Water of good quality probably moves generally westward into the trough, whereas water of poor quality moves southeastward toward the trough through the deeply buried Dakota Formation from the northwest. Waters moving into the trough mix and move down the plunge of the trough to discharge into the Solomon River valley.
The rate and direction of ground-water movement are controlled by the geology. The Dakota Formation is composed of much finer-grained materials than the alluvium and terrace deposits in the valleys, and the water-table contours shown on Plate 2 are more closely spaced in the upland than in the valleys. Movement of water through the fine material is slower than in coarse material, as it takes steeper slopes to move a given quantity of water through the fine deposits.
The water table generally reflects the surface topography. The slope of the water table in a valley is approximately equal to the slope of the land surface. Mere the valley grades into the upland, the slope of the water table is steeper under the valley walls than it is in the center of the valley. This is apparent in Cloud County, as along Republican River east of Concordia (Pl. 2). Topographic slope is the chief cause of slope of the water table in the upland in Cloud County, but differences in permeability and recharge also are effective.
The water table does not remain stationary, but fluctuates vertically, as does the water level of a surface reservoir. The amount of rise and decline of the water table depends upon the amount of recharge to the ground-water body and the amount of discharge from it. When the amount of recharge exceeds the amount of discharge in the ground-water reservoir the water table rises, and when discharge exceeds recharge it declines.
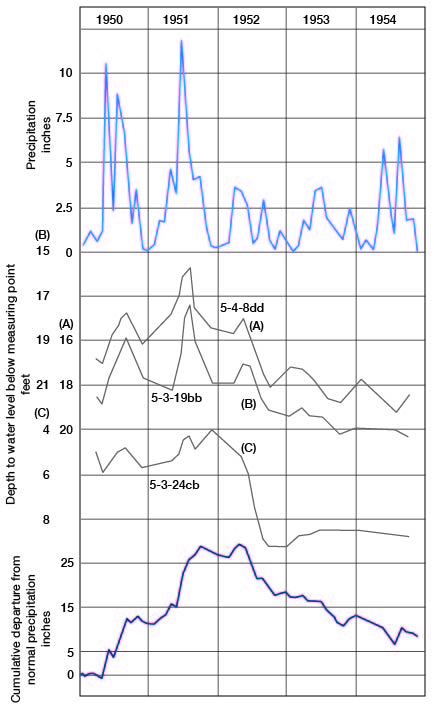
Factors that tend to raise the water level are precipitation t-hat percolates downward to the ground-water reservoir, the water that moves into the ground-water body from streams, and water entering the county by subsurface movement. Principal factors tending to cause decline of the water table are the loss of water to streams through seepage, discharge through evaporation and transpiration, discharge through pumping wells, and subsurface movement out of the county. The rise or decline of the water table over any area usually is not uniform but varies locally, owing to variation in the factors causing rise or decline. Figure 5 is a hydrograph of three wells in the Republican River valley showing rise and decline in the water table and the relation of this rise and decline to the cumulative departure from normal precipitation in the same general area. The general trend of the hydrographs is similar to the graph of the cumulative departure from normal precipitation; minor differences are caused by factors other than precipitation, local difference in permeability probably being the principal factor.
Figure 5--Hydrographs of three wells in Republican River valley, and graphs of precipitation and cumulative departure from normal precipitation at Concordia.
Ground-water Recharge
The addition of water to the zone of saturation is known as ground-water recharge. Ground-water recharge in Cloud County is derived from precipitation within the county, from influent streams, and from subsurface movement from adjacent areas.
Recharge from Precipitation
Most ground-water recharge in Cloud County is derived from precipitation, which averages about 25 inches annually in the county. When the amount of precipitation absorbed by the soil is greater than the amount that can be retained there by capillary forces, the excess moves down to the zone of saturation. Usually the soil is nearly depleted of moisture by the end of the growing season, owing to evaporation and transpiration, and soil moisture must be replaced before water can move down to the zone of saturation. The amount of water that becomes recharge depends upon the soil type and the underlying material through which the water must pass to reach the zone of saturation. Thus, the sandy soils of the alluvial deposits and the sandstones of part of the Dakota Formation absorb and transmit more water than the clay soils of parts of the the Dakota Formation and loess-covered areas of the upland.
The hydrographs of the three wells and the graphs of monthly precipitation and cumulative departure from normal (Fig. 5) indicate that precipitation and fluctuations of the water table correlate closely. These wells are in the alluvial and terrace deposits of the Republican River valley. In the uplands of the county the slopes on the water table (Pl. 2) are steepest where the thick sandstone deposits of the Dakota Formation crop out. As the water table tends to be most uniform and flat where permeability of the materials is greatest, the steep slopes on the water table where the Dakota Formation crops out can be accounted for by recharge.
Seepage from Streams and Ponds
Two factors determine whether a stream will recharge the groundwater reservoir; first, the water surface in the stream must be above the water table, and second, the material between the stream channel and the ground-water reservoir must be sufficiently permeable to permit movement of water from the stream into the reservoir. The perennial streams in Cloud County probably contribute a considerable quantity of water to the ground-water reservoir in the valleys when the stage of the stream is above the water table. The valley deposits are relatively permeable, as indicated by the cross sections in Plate 3, and admit water freely. The normal gradient of the water table in the valleys is toward the streams, but this gradient is relatively small, and only a slight rise in the streams causes a considerable amount of water to enter the ground-water reservoir in the valleys. Much of this water returns to the streams, however, when their stage falls.
Recharge by Subsurface Movement
Although the principal sources of recharge in Cloud County are local precipitation and seepage from streams, considerable quantities of water are contributed to the ground-water reservoir by subsurface percolation into the county. The water-table contour map (Pl. 2) indicates that water moves into the county from the north and from the west. The quality of a part of the water moving into the county from the north is relatively good, but the quality of the water that moves into the county from the west and northwest is poor. Water that moves into the county from the north is discharged into the Republican River valley; the water that moves into the county from the west is discharged into Solomon River and Buffalo Creek.
Ground-water Discharge
Ground water is discharged in Cloud County by transpiration and evaporation, by seepage into streams, by subsurface movement from the county, and by springs and wells. The rate of natural discharge depends greatly on the stage of the water table and the season of the year. Local differences of geology and topography cause more ground water to be discharged in some parts of the county than in others. More water is discharged from the ground-water reservoir by evaporation and transpiration adjacent to Republican and Solomon Rivers and other perennial streams than is discharged where the water table lies at greater depth. Before water was discharged by many wells in Cloud County, the quantity of perennial recharge to the ground-water reservoir and the quantity of perennial discharge were in a state of approximate equilibrium.
Discharge by Evaporation and Transpiration
Plants may draw water directly from the zone of saturation and discharge the water into the atmosphere by the process of transpiration. The rate at which water is withdrawn from the zone of saturation depends upon the type of plant, the depth of the water table, the climate, the season of the year, and the character of the soil.
Generally, the water table fluctuates in response to plant transpiration where the water table is near the land surface. The roots of some types of vegetation, especially alfalfa and some trees, are known to penetrate to great depths. In Cloud County the greatest amount of transpiration takes place in the valleys, where the water table is near the surface and where the soil is fertile and supports a vigorous vegetal growth. In the upland underlain by the Greenhorn Limestone and the Graneros Shale, most of the water that is transpired is soil moisture from the zone of aeration and little if any water is transpired from the zone of saturation. Farther east in the upland underlain by the Dakota Formation, some water probably is transpired from the zone of saturation where the water table is shallow.
Where the water table is extremely shallow, much water is evaporated from the zone of saturation after being drawn up into the zone of aeration by capillary forces. This type of discharge, like transpiration, takes place principally in the valleys.
Discharge by Seeps and Springs
A considerable quantity of water is discharged from the zone of saturation from seeps and springs, chiefly from the Dakota Formation, in the upland. A part of the water discharged by the seeps and springs is evaporated and a part runs off at the surface. Streams that are lower than the water table in surrounding deposits can contribute no water to the ground-water reservoir; instead, water is discharged into the streams from the ground-water reservoir. The water-table contours (Pl. 2) indicate that ground water moves toward the perennial streams and is discharging into them as effluent seepage. The water-table contours are based on measurements taken during the growing season. In the late fall after the first killing frost, when discharge by transpiration is at a minimum, considerably more water is available for discharge by seepage and springs, and probably the water table in the valleys rises slightly.
Discharge by Subsurface Movement
The water-table contours (Pl. 2) indicate that the water table slopes in general from west to east except along the edges of the principal valleys, where the direction of movement is toward the streams. Some water is discharged by subsurface movement into areas adjacent to the county, but much more water flows into the streams and leaves the county on the surface.
Discharge by Wells
The preceding discussion treats the natural discharge of ground water, which accounts for the greater part of ground-water discharge in Cloud County. The rest of the water is discharged by wells and is discussed under recovery of ground water. All the well water, of course, ultimately leaves the county by evapotranspiration or liquid outflow, adding to the quantities naturally discharged in those ways.
Recovery of Ground Water
Principles of Recovery
When water is standing in a well, static equilibrium exists between its head and the head of water in the aquifer outside the well. When water is withdrawn from the well, a difference in head is created between water inside the well and water outside the well. The water table in the vicinity of the well develops a cone of depression (Fig. 6), which is deepest at the wall of the well and extends some distance from the well. The greater the pumping rate in a well, the greater the drawdown. The specific capacity of a well is the rate of yield per unit of drawdown and is generally stated in gallons a minute per foot of drawdown.
Figure 6--Diagrammatic section of a well that is being pumped, showing its drawdown, cone of depression, and radius of influence.
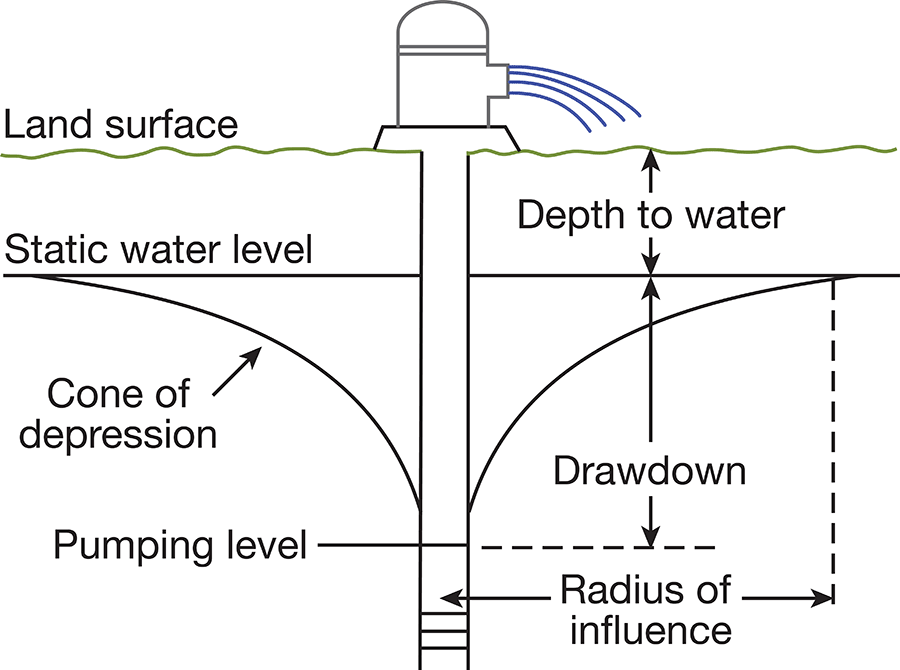
The character of the water-bearing material controls the yield, drawdown, and specific capacity of a well. If the water-bearing material is coarse and well sorted, it will readily yield large quantities of water at a minimum drawdown. If the material is fine or poorly sorted, it will offer much resistance to the flow of water and decrease the yield and increase the drawdown. All other things being equal, the drawdown of a well varies inversely with the permeability of the water-bearing material.
Types of Wells
Several different types of wells are used for water supplies. The types of wells are generally differentiated by the method of construction. Selection of the type of well to be constructed generally depends on the use for which the well is constructed, the geologic materials to be penetrated by the well, the depth to water, and the depth to which the well is to be dug or drilled.
Dug wells--Dug wells are wells that have been excavated by band, generally by use of pick and shovel. They are walled with stone, brick, wood, or concrete. Most dug wells are shallow. When Cloud County was being settled many wells were dug, because no specialized equipment was needed to construct a dug well. In the upland, where only small yields can be expected from wells, dug wells are preferred because a large-diameter well acts as a storage reservoir to collect water for intermittent pumping. This advantage of a large-diameter well may be offset by the disadvantage that sealing such a well from surficial contamination is difficult.
Driven wells--Most driven wells are 1 1/4 to 2 1/2 inches in diameter and are constructed by driving a pipe having a well point or screen on the end until the point is below the water table. Water is recovered by a simple lift pump. Wells are driven only in areas of unconsolidated deposits in which the depth to water is less than about 25 feet. In Cloud County such areas are found only in the valleys.
Drilled wells--At the present time most wells being constructed in Cloud County are drilled. Drilled wells are constructed with either a percussion or a rotary drilling machine. Nearly all are 4 1/2 inches or more in diameter and some are more than 40 inches in diameter. The use for which the well is drilled generally determines the diameter. Most domestic and stock wells are small, 4 1/2 to 8 inches, whereas municipal and irrigation wells are larger. The depth of drilled wells in Cloud County ranges from only a few feet to nearly 300 feet. Most wells in the upland obtain water from the Dakota Formation. In some wells the water in the upper part of the hole is cased off and only the lower part of the hole is left open to admit water. In others only the uppermost part of the hole is cased, the greater part of the hole being left uncased.
Many wells in the unconsolidated deposits in the valleys are drilled. These wells are drilled into the unconsolidated deposits, and a casing having a screen on the end is installed to prevent the sand and gravel from entering the well. In wells from which only small yields are expected, the length and type of screen are of minor importance, except that the screen openings should be of the correct size to keep out sand. In large-capacity wells, however, the size and length of screen are important. A municipal well or an irrigation well should be constructed with the maximum obtainable efficiency. It should be constructed and screened so that it will not admit sand after being developed properly. The maximum amount of water available from a well is determined by the materials in which it is constructed, and it is the problem of the driller to construct the well so that the maximum amount of water can be pumped with the least drawdown.
Utilization of Water
In Cloud County ground water is used chiefly for domestic and stock supplies and public supplies, although since 1953 considerable interest has been shown in the use of ground water for irrigation. A small amount of water is used for industrial purposes.
Domestic and Stock Supplies
Nearly all domestic and stock water supplies in rural areas and domestic supplies in towns having no public supply are obtained from wells. In the valleys these water supplies are obtained principally from driven and drilled wells; in the upland, from dug and drilled wells. In recent years much stock water has been obtained from ponds, to save the well water for domestic and auxiliary stock supplies.
Public Supplies
Aurora--The Aurora water supply is obtained from two wells (7-2-15ba1 and 7-2-15ba2) in the southeastern part of the city. These wells were drilled in 1928 and are about 200 feet deep. They are 6 inches in diameter and are equipped with small rotary pumps. Water is obtained from the Dakota Formation. The water is pumped from the wells to an elevated steel tank having a capacity of 55,000 gallons. The maximum yield of the two wells is about 120,000 gallons per day, and the average daily use is about 10,000 gallons. The water, which is chlorinated at the wells, is metered to the customers. The chemical quality of the water from the Aurora wells is shown by an analysis in Table 3.
Concordia--The Concordia water supply is obtained from 14 wells, 10 in the alluvium and terrace deposits of the Republican River valley at the northwest edge of the city and 4 within the city that obtain water from the Dakota Formation. Eight of the wells in the alluvium and terrace deposits are pumped by air lift and were drilled by the Air Made Well Co. in 1925-26. The depths of these wells range from 118 to 123 feet, although the wells penetrate only about 60 to 80 feet of alluvial material. They were drilled to a greater depth to obtain enough submergence so that the wells could be pumped by air. The other wells are equipped with turbine pumps. The wells in the valley are pumped at a rate of about 250 gpm each and those in the upland, about 60 gpm each. The city has two elevated steel tanks for storage, one having a capacity of 30,000 gallons and the other a capacity of 300,000 gallons. The maximum rated capacity of the water system is 3 million gallons per day and the average daily use is 1 million gallons. The water is chlorinated but receives no other treatment.
Clyde--The Clyde water supply is obtained from two drilled wells (5-1-26ad1 and 5-1-26ad2) at the east edge of the city. These wells produce water from the Dakota Formation and are 158 feet deep. The wells are equipped with turbine pumps and each yields about 300 gpm. The water is pumped to a treatment plant, where it is softened by the lime-soda process and then chlorinated. A steel standpipe provides storage capacity of 380,000 gallons; average daily use is about 150,000 gallons. The analysis of raw water from one well (5-1-26ad2) is given in Table 3.
Glasco--The Glasco water supply is obtained from two wells at the west edge of the town, which penetrate terrace deposits along Solomon River. Well 8-5-14bad1, 51 feet deep and 16 inches in diameter, gravel packed, was drilled by the Layne-Western Co. in 1931. The yield of this well is about 250 gpm. Well 8-5-14bad2 was dug in 1938 by W. P. A. labor and is 47 feet deep, 9 feet in diameter, and cased with concrete casing. It yields about 150 gpm. Both wells are equipped with turbine pumps. Water is chlorinated at the wells and delivered from a 50,000-gallon elevated steel tank to customers through meters. The maximum rated capacity of the wells is about 580,000 gallons per day and the average daily use is about 65,000 gallons.
Miltonvale--The Miltonvale water supply is obtained from two wells within the city limits. These wells yield water from the Dakota Formation at a depth of 100 feet. Well 8-1-17dc1 yields about 250 gpm and well 8-1-17dc2 yields about 200 gpm. The maximum capacity of the wells is about 650,000 gallons per day, and the average daily use is about 60,000 gallons. The water is chlorinated and is pumped to a 50,000-gallon elevated steel tank. Analyses of the water from the Miltonvale wells are given in Table 3.
Jamestown--The Jamestown water supply is obtained from three wells (5-5-22da) at the east edge of the city. The wells are drilled in terrace deposits along Buffalo Creek and are 140 feet deep. Two of the wells are equipped with cylinder pumps and the third with a turbine pump. The turbine-equipped well yields about 35 gpm. The water is chlorinated at the wells and pumped to an elevated steel tank of 50,000-gallon capacity. Maximum daily capacity of the supply is 110,000 gallons, and the average daily use is about 60,000 gallons.
Industrial Supplies
The quantity of water used for industrial supplies in Cloud County is comparatively small. Only four industrial wells were inventoried during the course of the investigation. These wells are used for cooling by the Natural Gas Pipeline Co. of America and are in the SE sec. 7, T. 8 S., R. 4 W. The wells range in depth from 135 to 150 feet; they yield water from the Dakota Formation at rates ranging from 30 to 135 gpm per well.
Irrigation Supplies
Considerable interest in irrigation was shown in Cloud County in the period 1940-42, after the preceding years of severe drought. Several irrigation wells were drilled at that time, but during the next several years of adequate rainfall some of these wells were used only intermittently if at all. Since the dry years of 1952-55, interest in irrigation has revived. A few operators use water from streams for irrigation. W. A. Davidson pumps water from Solomon River in sec. 8, T. 8 S., R. 5 W., to irrigate chiefly corn and alfalfa. The amount pumped in 1953 was about 40 acre-feet. Elmo St. Pierre pumps water from Republican River in sec. 19, T. 5 S., R. 2 W., to irrigate corn and alfalfa also. C. H. Blosser pumps water from an old sand pit in sec 28, T. 5 S., R. 3 W., to irrigate alfalfa. Dan Mahon pumps from Republican River in sec. 29, T. 5 S., R. 2 W., to irrigate corn and alfalfa.
Eleven wells were in operation in the valleys of Republican and Solomon Rivers in 1954. These wells bad an aggregate pumping capacity of about 9,000 gpm, or about 40 acre-feet per day, but were not pumped at full capacity.
The continued drought in 1955 intensified the interest in well irrigation in the county, and additional wells were drilled. By the end of October 1955, 37 wells were in operation or ready to operate. Their combined capacity was about 35,000 gpm, or 155 acre-feet per day. In the 1-year period the number of wells increased by 26 and the total capacity by about 26,000 gpm. The pumpage of water for irrigation in 1955 was probably about 3,500 acre-feet.
A map (Fig. 7) of the valleys of Republican River and Buffalo Creek was drawn to show the configuration of the pre-Pleistocene surface. A saturated-thickness map (Fig. 8) was then prepared by superimposing the water-table contour map (Pl. 2) over the bedrock map and connecting points of equal saturation. From this map the total volume of saturated material in the valleys was calculated for each township. By applying an estimated figure of 20 percent for specific yield, the volume of water in storage was calculated. The volume of water in storage in each township in the valleys is given in Table 2.
Figure 7--Map showing configuration of pre-Pleistocene surface in Republican River and Buffalo Creek valleys in Cloud County. A larger version of this figure is available.
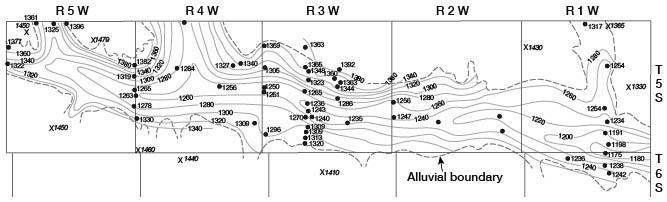
Figure 8--Map showing saturated thickness of Pleistocene deposits in Republican River and Buffalo Creek valleys in Cloud County. A larger version of this figure is available.
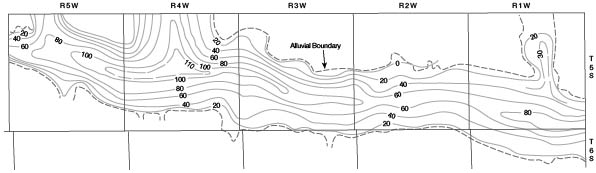
Table 2--Volume of saturated material in Republican River and Buffalo Creek valleys in Cloud County, and total volume of water in storage theoretically available for pumping, based on a specific yield of 20 percent.
| Township | Volume of water-bearing materials, acre-feet |
Volume of water, acre-feet (rounded) |
|---|---|---|
| T. 5 S., R. 1 W. | 640,000 | 130,000 |
| T. 5 S., R. 2 W. | 520,000 | 100,000 |
| T. 5 S., R. 3 W. | 760,000 | 150,000 |
| T. 5 S., R. 4 W. | 1,200,000 | 240,000 |
| T. 5 S., R. 5 W. | 760,000 | 150,000 |
| T. 6 S., R. 1 W. | 200,000 | 40,000 |
| Total | 4,100,000 | 820,000 |
The volume of water in storage (Table 2) is equal to the volume of water that would be pumped in about 200 years at the 1955 rate of pumping from the valleys for irrigation and municipal supplies, considering no recharge to the valleys. The water-table contour map (Pl. 2) indicates that water moves into the valleys from the upland bordering the valleys, and although no estimate of the quantity thus contributed is made, it is considerable. Water also moves into the county in Republican River. Streamflow records at Concordia dating from 1946 indicate that the minimum flow in that period was 40 cubic feet per second in September 1952. This quantity of water is equal to about 80 acre-feet per day, or about half the quantity that could be pumped in one day from the 1955 installations. Recent completion of reservoirs on Republican River in Nebraska and Colorado has made it possible to maintain a flow in the river of at least 50 second-feet.
Chemical Character of Water
The general chemical character of ground water in Cloud County is indicated by the analyses of 62 samples of water from wells and test holes distributed as uniformly as practicable within the area and among the principal water-bearing formations (Fig. 9, 10; Table 3).
In several test holes, samples of water were taken at different depths within the same hole in order to determine the relation between depth and quality of water. The numbers of these wells are repeated in Table 3 and the depth given is the depth at which the sample was taken. For all other wells the depth given is the depth of the well. Table 3 includes the analyses of 42 samples of water from the Dakota Formation, 15 samples of water from terrace deposits, and 5 samples of water from alluvial deposits. Analyses of public water sup.plies in the county are on file in the office of the Division of Sanitation of the Kansas State Board of Health. The samples of water were analyzed by Howard A. Stoltenberg, chemist, in the Water and Sewage Laboratory of the Kansas State Board of Health.
Table 3--Analyses of water from typical wells and test holes in Cloud County. Analyzed by H. A. Stoltenberg. Dissolved constituents given in parts per milliona.
| Well no. |
Depth (feet) (b) |
Geologic source | Date of collection |
Temp. (°F) |
Dissolved solids |
Silica (SiO2) |
Iron (Fe) |
Calcium (Ca) |
Magnesium (Mg) |
Sodium and Potassium (Na+K) |
Bicarbonate (HCO3) |
Sulfate (SO4) |
Chloride (Cl) |
Fluoride (F) |
Nitrate (NO3) |
Hardness as CaCO3 | ||
|---|---|---|---|---|---|---|---|---|---|---|---|---|---|---|---|---|---|---|
| Total | Carbonate | Non- carbonate |
||||||||||||||||
| 5-1-26ad2 | 158 | Dakota Formation | 8-4-1954 | 56 | 342 | 23 | 0.42 | 73 | 11 | 37 | 300 | 31 | 19 | 0.3 | 0.4 | 227 | 227 | 0 |
| 5-2-30bcc | 38-40 | Alluvium | 6-12-1954 | 57 | 1,110 | 31 | 38 | 11 | 365 | 354 | 118 | 368 | .9 | .9 | 140 | 140 | 0 | |
| 5-2-30bcc | 76-78 | Alluvium | 6-12-1954 | 57 | 13,000 | 32 | 1.9 | 229 | 141 | 4,470 | 703 | 1,690 | 6,040 | .9 | 5.3 | 1,150 | 576 | 575 |
| 5-3-15ab | 340-341 | Dakota Formation | 10-18-1955 | 56 | 32,000 | 412 | 353 | 11,300 | 870 | 3,510 | 16,000 | 2,750 | 714 | 1,770 | ||||
| 5-3-18bbb | 95-100 | Terrace deposits | 6-10-1954 | 57 | 427 | 24 | 92 | 12 | 48 | 344 | 34 | 44 | .2 | 3.3 | 279 | 279 | 0 | |
| 5-3-19cb | 62-67 | Terrace deposits | 6-8-1954 | 58 | 294 | 22 | .86 | 47 | 12 | 38 | 200 | 57 | 17 | .6 | 1.1 | 166 | 164 | 2 |
| *5-3-22bc | 78 | Alluvium | 4-15-1943 | 4,590 | 107 | 59 | 1,650 | 415 | 468 | 2,150 | .4 | 16 | 510 | 340 | 170 | |||
| 5-3-31bb | 32-37 | Terrace deposits | 6-3-1954 | 56 | 659 | 35 | 107 | 21 | 104 | 459 | 82 | 80 | .4 | 3.5 | 354 | 354 | 0 | |
| *5-3-32aa1 | 122 | Terrace deposits | 1-2-1945 | 589 | 110 | 17 | 78 | 381 | 91 | 72 | .5 | 5.8 | 344 | 312 | 32 | |||
| 5-3-32aa2 | 122 | Terrace deposits | 728 | 8.6 | .16 | 118 | 23 | 112 | 520 | 83 | 80 | .4 | 5.3 | 389 | 389 | 0 | ||
| 5-3-32aa3 | 62 | Terrace deposits | 8-4-1954 | 596 | 31 | .22 | 81 | 14 | 116 | 346 | 69 | 110 | .4 | 1.1 | 260 | 260 | 0 | |
| 5-5-4aab | 78-80 | Dakota Formation | 11-5-1953 | 708 | 12 | 72 | 8.0 | 191 | 361 | 35 | 205 | .4 | 7.1 | 212 | 212 | 0 | ||
| 5-5-4aab | 158-160 | Dakota Formation | 11-17-1953 | 33,200 | 20 | 206 | 392 | 11,900 | 1,210 | 3,660 | 16,400 | 1.6 | 19 | 2,120 | 994 | 1,130 | ||
| 5-5-4aab | 400-402 | Dakota Formation | 11-17-1953 | 36,000 | 19 | 210 | 431 | 12,900 | 1,280 | 3,960 | 17,800 | 1.6 | 17 | 2,300 | 1,050 | 1,250 | ||
| 5-5-4bb | 49-53 | Terrace deposits | 10-30-1953 | 19,200 | 28 | 285 | 242 | 6,670 | 858 | 2,250 | 9,310 | 1.5 | 28 | 1,710 | 704 | 1,000 | ||
| 5-5-7cc | 53-55 | Terrace deposits | 5-18-1954 | 57 | 2,940 | 23 | 107 | 40 | 944 | 508 | 416 | 1,150 | .6 | 6.6 | 432 | 416 | 16 | |
| 5-5-22da | 140 | Terrace deposits | 7-7-1953 | 486 | 6.0 | .06 | 116 | 11 | 49 | 364 | 72 | 43 | .3 | 7.1 | 334 | 298 | 36 | |
| 5-5-24dd | 55-57 | Terrace deposits | 5-2-1954 | 57 | 411 | 14 | 74 | 10 | 68 | 353 | 41 | 28 | .4 | 1.3 | 226 | 226 | 0 | |
| 6-1-3aa | 36-41 | Alluvium | 6-15-1954 | 57 | 392 | 25 | .93 | 85 | 11 | 43 | 344 | 37 | 21 | .3 | .9 | 257 | 257 | 0 |
| 6-1-3aa | 72-77 | Alluvium | 6-15-1954 | 57 | 424 | 14 | 2.0 | 93 | 11 | 49 | 351 | 64 | 19 | .3 | .4 | 277 | 277 | 0 |
| 6-1-10cc | 87 | Dakota Formation | 3-4-1954 | 54 | 293 | 11 | .94 | 66 | 9.6 | 29 | 251 | 39 | 13 | .2 | 1.7 | 204 | 204 | 0 |
| 6-1-24aa1 | 75 | Dakota Formation | 3-4-1954 | 54 | 1,190 | 11 | 2.3 | 221 | 48 | 53 | 105 | 17 | 203 | .1 | 589 | 749 | 86 | 663 |
| 6-1-24aa1 | 75 | Dakota Formation | 6-9-1954 | 55 | 1,190 | 14 | 3.5 | 224 | 48 | 50 | 100 | 19 | 212 | .1 | 571 | 752 | 82 | 670 |
| 6-1-24aa2 | 62 | Dakota Formation | 10-22-1954 | 55 | 6.2 | |||||||||||||
| 6-2-9dad | 80 | Dakota Formation | 3-4-1954 | 55 | 413 | 14 | 4.3 | 82 | 13 | 53 | 283 | 45 | 64 | .3 | 2.9 | 258 | 232 | 26 |
| 6-2-24cc | Dakota Formation | 6-9-1954 | 56 | 304 | 12 | 29 | 7.2 | 73 | 156 | 41 | 62 | .4 | 2.5 | 102 | 102 | 0 | ||
| 6-2-33dc | 68-70 | Dakota Formation | 10-6-1954 | 58 | 286 | 15 | 48 | 13 | 39 | 210 | 25 | 40 | 1.1 | 1.5 | 174 | 172 | 2 | |
| 6-2-33dc | 138-140 | Dakota Formation | 10-6-1954 | 57 | 486 | 11 | 47 | 11 | 124 | 307 | 54 | 85 | .6 | 2.3 | 162 | 162 | 0 | |
| 6-2-33dc | 233-235 | Dakota Formation | 10-6-1954 | 57 | 465 | 14 | .69 | 53 | 13 | 105 | 305 | 52 | 75 | .6 | 2.2 | 186 | 186 | 0 |
| *6-3-4dc | Dakota Formation | 3-3-1947 | 506 | 24 | 1.2 | 13.7 | 9.6 | 23 | 378 | 74 | 7.5 | .2 | 42 | 382 | 310 | 72 | ||
| *6-3-6dc | 305 | Dakota Formation | 11-3-1942 | 58 | 938 | 5.7 | 7.8 | 2.8 | 371 | 677 | 93 | 70 | 9 | 4.1 | 31 | 31 | 0 | |
| 6-4-5da | 58 | Dakota Formation | 3-3-1954 | 54 | 703 | 22 | .56 | 176 | 13 | 48 | 398 | 48 | 98 | .1 | 102 | 492 | 326 | 166 |
| 6-4-12cd | 90 | Dakota Formation | 3-3-1954 | 302 | 7.4 | 27 | 70 | 9.2 | 31 | 256 | 32 | 25 | .4 | .7 | 212 | 210 | 2 | |
| 6-4-34cc | 168-170 | Dakota Formation | 9-29-1954 | 59 | 362 | 24 | 96 | 8.9 | 23 | 337 | 31 | 12 | .3 | .4 | 276 | 276 | 0 | |
| 6-4-34cc | 378-380 | Dakota Formation | 9-28-1954 | 59 | 378 | 24 | 96 | 8.9 | 30 | 351 | 32 | 13 | .3 | .5 | 276 | 276 | 0 | |
| *6-4-36cb | 308 | Dakota Formation | 11-3-1942 | 56 | 1,750 | 7.6 | 7.6 | 5.0 | 681 | 733 | 151 | 490 | 5.5 | 5.8 | 40 | 40 | 0 | |
| 6-5-6cb | 190 | Dakota Formation | 3-3-1954 | 54 | 953 | 7.4 | 3.1 | 20 | 13 | 341 | 501 | 74 | 247 | 2.6 | 1.1 | 104 | 104 | 0 |
| 6-5-26ab | Dakota Formation | 3-3-1954 | 52 | 2,130 | 12 | .80 | 171 | 42 | 529 | 661 | 565 | 370 | .9 | 120 | 599 | 542 | 57 | |
| 7-1-29aba | 67 | Dakota Formation | 3-4-1954 | 54 | 259 | 9.0 | .27 | 43 | 11 | 25 | 95 | 26 | 36 | .2 | 62 | 152 | 78 | 74 |
| c7-2-15ba1-2 | 200 | Dakota Formation | 7-2-1954 | 424 | 20 | 1.5 | 109 | 15 | 30 | 376 | 73 | 9.0 | .3 | 1.8 | 334 | 308 | 26 | |
| 7-2-18ab | Dakota Formation | 3-4-1954 | 54 | 474 | 2.0 | 2.7 | 104 | 24 | 41 | 405 | 86 | 17 | .4 | 1.1 | 358 | 332 | 26 | |
| 7-3-21ba | 342 | Dakota Formation | 3-4-1954 | 54 | 741 | 5.6 | 8.4 | 60 | 22 | 193 | 522 | 153 | 48 | 1.4 | 1.5 | 240 | 240 | 0 |
| 7-3-35cb | 75 | Dakota Formation | 3-3-1954 | 54 | 1,210 | 23 | 25 | 299 | 15 | 46 | 122 | 693 | 36 | .8 | 42 | 808 | 100 | 708 |
| 7-4-22bb | 183 | Dakota Formation | 3-3-1954 | 54 | 930 | 5.8 | 3.8 | 172 | 24 | 124 | 322 | 258 | 186 | .3 | 1.7 | 528 | 264 | 264 |
| 7-5-8cc | 148-150 | Dakota Formation | 9-17-1954 | 59 | 15,700 | 6.5 | 123 | 332 | 5,320 | 1,450 | 2,470 | 6,710 | 2.0 | 1.8 | 1,670 | 1,200 | 476 | |
| 7-5-8cc | 258-260 | Dakota Formation | 9-17-1954 | 59 | 19,800 | 7.0 | 180 | 438 | 6,650 | 1,590 | 3,210 | 8,560 | 1.6 | 1.8 | 2,250 | 1,300 | 945 | |
| 7-5-8cc | 378-380 | Dakota Formation | 9-16-1954 | 59 | 18,900 | 6.0 | 182 | 413 | 6,340 | 1,580 | 3,040 | 8,130 | 1,7 | 1.3 | 2,150 | 1,300 | 853 | |
| 7-5-13bad | 240 | Dakota Formation | 3-3-1954 | 51 | 684 | 7.8 | 4.9 | 3.8 | 263 | 554 | 112 | 17 | 1.0 | 1.9 | 28 | 28 | 0 | |
| 8-1-13ad | 200 | Dakota Formation | 3-5-1954 | 53 | 176 | 9.2 | 2.9 | 34 | 5.6 | 24 | 159 | 16 | 8.0 | .2 | 1.5 | 108 | 108 | 0 |
| 8-1-17dc1 | 100 | Dakota Formation | 6-11-1952 | 315 | 9.4 | .06 | 61 | 15 | 20 | 159 | 56 | 19 | .3 | 49 | 214 | 130 | 84 | |
| 8-1-17dc2 | 100 | Dakota Formation | 7-20-1953 | 415 | 11 | .18 | 76 | 18 | 34 | 170 | 54 | 49 | .3 | 88 | 264 | 139 | 125 | |
| 8-2-16dc | 181 | Dakota Formation | 3-4-1954 | 54 | 257 | 21 | .23 | 59 | 8.8 | 19 | 212 | 36 | 8.0 | .3 | 1.3 | 183 | 174 | 9 |
| 8-2-36aa | 69 | Dakota Formation | 3-4-1954 | 54 | 224 | 31 | .44 | 32 | 9.2 | 28 | 154 | 31 | 12 | .3 | 4.0 | 118 | 118 | 0 |
| 8-3-26cc | 31 | Dakota Formation | 3-3-1954 | 54 | 741 | 23 | 1.6 | 98 | 18 | 99 | 212 | 54 | 40 | .3 | 305 | 318 | 174 | 144 |
| 8-4-8ddc1 | 70 | Dakota Formation | 3-3-1954 | 54 | 383 | 21 | .07 | 85 | 13 | 36 | 318 | 45 | 24 | .2 | 1,7 | 266 | 261 | 5 |
| 8-4-8ddc2 | 50 | Dakota Formation | 3-3-1954 | 54 | 426 | 23 | .08 | 2.4 | 1.6 | 163 | 373 | 28 | 19 | .5 | 4.4 | 12 | 12 | 0 |
| 8-4-23cbd | 128 | Dakota Formation | 3-3-1954 | 55 | 394 | 16 | .68 | 88 | 12 | 42 | 353 | 44 | 16 | .4 | 1.3 | 269 | 269 | 0 |
| 8-5-7cb | 46-48 | Terrace deposits | 10-20-1953 | 550 | 28 | 1.4 | 103 | 16 | 79 | 464 | 55 | 39 | .1 | 2.1 | 323 | 323 | 0 | |
| 8-5-14bad1 | 51 | Terrace deposits | 9-29-1952 | 1,560 | 19 | .07 | 218 | 35 | 254 | 488 | 144 | 423 | .3 | 115 | 688 | 400 | 288 | |
| 8-5-14bad2 | 47 | Terrace deposits | 4-29-1954 | 1,190 | 24 | .3 | 146 | 23 | 260 | 451 | 120 | 359 | .3 | 27 | 458 | 370 | 88 | |
| S-5-17dca | 22 | Terrace deposits | 3-3-1954 | 54 | 828 | 18 | 1.1 | 217 | 19 | 43 | 516 | 184 | 40 | .2 | 53 | 620 | 423 | 197 |
| 8-5-25cc | 50 | Terrace deposits | 3-3-1954 | 54 | 574 | 22 | 6.9 | 75 | 18 | 119 | 440 | 38 | 83 | .4 | 1.5 | 261 | 261 | 0 |
| a. One part per million is equivalent to one pound of substance per million pounds of water, or 8.33 pounds per million gallons of water. b. Single figure denotes depth of well. Range of depth indicates depth from which sample was pumped. c. Composite sample from city main. * Taken from Kansas Geological Survey Bulletin 73 (Fishel, 1948). |
||||||||||||||||||
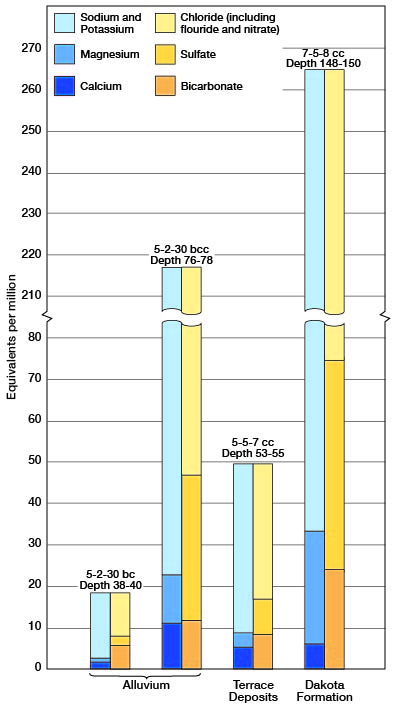
Figure 9--Graphic representation of analyses of water from principal water-bearing formations in Cloud County.

Figure 10--Grahbic representation of analyses of mineralized water from principal water-bearing formations in Cloud County.
Chemical Constituents in Relation to Use
The following discussion of the chemical constituents of ground water has been adapted from publications of the U. S. Geological Survey.
Dissolved solids--The residue left after a natural water has evaporated consists chiefly of rock materials but may include some organic material and some water of crystallization. Waters containing less than 500 parts per million of dissolved solids generally are satisfactory for domestic use, except for the difficulties resulting from their hardness and, in some areas, excessive iron content or corrosiveness. Waters having more than 1,000 ppm as a rule are not satisfactory, for they are likely to contain enough of certain constituents to produce a noticeable taste or to make the water unsuitable in some other respect.
The waters in 27 of the 62 wells sampled in Cloud County contained less than 500 ppm of dissolved solids and are generally satisfactory for ordinary purposes. The water from 16 of the wells sampled in Cloud County contained 500 to 1,000 ppm of dissolved solids, and 18 contained more than 1,000 ppm of dissolved solids. Some very strong concentrations of dissolved solids were measured in samples from deep test holes in the Dakota Formation.
Hardness--The hardness of water, which is the property that generally receives the most attention, is most commonly recognized by its effects when soap is used with water. Hard water is objectionable because it forms with soap a sticky insoluble curd difficult to remove from containers and fabrics, requires greater quantities of soap to produce lather, and forms scale in boilers and pipes, which reduces efficiency of heat transfer and may cause boiler failure. Calcium and magnesium cause virtually all the hardness of ordinary water. These constituents are also the active agents in the formation of the greater part of the scale in steam boilers and in other vessels in which water is heated or evaporated.
In addition to the total hardness the table of analyses shows the carbonate hardness and the noncarbonate hardness. The carbonate hardness is that due to the presence of calcium and magnesium bicarbonates. It is almost completely removed by boiling; this type of hardness is called temporary hardness. The noncarbonate hardness is due to the presence of sulfates or chlorides of calcium and magnesium; it cannot be removed by boiling and hence has sometimes been called permanent hardness. With reference to use with soap there is no difference between the carbonate. and noncarbonate hardness. In general the noncarbonate hardness forms harder scale in steam boilers.
Water having a hardness of less than 50 ppm is generally rated as soft, and under ordinary circumstances treatment to reduce hardness is not necessary. Hardness between 50 and 150 ppm does not interfere seriously with the use of water for most purposes, but it does increase somewhat the consumption of soap, and treatment by a softening process is profitable for laundries or other industries using large quantities of soap. Water in the upper part of this range of hardness will cause considerable scale in steam boilers. Hardness of more than 150 ppm can be noticed by anyone, and if the hardness is 200 or 300 ppm, it is common practice to soften water for household use or to install cisterns to collect soft rainwater. Where municipal water supplies are softened, hardness is generally reduced to about 80 ppm. The additional improvement from further softening of a public supply is not deemed worth the increase in cost.
Of the 61 samples of water from Cloud County that were analyzed for hardness, 9 had hardness of less than 150 ppm, 24 had hardness of 150 to 300 ppm, and 28 had hardness of 300 ppm or more.
Iron--If water contains much more than 0.3 ppm of iron, the excess may precipitate and settle as a reddish sediment when exposed to the air. Iron, which may be present in sufficient quantity to give a disagreeable taste or to stain cooking utensils, may be removed from most water by aeration and filtration, but some waters require additional treatment.
Water samples from most of the test holes in Cloud County were pumped by the air-lift method. The resulting aeration of the water during pumping resulted in removal of much of the iron, so samples pumped by the air-lift method were not analyzed for iron. Of 40 samples of water from Cloud County, 5 contained less than 0.1 ppm of iron, 15 contained 0.1 to 1.0 ppm, 10 contained 1.0 to 3.0 ppm, and 10 contained 3.0 ppm or more.
Fluoride--Although fluoride is usually present only in small quantities in ground water, the amount of fluoride present in water used by children should be known. Fluoride in water is associated with the dental defect known as mottled enamel, which may appear on the teeth of children who, during the formation of the permanent teeth, drink water containing too much fluoride. Dean (1936, p. 1,270) has described the effects of fluoride in drinking water on the teeth of children.
From the continuous use of water containing 1 part per million, it is probable that the very mildest forms of mottled enamel may develop in about 10 per cent of the group. In waters containing 1.7 or 1.8 parts per million, the incidence may be expected to rise 40 or 50 per cent, although the percentage distribution of severity would be largely of the "very mild" and "mild" types. At 2.5 parts per million an incidence of about 75 to 80 per cent might be expected, with possibly 20 to 25 per cent of all cases falling into the "Moderate" or severer type. A scattering few may show the "moderately severe" type.
At 4 parts per million the incidence is, in general, in the neighborhood of 90 per cent, and as a rule, 35 per cent or more of the children are classified as "moderate" or worse. In concentrations of 6 parts per million or higher an incidence of 100 per cent is not unusual.
Recent studies (Dean and others, 1941) have indicated that, whereas fluoride in amounts exceeding 1.5 ppm may be detrimental because of mottling of the teeth of children, fluoride in quantities less than 1.5 ppm is beneficial in helping to prevent tooth decay.
The fluoride content of most of the water samples from Cloud County was low. Of 60 samples analyzed for fluoride, 48 contained less than 1.0 ppm, 3 contained 1.0 to 1.5 ppm, and 9 contained more than 1.5 ppm.
Chloride--Chloride is widely distributed in nature; it is an abundant constituent of sea water and oil-field brines and is dissolved from most rock materials. Chloride has little effect on the suitability of water for ordinary use unless enough chloride salts are present to impart a salty taste or to cause the water to be corrosive. The removal of chloride from water is difficult and expensive.
Chloride salts in solution giving less than 250 ppm of chloride cannot be detected by taste, and waters of such purity are regarded as satisfactory for ordinary uses. Waters containing concentrations of chloride between 250 and 500 ppm may have a slight salty taste but can be used for drinking and household uses. Water having chloride concentrations between 500 and 750 ppm will have a disagreeable taste, but even such salty water may be consumed by human beings with no ill effects. Cattle have a fair tolerance for mineralized water. Although fresh water is preferable it is reported that cattle can drink water having a chloride content of 5,000 ppm.
Of the 61 samples of water that were analyzed for chloride, 46 contained less than 250 ppm, 5 contained 250 to 500 ppm, none of the samples contained 500 to 750 ppm, 2 samples contained 750 to 5,000 ppm, 4 contained 5,000 to 9,000 ppm, and 4 contained 9,000 ppm or more of chloride.
Nitrate--The use of water containing an excessive amount of nitrate in the preparation of a baby's formula can cause cyanosis ("blue baby'), or oxygen starvation. Some authorities advocate that water containing more than 45 ppm of nitrate should not be used in preparation of formulas for infant feeding (Metzler and Stoltenberg, 1950). Water containing 90 ppm of nitrate generally is regarded as dangerous to infants, and water containing 150 ppm may cause severe cyanosis. Cyanosis is not produced in adults and older children by these concentrations of nitrate in drinking water. Boiling of water that contains excessive nitrate does not render it safe for use by infants; therefore, only water that is known to be low in nitrate should be used for this purpose. Several cases of severe cyanosis have been reported from Cloud County in recent years.
The nitrate content of the water from some wells is somewhat seasonal, being highest in the winter and lowest in the summer (Metzler and Stoltenberg, 1950). The water in well 6-1-24aa1 contained 589 ppm of nitrate on March 4, 1954, and 571 ppm on June 9, 1954. Therefore in October 1954 well 6-1-24aa2 was drilled to replace well 6-1-24aa1. Well 6-1-24aa2 is located about 250 feet west of well 6-1-24aa1. On October 22, 1954, the water in the new well contained only 6.2 ppm of nitrate. In general, water from wells that are most susceptible to surface contamination is likely to contain excessive nitrate.
Of 61 water samples from Cloud County, 51 contained less than 45 ppm of nitrate, 4 contained 45 to 90 ppm, 3 contained 90 to 150 ppm, and 3 contained 150 ppm or more.
Sulfate--Sulfate in ground water is derived principally from the minerals gypsum or anhydrite (calcium sulfate) and from the oxidation of pyrite (iron disulfide). Magnesium sulfate (Epsom salts) and sodium sulfate (Glauber's salt), if present in sufficient quantity, will impart a bitter taste to the water, and the water may have laxative effect upon people who are not accustomed to drinking it.
Of 61 samples of water from Cloud County that were analyzed for sulfate, 23 contained less than 50 ppm, 25 contained 50 to 200 ppm, and 13 contained 200 ppm or more of sulfate.
Water for Irrigation
This discussion of the suitability of water for irrigation is adapted from Agriculture Handbook Number 60, U. S. Department of Agriculture (U. S. Salinity Laboratory Staff, 1954).
The development and maintenance of successful irrigation projects involve not only the supplying of irrigation water to the land but also the control of the salinity and alkalinity of the soil. The quality of irrigation water, irrigation practices, and drainage conditions are involved in salinity and alkali control. Soil that was originally nonsaline and nonalkali may become unproductive if excessive soluble salts or exchangeable sodium are allowed to accumulate because of improper irrigation and soil-management practices or inadequate drainage.
In areas of sufficient rainfall and ideal soil conditions the soluble salts originally present in the soil or added to the soil with water are carried downward by the water and ultimately reach the water table. This process of dissolving and transporting soluble salts by the downward movement of water through the soil is called leaching. If the amount of water applied to the soil does not exceed the amount needed by plants, water will not percolate down below the root zone, and mineral matter will accumulate in the root zone. Likewise, impermeable soil zones near the surface can retard the downward movement of water, resulting in waterlogging of the soil and deposition of salts. Unless drainage is adequate, attempts at leaching may not be successful, because leaching requires the free passage of water through and away from the root zone.
The characteristics of an irrigation water that seem to be most important in determining its quality are: (1) total concentration of soluble salts; (2) relative proportion of sodium to other cations (magnesium, calcium, and potassium); (3) concentration of boron or other elements that may be toxic; and (4) under some conditions, the bicarbonate concentration as related to the concentration of calcium plus magnesium.
For purposes of diagnosis and classification the total concentration of soluble salts in irrigation water can be adequately expressed in terms of electrical conductivity. Electrical conductivity is a measure of the ability of water having inorganic salts in solution to conduct an electrical current, and is usually expressed in terms of micromhos per centimeter. The electrical conductivity can be determined accurately in the laboratory, or an approximation of the electrical conductivity can be obtained by multiplying the total equivalents per million of anions by 100, or by dividing the total dissolved solids in parts per million by 0.64. Factors for converting parts per million to equivalents per million are given in Table 4. For example, to convert parts per million of calcium to equivalents per million, multiply the parts per million of calcium by 0.0499.
Table 4--Factors for converting parts per million of mineral constituents to equivalents per million.
| Mineral constituent |
Chemical symbol |
Factor |
|---|---|---|
| Calcium | Ca++ | 0.0499 |
| Magnesium | Mg++ | 0.0822 |
| Sodium | Na+ | 0.0435 |
| Potassium | K+ | 0.0256 |
| Carbonate | CO3-- | 0.0333 |
| Bicarbonate | HCO3- | 0.0164 |
| Sulfate | SO4-- | 0.0208 |
| Chloride | Cl- | 0.0282 |
| Fluoride | F- | 0.0526 |
| Nitrate | NO3- | 0.0161 |
In general, waters whose electrical conductivity does not exceed 750 micromhos per centimeter are satisfactory for irrigation insofar as salt content is concerned, although salt-sensitive crops such as strawberries, green beans, and red clover may be adversely affected by irrigation water having an electrical conductivity in the range of 250 to 750 micromhos per centimeter. Waters having an electrical conductivity in the range of 750 to 2,250 micromhos per centimeter are widely used, and satisfactory crop growth is obtained under good management and favorable drainage conditions, but saline conditions will develop if leaching and drainage are inadequate. Use of waters having a conductivity in excess of 2,250 micromhos per centimeter is the exception, and very few instances can be cited where such waters have been used successfully.
In the past the relative proportion of sodium to total principal cations in irrigation water (sodium, potassium, calcium, and magnesium) usually has been expressed simply as the "percent sodium". According to the U. S. Department of Agriculture, however, the sodium-adsorption ratio (SAR), used to express the relative activity of sodium ions in exchange reactions with soil, is a much better measure of the suitability of water for irrigation. The sodium-adsorption ratio may be determined by the formula
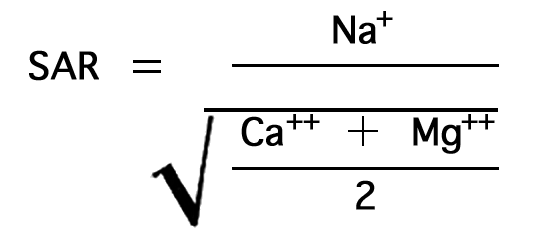
Figure 11--Nomogram for determining the sodium-adsorption ratio of a water.
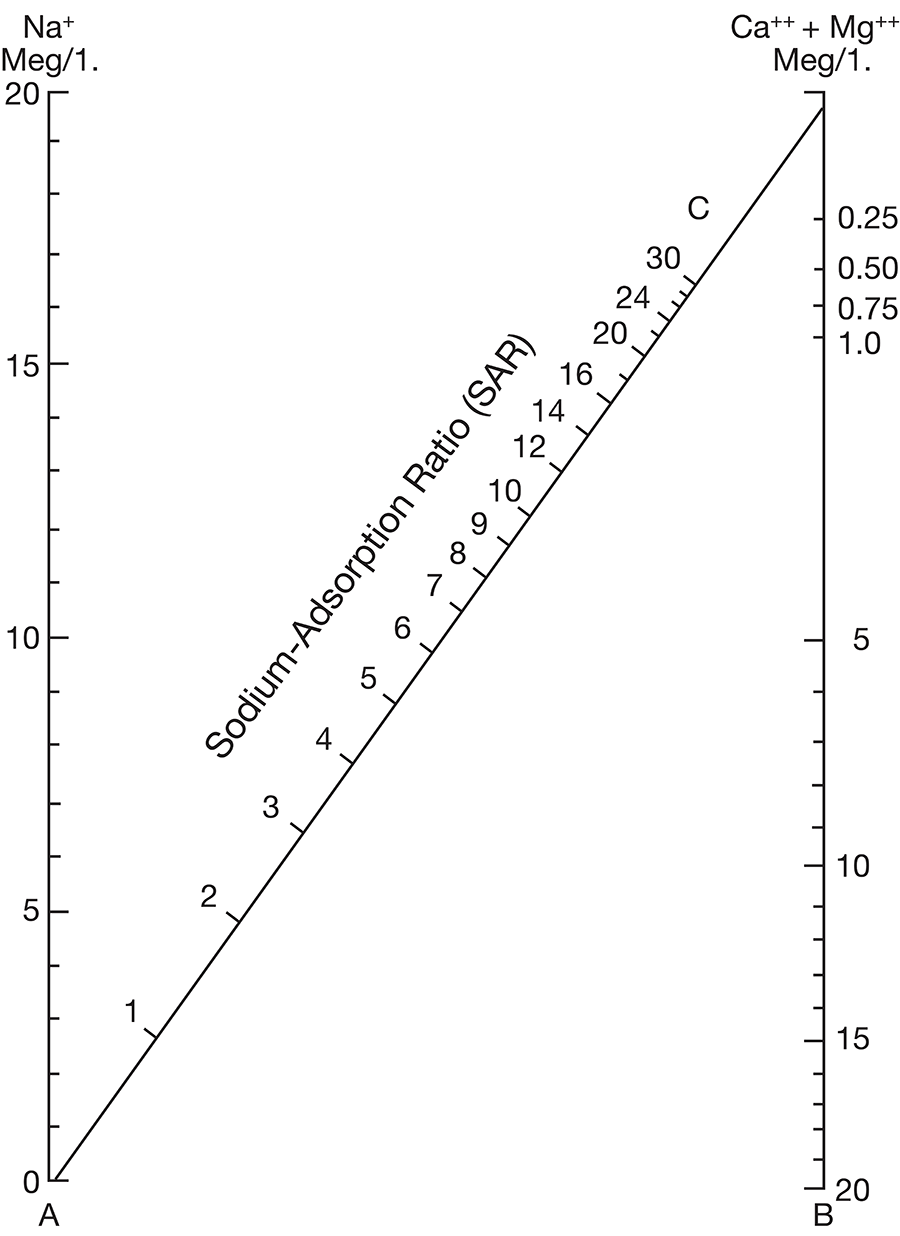
Figure 12--Diagram showing suitability of waters for irrigation.
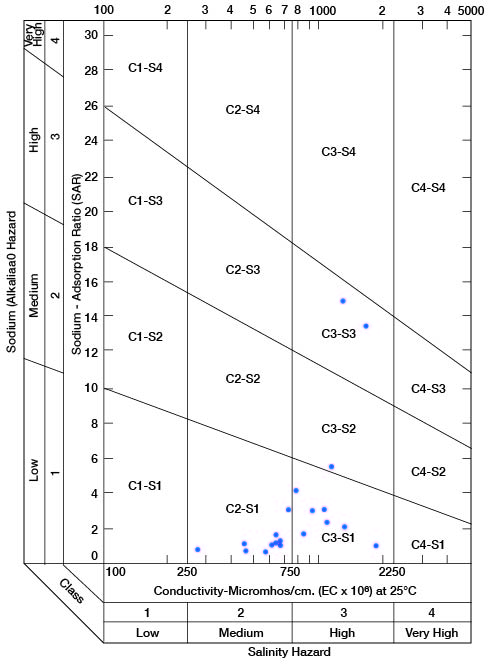
Low-salinity water (C1) can be used for irrigation of most crops on most soils with little likelihood that soil salinity will develop. Medium-salinity water (C2) can be used if a moderate amount of leaching occurs. Moderately salt tolerant crops such as potatoes, corn, wheat, oats, and alfalfa can be irrigated with C2 water without special practices. High-salinity water (C3) cannot be used on soils having restricted drainage. Very high salinity water (C4) can be used only on certain crops and then only if special practices are followed.
Boron is essential to normal plant growth, but the quantity required is very small. Crops vary greatly in their boron tolerances, but in general it may be said that the ordinary field crops common to Kansas are not adversely affected by boron concentrations of less than I part per million.
Prolonged use, under adverse conditions, of water having a high concentration of bicarbonate could have an undesirable effect upon the soil texture and plant growth. When such water is concentrated by evaporation, the calcium and magnesium precipitate out as carbonate. Thus the proportion of sodium in the water (percent sodium) increases, perhaps to an undesirable extent.
Figure 12 shows the classification of 20 representative samples of water from Cloud County with respect to suitability for irrigation. The well numbers for the symbols used in Figure 12 are given in Table 5.
All samples are of either medium or high salinity hazard, and proper irrigation or soil-management practices should be followed. One sample is of high salinity hazard and medium sodium hazard. Water of this class should be used only on very permeable soils, and under closely regulated conditions. Two samples are high both in salinity hazard and sodium hazard and can be regarded as generally unsatisfactory for irrigation use.
Table 5--Sodium-adsorption ratio (SAR), conductivity (C), class of irrigation water, and intervals sampled in wells shown in Figure 12.
| Well Number | Interval sampled (feet) |
SAR | C | Class |
|---|---|---|---|---|
| 5-2-30bcc | 38-40 | 13.50 | 1,730 | S3-C3 |
| 5-3-18bbb | 95-100 | 1.25 | 670 | S1-C2 |
| 5-3-19cb | 62-67 | 1.15 | 460 | S1-C2 |
| 5-3-31bb | 32-37 | 2.40 | 1,030 | S1-C3 |
| 5-3-32aa3 | 3.15 | 1,020 | S1-C3 | |
| 5-5-22da | 1.15 | 650 | S1-C2 | |
| 5-5-24dd | 55-57 | 1.90 | 640 | S1-C2 |
| 6-1-3aa | 72-77 | 1.25 | 660 | S1-C2 |
| 6-2-33dc | 138-140 | 4.25 | 760 | S1-C3 |
| 6-2-33dc | 233-235 | 3.20 | 730 | S1-C2 |
| 6-4-12cd | .80 | 470 | S1-C2 | |
| 6-4-34cc | 378-380 | .75 | 590 | S1-C2 |
| 6-5-6cb | 14.80 | 1,490 | S3-C3 | |
| 7-3-21ba | 5.50 | 1,160 | S2-C3 | |
| 7-3-35cb | 1.05 | 1,900 | S1-C3 | |
| 7-4-22bb | 2.35 | 1,450 | S1-C3 | |
| 8-1-13ad | .85 | 275 | S1-C2 | |
| 8-4-23cbd | 1.10 | 620 | S1-C2 | |
| 8-5-7cb | 46-48 | 1.90 | 860 | S1-C3 |
| 8-5-25cc | 3.20 | 910 | S1-C3 |
Prev Page--Geology || Next Page--Geologic Formations
Kansas Geological Survey, Geology
Placed on web June 29, 2009; originally published May 1959.
Comments to webadmin@kgs.ku.edu
The URL for this page is http://www.kgs.ku.edu/General/Geology/Cloud/05_gw.html