Prev Page--Data Analysis || Next Page--Conclusions
Waconda Flow Releases for Attaining Desired Chloride at Beloit
The increase in the flow rate release from Waconda Lake necessary for diluting water in the Solomon River to reduce the chloride concentration at Beloit to a particular level primarily depends on
- The existing flow rate before the increased release at the dam outlet,
- The flow rate in the river at Beloit before the increased release,
- The chloride content of the lake outlet water,
- The chloride content of the river water at Beloit, and
- The desired chloride concentration of the river water at Beloit.
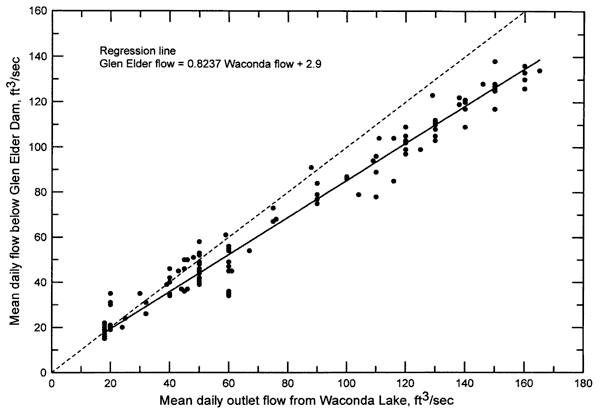
The flow rate at the USGS gaging station below Glen Elder Dam is well correlated with the outlet flow released from Waconda Lake based on monthly values for 1989-2002 (Figure 35). The solid line in the graph is the linear regression for the data whereas the dashed line represents a one-to-one relationship of the two flows. The main deviations from the one-to-one line are higher flows at the USGS gage downstream of the dam that occur when there is substantial runoff in the watershed area below the dam. Some of the slightly higher flows from the outlet in comparison with those at the USGS gage might possibly be related to recharge of the alluvial aquifer caused by bank storage and in response to pumping from the aquifer. Figure 36 displays the mean daily flow at the USGS station below Glen Elder versus the mean daily outlet flow from the dam for the study period of May 2002 through April 2003. The flow data for the USGS station were examined for local runoff events and the values for these events were removed before plotting in Figure 36. The graph shows that at flows >40 ft3/sec the flow at the USGS station was less than that of the outlet release. This suggests that a small amount of the water released from the dam does enter the alluvial aquifer in the 3.6 river miles between the dam and the USGS gaging station, and that the amount increases with increasing outlet flow. For flows <40 ft3/sec, the dam release and USGS station values are essentially the same. Thus, during conditions of low flow that would be applicable when increased releases for chloride dilution would be considered, the flows appear close enough that the USGS flow at the station below Glen Elder Dam can be used as a good estimator of the outlet release.
Figure 35. Monthly flow of the Solomon River at the USGS gaging station below Glen Elder Dam versus monthly outlet flow from Waconda Lake for 1989-2002. The solid line is a linear regression and the dashed line is a one-to-one relationship of the flows.

Figure 36. Mean daily flow of the Solomon River at the USGS gaging station below Glen Elder Dam versus mean daily outlet flow from Waconda Lake for May 2002-April 2003. Flow events for runoff between the dam and the USGS gaging station were removed before plotting the data. The solid line is a linear regression and the dashed line is a one-to-one relationship of the flows.

A small increase in Solomon River flow would usually be expected from the USGS gaging station below Glen Elder to Beloit during low flow periods due to ground-water discharge from the alluvial aquifer and any small tributary inflows. There are no major tributaries that enter the river in this stretch. Irrigation water pumped from the river decreases the flow during the irrigation season. However, water is released from Waconda Lake for the irrigation diversions. The flow during these releases is usually substantially greater than low flows of concern for high salinity. The USGS started gaging flow at the station below Glen Elder Dam on October 1, 1964, about a month before construction of the dam began. The USGS gaged flow on the Solomon River at Beloit up to September 30, 1965. Thus, there is only one year during which both gaging stations were operating simultaneously. Examination of the records during low flow periods at both stations indicates that the flow at Beloit was approximately 13% greater than the flow below Glen Elder Dam. A one-day lag in flow time was used for the estimation. Mark Billinger of the DWR calculated the river flow at Beloit for three days during the study based on gaging below the diversion dam at Beloit and the withdrawal of the City supply (2.4 cfs). His flow values are 23.3 ft3/sec on 5/21/02, 26.7 ft3/sec on 11/22/02, and 26.6 ft3/sec on 12/30/02. The average increase in flow between the Glen Elder and Beloit ranges from 18 to 23% depending on whether the sum of the flow differences is divided by the sum of the flows for the three days (with a one-day lag time) below Glen Elder or the average of the three individual increases is computed. Additional measurement of flow during low flow periods at Beloit would allow better determination of the flow increase between the two locations, especially considering that irrigation withdrawals from the alluvial aquifer are larger now than in 1965.
Part of a small increase in the lake outflow would be lost as alluvial aquifer recharge during flow between the dam and Beloit until a new equilibrium developed between the river level and the water-level in the aquifer. After a few days of increased flow release, the change is expected to be too small to be considered in the calculations. The river flow at Beloit is estimated to be 1.13 times the flow below Glen Elder Dam for the purposes of the dilution calculations in this study.
The chloride dilution equation is based on a load calculation (flow times chloride concentration)
![]()
where
ΔF is the increase in flow released from Waconda Lake, ft3/sec,
FR1 is the outlet flow from the lake before the added release, ft3/sec,
CB1 is the chloride concentration of the Solomon River at Beloit before the release, mg/L,
CB2 is the chloride concentration of the river desired at Beloit, mg/L,
and CR is the chloride concentration of the lake water (outlet flow), mg/L.
The average chloride content of the lake outlet water during this study was 107 mg/L. If the desired chloride concentration in the river at Beloit is 240 mg/L (10 mg/L less than the secondary drinking water standard of 250 mg/L), equation 1 simplifies to
![]()
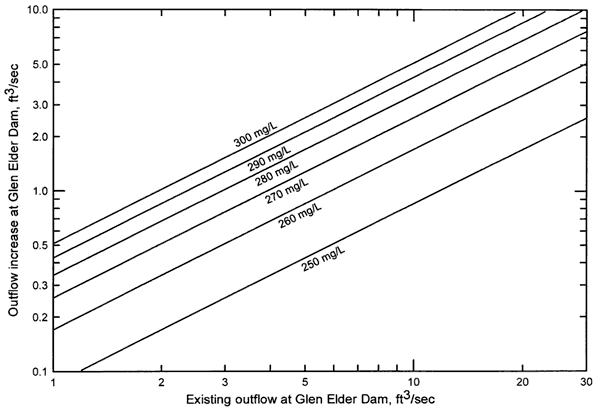
Figure 37 displays a series of lines for different chloride contents of the Solomon River at Beloit from 250 mg/L to 300 mg/L (the variable CB1) for the simplified equation 2. As discussed earlier, the historical river flow below Glen Elder Dam or at Beloit that produced a chloride concentration exceeding 250 mg/L in the Solomon River was less than 10 ft3/sec. Thus, outlet releases greater than 20 ft3/sec from Glen Elder Dam would probably not be a condition during which the chloride content at Beloit would exceed 250 mg/L. If the chloride concentration in the Solomon River at Beloit were 270 mg/L and the existing outlet flow at the dam were 10 ft3/sec, the outlet release would need to be increased by 2.55 ft3/sec to dilute the chloride concentration at Beloit to 240 mg/L based on simplified equation 2 or Figure 37. If the existing outlet flow were smaller or larger than 10 ft3/sec and the given conditions the same, the dam outflow would need to be increased by an amount proportional to the different existing outflow (existing flows of 5 ft3/sec and 20 ft3/sec would require increases of 1.27 ft3/sec and 5.10 ft3/sec, respectively) for the same desired chloride content of 240 mg/L. A flow release of 2.55 ft3/sec is in the general range of the maximum rate of 2.84 ft3/sec (1,275 gpm) that the City of Beloit can divert from the river based on its combined vested and appropriation water rights. In addition, the example outlet increase is in the range of the 2.76 ft3/sec flow that would result if the City called for a full-year release of all of its storage right of 2,000 acre-ft in Waconda Lake under a contract with the USBR.
Figure 37. Outflow increase needed from Waconda Lake to dilute Solomon River water at Beloit to 240 mg/L versus existing lake outflow for different starting chloride concentrations at Beloit given a Waconda Lake (outlet) chloride content of 107 mg/L. A larger version of this figure is available.
The chloride concentration of Waconda Lake or the outlet flow has ranged from 25 mg/L to 112 mg/L during 1980-2003. The lake chloride level would probably be higher than 50 mg/L during a very dry period when the chloride concentration of the Solomon River at Beloit exceeded 250 mg/L. If the chloride concentration in the river at Beloit is 270 mg/L and the desired chloride level is 240 mg/L, the flow release equation simplifies to
![]()
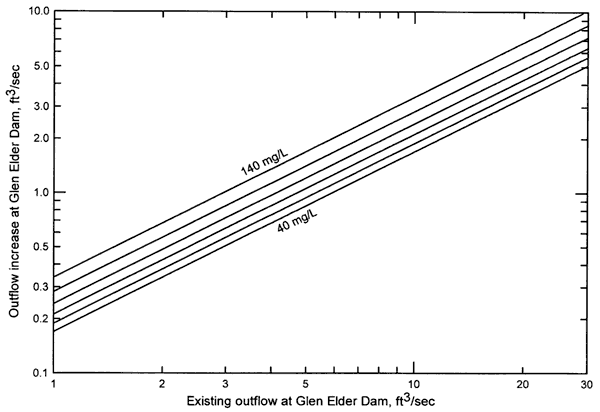
Figure 38 shows a series of lines for different chloride contents of Waconda Lake outflow from 40 mg/L to 140 mg/L (the variable CR) for simplified equation 3. For example, if the chloride concentration in the lake outflow were 60 mg/L and the existing outlet flow at the dam were 10 ft3/sec, the outlet release would need to be increased by 1.9 ft3/sec to dilute the chloride concentration at Beloit to 240 mg/L. If the chloride content of the lake outflow were 140 mg/L, the example outlet flow of 10 ft3/sec would need to be increased by 3.4 ft3/sec for the same desired chloride content of 240 mg/L. In general, the outflow needed for the dilution based on this and the previous example is relatively small.
Figure 38. Outflow increase needed from Waconda Lake to dilute Solomon River water at Beloit to 240 mg/L versus existing lake outflow for different chloride concentrations of Waconda Lake given an initial chloride content of 270 mg/L at Beloit. The lines for Waconda Lake chloride concentration ranges from 40 mg/L to 140 mg/L in 20 mg/L intervals. A larger version of this figure is available.
Errors in outflow increase equation 1 include uncertainty in the flow change in the Solomon River from the dam to Beloit, the flow measurements, and the chloride determinations. The greatest uncertainty is the flow change in the river from the dam outlet to Beloit. This includes uncertainty in the factor of 1.13 in the equation for the average increase in flow from the gaging station below Glen Elder Dam to Beloit as well as any flow changes resulting from bank storage after a reservoir release. If these combined uncertainties produced as much as ±15% error in the factor 1.13 in the equation, the flow change factor between the gaging station and Beloit could range from 0.96 to 1.30. However, a flow factor of less than one would mean that flow was lost between the dam and Beloit. Lost flow would include the mixture of the dam outlet water and ground-water discharge and tributary flow downstream of the dam. If the lost flow occurred in the upper stretch of the river reach between Glen Elder and Beloit and saline ground-water discharge just upstream of Beloit mixed with the reduced flow, the flow factor needed in the equation could actually be greater than rather than less than 1.0. Thus, the minimum flow factor should not be less than 1.0 in the equation. The error in a low flow measurement at the dam outlet could be as much as ±10%. The accuracy of a good chloride determination for water could have an uncertainty of ±5%. The sign of all the errors can be selected to produce the minimum and maximum values for outflow increase equation 1 given a particular set of conditions. For the first example based on equation 2 (existing outlet flow of 10 ft3/sec, starting chloride content of 270 mg/L at Beloit, desired chloride level of 240 mg/L at Beloit, and chloride concentration of 107 mg/L in the lake outflow), the minimum and maximum increases for the stated uncertainties would be 1.07 ft3/sec and 4.87 ft3/sec, respectively, compared to the increase of 2.55 ft3/sec for the given values. These flow numbers represent errors of-58% and +91% in the computed outlet increase of 2.55 ft3/sec. If the existing outlet flow was larger or smaller, and the other conditions remained the same, the percentage errors would be the same in the calculated outlet increase. The percentage error appears to be large but the minimum and maximum deviations from the 2.55 ft3/sec example are relatively small flows of 1.48 ft3/sec and 2.32 ft3/sec, respectively.
The error in the chloride content of the lake outflow used in the equation would be larger if it were estimated from a specific conductance reading. However, Figure 38 indicates that a reasonable estimate of chloride from a conductance reading would not produce a large difference in the calculated increase in flow release if the outlet chloride were not above 120 mg/L. Lower actual chloride contents for the lake would give smaller errors in the equation 3 calculations if the chloride were based on conductance estimates, assuming a similar percentage error in the conductance reading and chloride estimate as for a higher chloride concentration.
The data collected for this study indicate that the chloride concentration of Waconda Lake water during a period of drier than normal climatic conditions is approximately between the chloride contents of the inflow from the North and South Forks of the Solomon River. During the 2002-2003 sampling, the mean chloride of the North Fork Solomon River at Downs was 66.5 mg/L, of the South Fork Solomon River near Corinth was 125 mg/L, and of the lake outflow was 107 mg/L. The lake collects high runoff flows that dilute the chloride content of the lake water. During dry periods, the lake chloride concentration increases as a result of evaporation losses that leave the residual salts in a smaller volume. These two factors oppose each other and appear to have resulted in a lake chloride value that is roughly the same as mixing of the inflows from the two forks of the Solomon River. In general, the mixing and retention of both high and low inflows of the river forks in Waconda Lake moderates the extremes in the chloride contents of the inflows. Limitations on the releases based on the bypass of natural flow principle (assuming that Waconda Lake were not present) could be considered by using the average of the chloride concentrations of the North and South forks of the Solomon River at Downs and near Corinth instead of the outlet chloride content in the flow release equation. The Downs and Corinth locations are better for the calculation than the KDHE stations at Portis and below Osborne because the sampling locations closer to the lake would include additional inflow. The long-term mean annual flow (from the mid-1940s to 2002) of the North Fork Solomon at Portis is 122 ft3/sec and of the South Fork Solomon at Osborne is 113 ft3/sec. These mean flows are close enough such that a simple average of the chloride concentrations of the North and South forks approximates the relative mixture of the two lake inflows. The highest chloride contents of the river inflows to the lake at the Downs and near Corinth sampling locations during 2002-2003 were 72.4 mg/L and 152 mg/L, respectively, on March 25, 2003. The average for these two values, 112 mg/L, could be used in the flow release equation instead of the 108 mg/L for the lake outlet on that date. The difference in the flow release values in such a computation would be only 0.08 ft3/sec. Consideration of the natural flow principle (without the dam) would produce an insignificant difference in the calculation for these conditions.
Prev Page--Data Analysis || Next Page--Conclusions
Kansas Geological Survey, Geohydrology
Comments to webadmin@kgs.ku.edu
Placed online Jan. 18, 2006
URL=http://www.kgs.ku.edu/Hydro/Publications/2003/OFR03_49/05_flow.html

