![]()
Prev Page--Water-Quality Data || Next Page--Waconda Flow Releases
Data Analysis
Water-Quality Characteristics of Sampling Sites
The range, median, and mean values for specific conductance and chloride and sulfate concentrations for the sites in Tables 1 and 2 are listed in Table 4. Sample sites in Tables 1 and 2 that are at the same location are combined in the data summaries for Table 4. The specific conductance values in the table provide a relative measure of the total dissolved solids content of the waters.
Table 4. Water-quality characteristics for rivers and streams in the study area having chloride and sulfate concentration data.
| Surface water body |
Location | Data sources |
Station Nos. |
Data period |
Parameter | Number of records |
Range | Mean | Median |
|---|---|---|---|---|---|---|---|---|---|
| North Fork Solomon watershed | |||||||||
| North Fork Solomon River |
At Portis | USGS KDHE KDHE |
6872500 1709 014 |
1961-2003 | Sp.C.a | 523 | 270-1720 | 969 | 1010 |
| Clb | 524 | 5-99.5 | 50.0 | 49.0 | |||||
| SO4b | 524 | 16-469 | 197 | 203 | |||||
| Twelvemile Creek |
Near Downs | KDHE | 674 | 1993-2001 | Sp.C. | 8 | 550-1330 | 1101 | 1228 |
| Cl | 8 | 24.3-87.8 | 71.3 | 79.1 | |||||
| SO4 | 8 | 65.1-236 | 188 | 214 | |||||
| North Fork Solomon River |
At Downs | KGS | 2002-2003 | Sp.C. | 12 | 860-1185 | 1089 | 1088 | |
| Cl | 12 | 53.7-78.2 | 66.5 | 67.3 | |||||
| SO4 | 12 | 173-241 | 216 | 219 | |||||
| Oak Creek | Near Cawker City |
USGS KDHE |
06872700 544 |
1962-1970 and 1990-2003 |
Sp.C. | 73 | 322-1790 | 1183 | 1227 |
| Cl | 73 | 10.8-134 | 62.9 | 65.1 | |||||
| SO4 | 73 | 39.0-413 | 257 | 267 | |||||
| South Fork Solomon watershed | |||||||||
| South Fork Solomon River |
At Osbome | USGS KDHE KDHE |
6874000 1710 015 |
1961-1994 | Sp.C. | 461 | 250-1931 | 1075 | 1076 |
| Cl | 462 | 4-330 | 88.0 | 79.0 | |||||
| SO4 | 462 | 16-508 | 217 | 210 | |||||
| South Fork Solomon River |
Below Osbome |
KDHE | 543 | 1990-2003 | Sp.C. | 71 | 245-1840 | 1409 | 1468 |
| Cl | 71 | 5.7-197 | 124 | 127 | |||||
| SO4 | 71 | 29-499 | 315 | 318 | |||||
| Twin Creek | Near Corinth |
KDHE | 668 | 1992-2000 | Sp.C. | 11 | 277-2760 | 1861 | 2120 |
| Cl | 11 | 3.4-141 | 96.6 | 120 | |||||
| SO4 | 11 | 40.0-1060 | 642 | 704 | |||||
| South Fork Solomon River |
Near Corinth |
KGS | Sp.C. | 12 | 1140-1550 | 1371 | 1375 | ||
| Cl | 12 | 107-152 | 125 | 125 | |||||
| SO4 | 12 | 266-330 | 304 | 308 | |||||
| Carr Creek | Near Cawker City |
KDHE | 669 | 1992-2000 | Sp.C. | 11 | 263-2580 | 1795 | 2000 |
| Cl | 11 | 5.0-201 | 119 | 141 | |||||
| SO4 | 11 | 30.0-952 | 526 | 556 | |||||
| Waconda Lake and Solomon River watershed downstream of Glen Elder Dam | |||||||||
| Waconda Laked |
KDHE | 18001- 18005 |
1977-2001 | Sp.C. | 8 | 687-1128 | 921 | 905 | |
| Cl | 8 | 25.2-102 | 75.1 | 76.1 | |||||
| SO4 | 8 | 147-303 | 223 | 221 | |||||
| Solomon River |
At outlet of Glen Elder Dam |
KGS | 2002-2003 | Sp.C. | 52 | 1090-1180 | 1139 | 1150 | |
| Cl | 52 | 98.1-112 | 107 | 109 | |||||
| SO4 | 52 | 265-304 | 284 | 282 | |||||
| Limestone Creek |
At Glen Elder |
USGS KDHE |
6875800 667 |
1962-1970 and 1991-2001 |
Sp.C. | 12 | 214-1680 | 1142 | 1260 |
| Cl | 12 | 6.4-127 | 68.5 | 72.3 | |||||
| SO4 | 12 | 24.0-321 | 203 | 213 | |||||
| Solomon River |
Near Glen Elder |
USGS KDHE |
6875900 089 |
1965-1998 | Sp.C. | 315 | 206-2430 | 892 | 890 |
| Cl | 316 | 4-435 | 76.1 | 71.0 | |||||
| SO4 | 316 | 18-290 | 178 | 187 | |||||
| Solomon River |
At Beloit | USGS KDHE KGS |
6876000 1708 |
1948-1965 1972,1974 2002-2003 |
Sp.C. | 197 | 163-2170 | 923 | 994 |
| Cl | 196 | 0.4-436 | 82.6 | 77.0 | |||||
| SO4 | 197 | 3.2-310 | 154 | 160 | |||||
| Solomon River |
Near Glasco | KDHE | 511 | 1990-2003 | Sp.C. | 75 | 658-3520 | 1606 | 1470 |
| Cl | 78 | 45.5-740 | 230 | 173 | |||||
| SO4 | 78 | 87-390 | 277 | 286 | |||||
|
a Specific conductance in μS/cm at 25 degrees Celcius b Chloride in mg/L c Sulfate in mg/L d Each observation for a particular date represents an average of values for samples collected at different lake stations. |
|||||||||
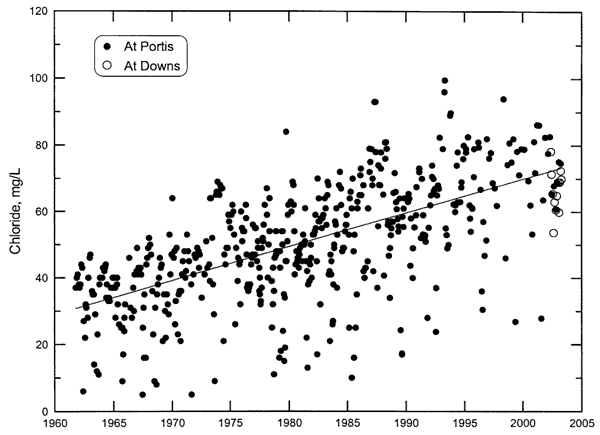
The ranges in the specific conductance and chloride and sulfate concentrations of the two tributaries to the North Fork Solomon River and of the river at Downs were generally within the ranges for the North Fork Solomon River at Portis. Oak Creek had a higher maximum chloride content than for the river at Portis but only by about 34 mg/L. Although the mean and median chloride concentration of samples from Twelvemile Creek were somewhat higher than for the North Fork Solomon River locations, the results were only based on 8 samples. Oak Creek had somewhat greater mean and median sulfate contents than the river sample sites. The mean and median chloride and sulfate concentrations of the North Fork Solomon River at Downs during 2002-2003 were somewhat greater than for the river at Portis during 1961-2003. Figure 3 indicates that the chloride concentration of the river at Portis has been generally increasing with time. The sulfate content of the river at Portis has also increased during the same period. The chloride values for the river at Downs obtained for this study are in the middle of the range for the river at Portis during the last several years (Figure 3). The data suggest that the river sampling site at Portis represents relatively well the salinity of water entering Waconda Lake.
Figure 3. Change in chloride concentration with time in the North Fork Solomon River at Portis during 1961-2003. The line is a linear regression for the data. Data for the samples collected as a part of this study from the river at Downs are also included.
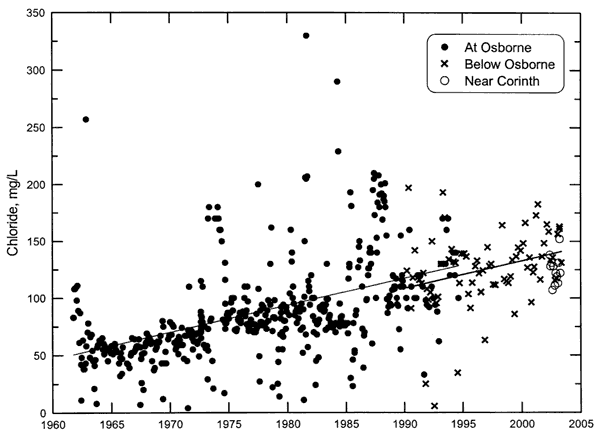
Water entering Waconda Lake from the South Fork Solomon River and tributaries generally contains higher dissolved solids, chloride, and sulfate concentrations than the water entering the lake from the North Fork Solomon River and tributaries. The main difference between the water quality of the tributaries in the South Fork Solomon watershed and the river water is the higher sulfate content in both Twin Creek and Carr Creek. The mean and median chloride and sulfate contents of the South Fork Solomon River below Osborne for 1990-2003 were greater than those for the river at Osborne during 1961-1994. However, the values for the KDHE water-quality site 542 west of Osborne for 1990-1998 (not included in this study and Tables 1 and 4) were in the same general range as for below Osborne. This indicates that the higher concentrations for 1990-2003 in the river downstream of Osborne than for the river at Osborne during 1961-1994 are not primarily caused by municipal wastewater effluent from Osborne, but by some other factor. The chloride concentration of the South Fork Solomon River at Osborne increased during the data period of 1961-1994 (Figure 4). The sulfate content of the river at or below Osborne has also increased during the same period. The points for the river chloride content below Osborne at KDHE site 543 in Figure 4 appear to be an extension of the general increase in concentration with time. The mean and median chloride and sulfate concentrations of the South Fork Solomon River near Corinth during 2002-2003 are not substantially different from the values for the river below Osborne for 1990-2003. This is also shown by the same general range in points for chloride concentration for the two sampling sites on Figure 4.
Figure 4. Change in chloride concentration with time in the South Fork Solomon River at and below Osborne during 1961-2003. The lines are linear regressions for the data. Data for samples collected as a part of the study from the river near Corinth are also included.
Carr Creek enters Waconda Lake downstream of the river near Corinth and had an appreciably higher sulfate concentration during the limited sampling conducted at the site than for the South Fork Solomon River data. However, the chloride data are in the same general range as for the river water. In addition, the amount of flow contributed to Waconda Lake from Carr Creek is expected to be substantially lower than that from the river. In general, the KDHE monitoring site on the South Fork Solomon River is expected to represent relatively well the salinity of water entering Waconda Lake.
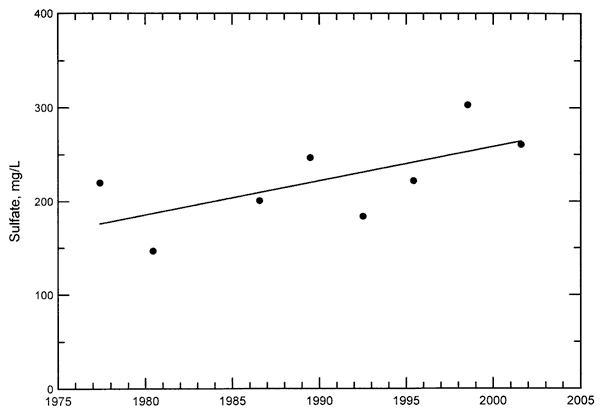
The mean and median chloride contents of Waconda Lake during 1977-2001 were 75 and 76 mg/L, respectively. The data used for the determination of the mean and median are the averages of measurements at different sites at the lake for a particular date. The linear regression for the chloride concentration record for Waconda Lake (Figure 5) suggests an increase with time. However, the correlation between chloride and time is not statistically significant due to the large variation in the values for the limited number of observations. The plot for sulfate versus time for the lake (Figure 6) also suggests an increase during the sampling period. Although the correlation coefficient is higher for the data in Figure 6 than in Figure 5, it is still not quite statistically significant. A graph of specific conductance versus time shows a similar increase during the sampling period but the increase is not statistically significant. Additional sampling of the lake over time will be necessary to confirm that the increases are significant. The increases are consistent with the rises in both chloride and sulfate concentrations (both of which are statistically significant) from the 1960s to the early 2000s in the North and South forks Solomon River. Based on the lake data, the estimated range in chloride and sulfate concentrations that could usually be expected in outflows from Waconda Lake are 60-110 mg/L and 150-320 mg/L, respectively.
Figure 5. Change in chloride concentration with time in Waconda Lake during 1977-2001 based on KDHE data. The line is a linear regression for the data.
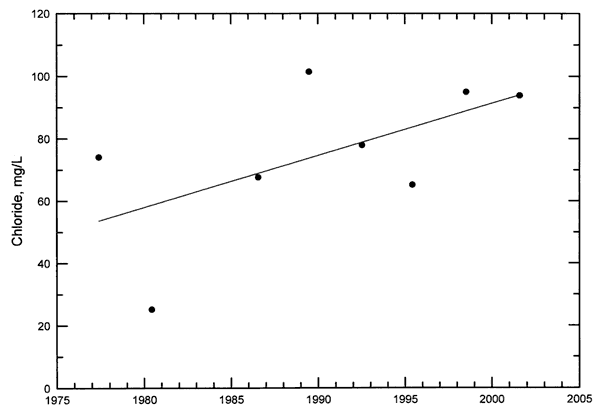
Figure 6. Change in sulfate concentration with time in Waconda Lake during 1977-2001 based on KDHE data. The line is a linear regression for the data.
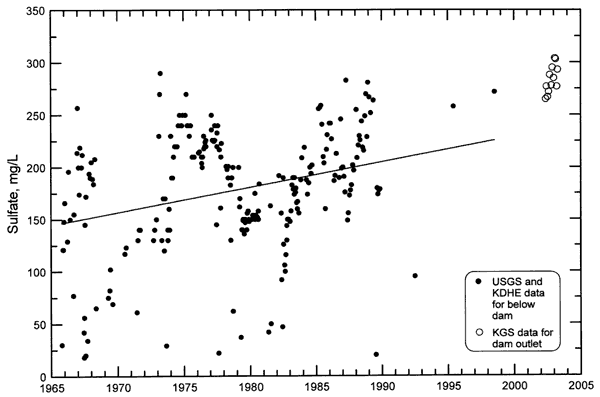
The historical range in chloride concentration for the Solomon River below Glen Elder (Table 4) is substantial (4-435 mg/L) and is appreciably greater than the range in the sulfate content (18-290 mg/L). The USGS and KDHE sites at which samples were collected are located between 3 and 4 miles downstream of the dam outlet. The low chloride and sulfate concentration values represent runoff from rainstorms that entered the river downstream of the dam. For example, Limestone Creek drains into the river upstream of the USGS and KDHE sampling sites. The low chloride and sulfate values in the range for the creek waters are not substantially different from the low values for the river. The much greater chloride concentration in the Solomon River at the sampling site than for water in Lake Waconda indicates that ground-water discharge high in chloride content enters the river downstream of the dam. The samples obtained for this study by the DWR and the KGS in the river below the dam were collected at the end of the outlet. Thus, they represent the water from the lake without the influence of runoff from below the lake or ground-water discharge from the alluvial aquifer.
The long-term chloride record (1965-1998) for the Solomon River below Glen Elder Dam (Figure 7) shows that there are several values that are much greater than the usual historical range. These values occurred when the river flow was very low. The water collected on those dates probably represented primarily ground-water discharge from the alluvial aquifer with only a small influence of outflow or underflow from Waconda Lake. Figure 8 only displays the chloride data for flows that are ≥20 ft3/sec at the USGS gaging station on the Solomon River below Glen Elder Dam. All of the chloride values for these flows are below 200 mg/L. Points for the samples collected for this study at the dam outlet are also included in Figure 8. The linear regression for the data displayed in Figure 8 indicates that there is an increasing trend in chloride concentration with time; the increase is statistically significant. The data for the samples collected in 2002-2003 at the dam outlet for this study were not included in the correlation calculation. Sulfate concentration also increased during the period 1965-1998 (Figure 9). As for the trend in chloride, the increase is statistically significant. The sulfate content of the lake outflow exceeded the secondary drinking water level of 250 mg/L for all of the collection period in 2002-2003 for this study. It is possible that the lake outflow does not represent well the sulfate content at the USGS and KDHE sampling stations a few miles downstream of the dam outlet. Ground-water discharge and stream inflow to the river could dilute the sulfate concentration during wet conditions between the dam and the USGS and KDHE sampling location. For example, the sulfate concentration of Limestone Creek is generally lower than that in the 2002-2003 outflow from the dam.
Figure 7. Change in chloride concentration with time in the Solomon River below Glen Elder Dam during 1965-1998 based on USGS and KDHE data. The line is a linear regression for the data.
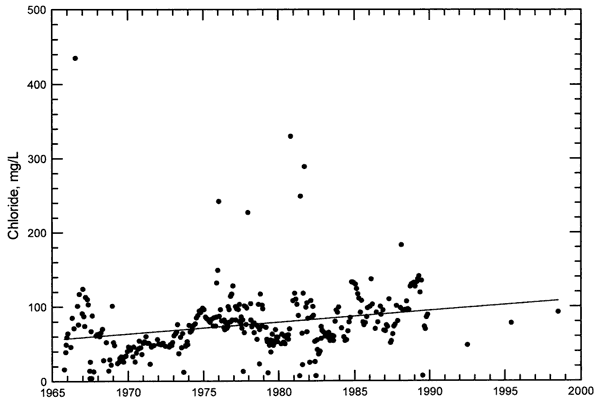
Figure 8. Change in chloride concentration with time in the Solomon River below Glen Elder Dam during 1965-1998 for river flows ≥20 ft3/sec. The line is a linear regression for the data. Points for the dam outlet samples collected in 2002-2003 are also shown.
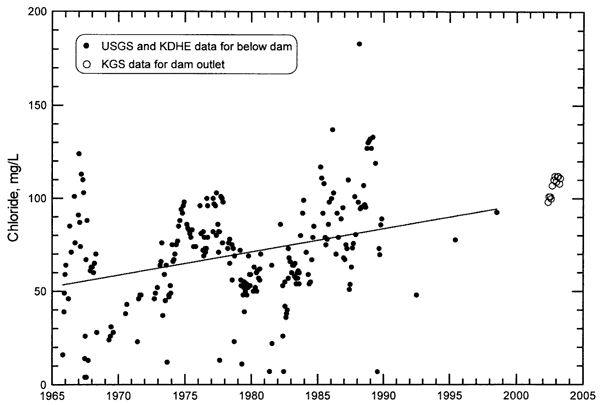
Figure 9. Change in sulfate concentration with time in the Solomon River below Glen Elder Dam during 1965-1998 for river flows ≥20 ft3/sec. The line is a linear regression for the data. Points for the dam outlet samples collected in 2002-2003 are also shown.
The historic record of water quality for the Solomon River at Beloit is limited to USGS data for 1948-1965, KDHE analyses for several days during August 1972 and September 1974, and KGS measurements for 2002-2003, and the values from the City of Beloit water plant. As indicated above, the KGS determinations of chloride for the same days as for the City analyses indicated that the City values averaged 22% higher than those of the KGS, and the sulfate values of the City averaged 10% greater but varied more than those for chloride. The City data are discussed separately due to the greater error than expected in the USGS and KDHE values and known in the KGS data used in this report.
The chloride and sulfate concentrations appear to have increased with time in the Solomon River at Beloit based on USGS, KDHE, and KGS data (Figures 10 and 11). However, the distribution of the data in time and relative to different flow regimes is probably responsible for much of the apparent increase. There were only two historic samples in which the chloride content exceeded 250 mg/L. The river flow during both of these dates was at historic low levels for the period of record (8.9 ft3/sec on July 23 and 0.7 ft3/sec on August 11, 1964). When the river water upstream at the USGS and KDHE sampling site below Glen Elder Dam exceeded 250 mg/L chloride content, the chloride would also be expected to be greater than this value in the river water at Beloit. These dates are July 19, 1966, October 21, 1980, and September 22, 1981. The flows of the river at the sampling location were 4.4, 0.3, and 3.1 ft3/sec, respectively. There are three periods during which the sulfate concentration in the river at Beloit exceeded 250 mg/L based on the available data of USGS, KDHE, and KGS, December 1961 to March 1962, September 1974, and May 2002 to April 2003 (Figure 11). The sulfate probably exceeded 250 mg/L before and after the latter two periods.
Figure 10. Change in chloride concentration with time in the Solomon River at Beloit during 1948-1965 (USGS), 1972 and 1974 (KDHE), and 2002-2003 (KGS). The line is a linear regression for the data.
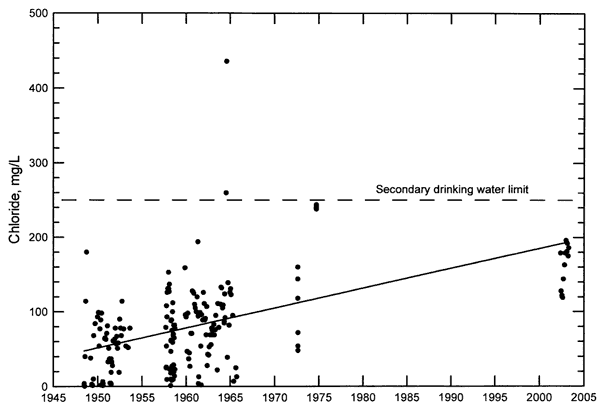
Figure 11. Change in sulfate concentration with time in the Solomon River at Beloit during 1948-1965 (USGS), 1972 and 1974 (KDHE), and 2002-2003 (KGS). The line is a linear regression for the data.
The chloride values of the City of Beloit for the data set of 1988-2003 were all adjusted downward using the regression equation from Figure 2 based on the comparison with the KGS values for 2002-2003. This considerably reduced the number of days during which the chloride concentration appeared to exceed the 250 mg/L recommended for drinking water. Statistics for the adjusted daily values of chloride concentration are in Table 5. The mean chloride content recorded by the KGS for the Solomon River at Beloit for the 12 sampling dates during 2002-2003 is 164 mg/L, which is close to the mean of 161 mg/L for the adjusted chloride values of the City from May 1, 2002 to April 30, 2003. None of the monthly averages for the adjusted chloride measurements exceeded 250 mg/L during 1988-2003 (Table 5); the highest value of 210 mg/L occurred during October 1997. The sulfate measurements of the City of Beloit were adjusted downward by 10% based on comparison with the KGS values for 2002-2003. The mean and median values for adjusted daily and average monthly sulfate were close to 250 mg/L (Table 5). The highest monthly average of 356 mg/L for sulfate content occurred during December 2000.
Table 5. Statistics for adjusted chloride and sulfate concentrations of the City of Beloit water supply during 1988-2003. Concentrations are in mg/L.
| Range | Mean | Median | |
|---|---|---|---|
| Chloride (daily values) | 12-297 | 125 | 116 |
| Chloride (monthly means) | 54-210 | 127 | 118 |
| Sulfate (daily values) | 21-404 | 242 | 246 |
| Sulfate (monthly means) | 125-356 | 242 | 237 |
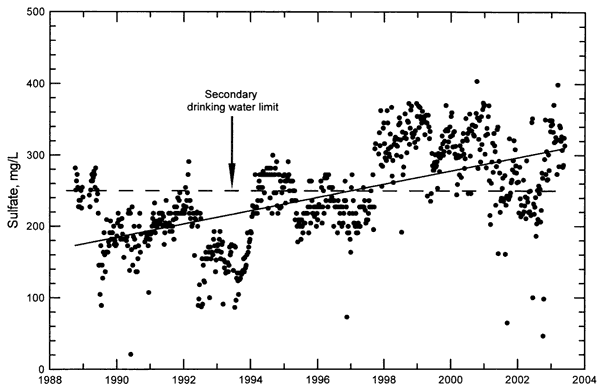
The graphs of chloride and sulfate concentrations versus time for the City of Beloit data (Figures 12 and 13, respectively) are for the adjusted measurements. Although it appears that there are several days or periods with chloride values in excess of 250 mg/L, only two periods are indicative of conditions during which the actual chloride content might have exceeded the secondary drinking water limit. The two periods were June 27 to July 7, 1992 and October 18-20, 1997. The flow ranges of the Solomon River at the USGS gaging station below Glen Elder Dam, with a one-day lag time, were 15-39 ft3/sec (15-19 ft3/sec for all days except the last day) for the first period and 16-20 ft3/sec for the second period. All of the other adjusted City values of chloride concentration that exceeded 250 mg/L are anomalously high, i.e., the values are not consistent with the preceding and following measurements and the river flow, and are probably the result of larger analytical error. The adjusted sulfate concentrations for the City record indicate that Solomon River water has exceeded the secondary drinking water limit of 250 mg/L most of the time since 1998. The mean sulfate recorded by the KGS for the Solomon River at Beloit for the 12 sampling dates is 290 mg/L, which is within 5% of the mean of 276 mg/L for the adjusted sulfate values of the City for May 2002 through April 2003. The increasing trends in both the chloride and sulfate concentrations with time shown in Figures 12 and 13 are both statistically significant. The relative increase in sulfate content is substantially greater and statistically more significant than that for chloride.
Figure 12. Change in chloride concentration with time in the Solomon River at Beloit during 1988-2003 based on values of the Beloit water plant adjusted after comparison to KGS data for 2002-2003. The line is a linear regression for the data.
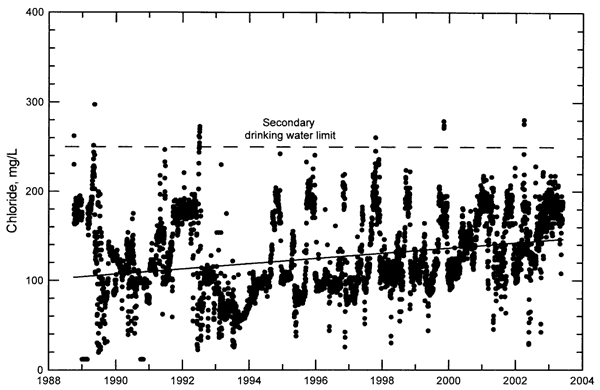
Figure 13. Change in sulfate concentration with time in the Solomon River at Beloit during 1988-2003 based on values of the Beloit water plant adjusted after comparison to KGS data for 2002-2003. The line is a linear regression for the data.
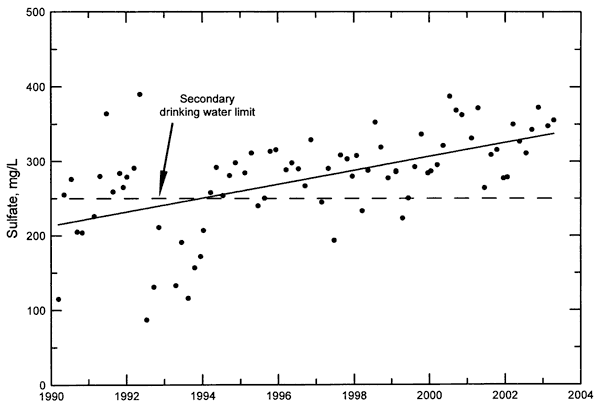
The chloride and sulfate concentration record for the Solomon River near Glasco starts in 1990 and is based on KDHE monitoring site 511 (Figures 14 and 15). The mean chloride content of 230 mg/L was only 20 mg/L less than the secondary drinking water limit and the river water exceeded the secondary limit almost half of the time. The chloride concentration at this location was substantially greater than at Beloit, reflecting the influence of additional saline water that intruded from the Dakota aquifer into the overlying alluvial aquifer along the river valley and then from the alluvial aquifer into the Solomon River. The chloride concentration varied substantially depending on the river flow. The highest values of 740 mg/L and 636 mg/L occurred on June 25, 1991 and July 17, 2000 when the Solomon River flows at the USGS gaging station near Simpson were 2.6 ft3/sec and 29 ft3/sec, respectively. The lowest value of 45.5 mg/L occurred on August 17, 1993 during high flow of 3,270 ft3/sec. The slight upward trend in the linear regression in Figure 14 is not statistically significant. The sulfate concentration in the Solomon River near Glasco exceeded the secondary drinking water limit about half of the sampling dates at the beginning of the monitoring period and all of the time near the end of the monitoring period (Figure 15). The mean sulfate content of the river water near Glasco of 277 mg/L during 1990-2003 is essentially the same (within the analytical error) as the mean (282 mg/L) for the same period at Beloit based on the values adjusted for comparison to 2002-2003 KGS analyses. The increasing trend in the sulfate content with time in Figure 15 is statistically highly significant.
Figure 14. Change in chloride concentration with time in the Solomon River near Glasco during 1990-2003 based on KDHE data for monitoring site 511. The line is a linear regression for the data.
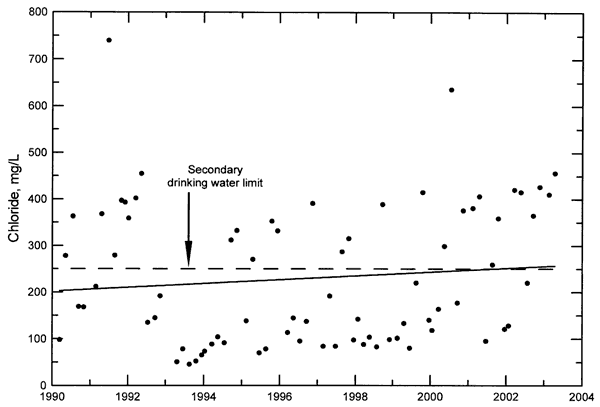
Figure 15. Change in sulfate concentration with time in the Solomon River near Glasco during 1990-2003 based on KDHE data for monitoring site 511. The line is a linear regression for the data.
Relationship Between Conductance and Dissolved Constituents
The electrical conductivity of water is a chemical property that is proportional to the dissolved ion concentration. Conductivity is also one of the easiest measurements to make in the field or laboratory. Therefore, the conductivity of water is often determined and used as a measure of salinity. Conductivity is measured with a cup or dip type cell with electrode surfaces that are configured such that an electric current will pass through a particular volume of water. The electrical conductivity of a substance is the reciprocal of resistance. The units of specific electrical conductance are defined as the reciprocal of the resistance of a centimeter cube of aqueous solution. The International System of Units for current scientific use expresses conductance as Siemens (S), which is the same quantity as the mho. The expression mho was derived as the reverse spelling of the resistance unit ohm and can be found in older publications. The units most commonly used for specific electrical conductance of water are microsiemen per centimeter (μS/cm), which are the same as the units micromho/centimeter (μmho/cm).
The conductivity of an aqueous solution varies proportionally with the temperature. An increase in one °C in a fresh to slightly saline water results in an increase in about 2% in the specific conductance when the temperature is near 25 °C. Specific conductance values are therefore corrected for temperature and reported at the standard temperature of 25 °C. Older conductivity meters may require measurement of the temperature and meter adjustment or manual calculation of the temperature correction. Newer meters with temperature measurement can automatically correct for temperature to 25 °C. However, if not enough time is allowed for the conductivity probe to come into temperature equilibrium with the water being measured, error can still be introduced into the reading even with automatic temperature compensation.
Plots of individual major constituent and total dissolved solids concentrations against specific conductance can be used for estimating concentrations given a specific conductance measurement. The accuracy of the estimation depends not only on the accuracy of the conductance measurement but also the error in the determinations of the constituents used to prepare the plot. The long-term changes in chloride and sulfate concentrations in the Solomon River basin discussed earlier mean that data within the last 10-15 years will represent the current relationships with specific conductance better than older data. Thus, the following graphs are generally based on data within this more recent period.
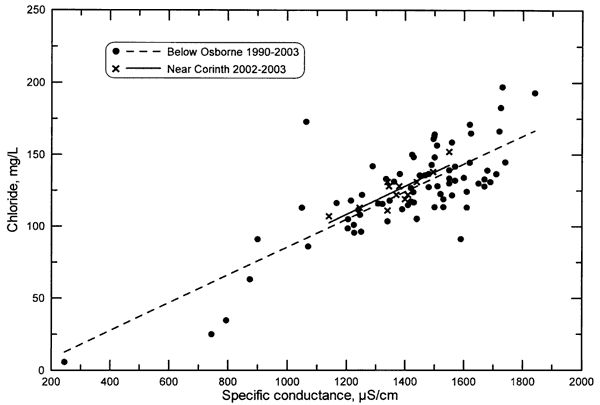
The graph of chloride concentration versus specific conductance for the North Fork Solomon River at Portis (Figure 16) shows that there is substantial scatter of points about the linear regression based on the USGS and KDHE data for the site. Some of the scatter is due to analytical error but most of the scatter is probably due to variations in the chemistry of the water derived from different locations in the watershed and different sources such as water passing through soils and sediments of the irrigated versus non-irrigated areas. The linear regression for the river at Downs based on data collected for this study is close and parallel to the regression line for the USGS and KDHE data. The plot of chloride content versus conductance for the South Fork Solomon River below Osborne (Figure 17) also displays a substantial spread in points about the linear regression. The regression line for the river near Corinth based on samples for this study is close and parallel to the regression for the KDHE data.
Figure 16. Chloride concentration and specific conductance relationship for the North Fork Solomon River at Portis based on USGS and KDHE data for 1990-2003 and at Downs based on KGS data for 2002-2003. The lines are linear regressions for the data.
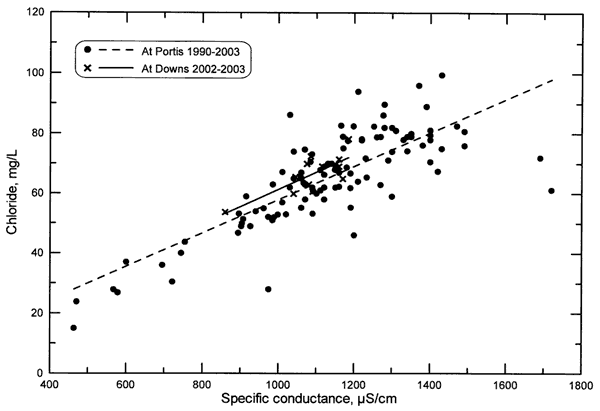
Figure 17. Chloride concentration and specific conductance relationship for the South Fork Solomon River below Osborne based on KDHE data for 1990-2003 and near Corinth based on KGS data for 2002-2003. The lines are linear regressions for the data.
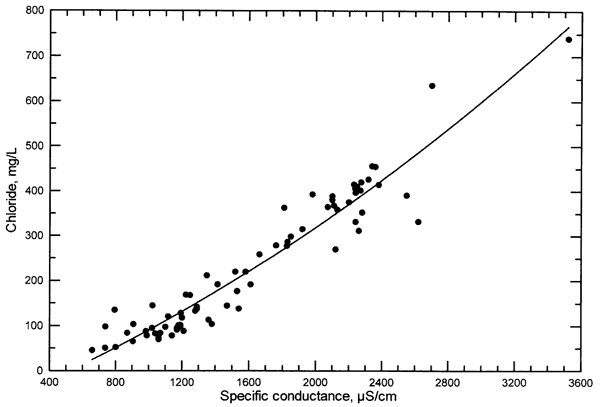
The linear regressions of the chloride concentration and specific conductance relationships for Waconda Lake (KDHE data) and the outlet flow from Glen Elder Dam (this study) are relatively similar (Figure 18). The regression line for the outlet flow is extrapolated to lower conductance values in the range for the lake data and indicate that the regression for the outlet flow is a good representation of both the lake and outflow data. There is little scatter of points for chloride content versus conductance for the Solomon River at Beloit based on the study data (Figure 18). The increase in the slope of the line reflects the increase in the amount of chloride input to the river caused by the intrusion of saline ground water between the dam and Beloit. The range in chloride concentration for the Solomon River near Glasco is the greatest of all of the sites described in this study and the distribution of points in the relationship with specific conductance shows a curved distribution on Figure 19. A second-degree polynomial curve fits the data distribution better than a linear regression.
Figure 18. Chloride concentration and specific conductance relationships for Waconda Lake (KDHE data), outlet flow at Glen Elder Dam (KGS data), and the Solomon River at Beloit (KGS data). The lines are linear regressions for the data.
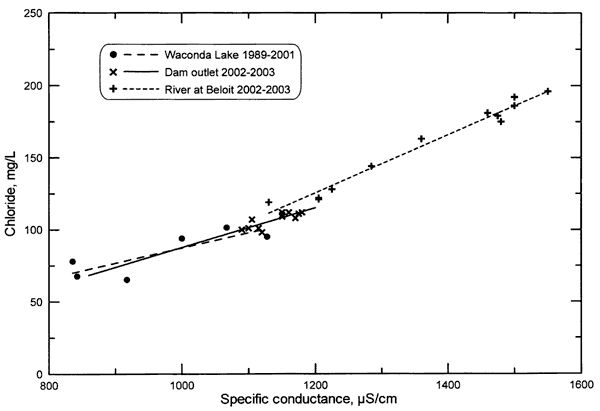
Figure 19. Chloride concentration and specific conductance relationship for the Solomon River near Glasco based on KDHE data for 1990-2003. The curve is a second-degree polynomial fit for the data.
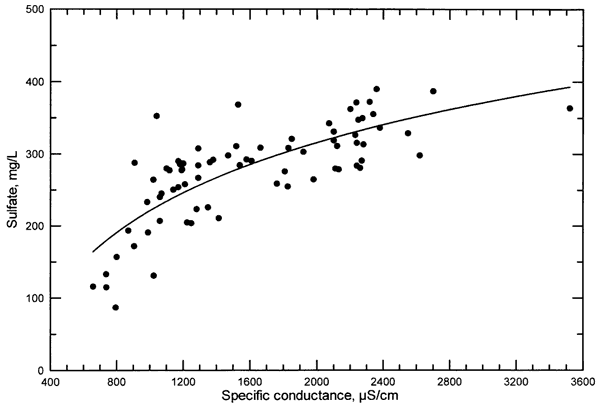
Similar graphs show the relationship of sulfate concentration and specific conductance for the North Fork Solomon River at Portis (Figure 20), the South Fork Solomon River below Osborne (Figure 21), and Waconda Lake and dam outlet and the Solomon River at Beloit (Figure 22). The point scatter for the North and South forks of the Solomon River is also relatively substantial as it is for the relationship between chloride and conductance. The decrease in the slope for the Solomon River at Beloit in comparison with the slope for the lake and outlet flow reflects the decreased percentage contribution of the sulfate content to the specific conductance because the saline water intrusion increases the chloride contribution to the total dissolved solids without adding as much sulfate. The scatter in the points for the sulfate relationship at Beloit is substantially greater than the scatter for the chloride relationship at that location. The distribution of points for sulfate versus conductance for the Solomon River near Glasco (Figure 23) is curved in the opposite direction as for the relationship between chloride and conductance (Figure 19). Although a log curve fits the data points better than a linear regression, it is not a good estimator of the sulfate values at the lowest range in observed sulfate content.
Figure 20. Sulfate concentration and specific conductance relationship for the North Fork Solomon River at Portis based on USGS and KDHE data for 1990-2003 and at Downs based on KGS data for 2002-2003. The lines are linear regressions for the data.
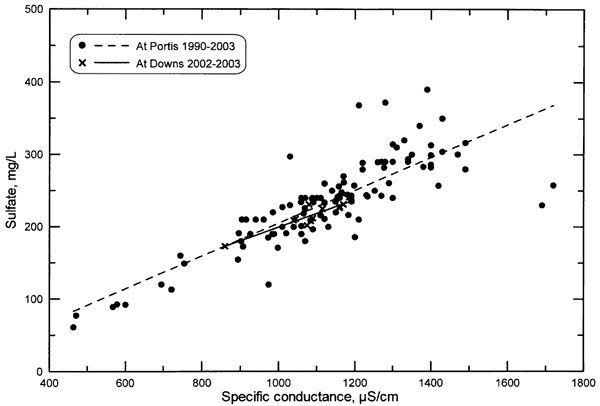
Figure 21. Sulfate concentration and specific conductance relationship for the South Fork Solomon River below Osborne based on KDHE data for 1990-2003 and near Corinth based on KGS data for 2002-2003. The lines are linear regressions for the data.
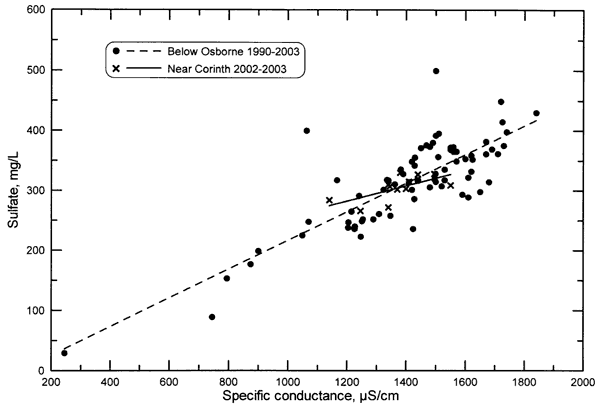
Figure 22. Sulfate concentration and specific conductance relationships for Waconda Lake (KDHE data), outlet flow at Glen Elder Dam (KGS data), and the Solomon River at Beloit (KGS data). The lines are linear regressions for the data.
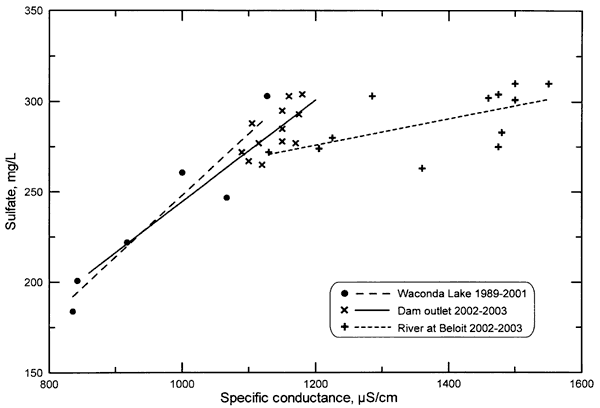
Figure 23. Sulfate concentration and specific conductance relationship for the Solomon River near Glasco based on KDHE data for 1990-2003. The curve is a log function fit for the data.
All of the best-fit lines for the chloride concentration and specific conductance relationships for the study locations are shown on Figure 24. The graph extends only to a conductance of 2,000 μS/cm to display more detail for the sites. Thus, the upper part of the curve for the Solomon River near Glasco is not included. The increase in the slope of the lines indicates the increasing percentage of the specific conductance contributed by the chloride content of the river and lake waters. The graph indicates that the dissolved solids content of the South Fork Solomon River contains a greater percentage of chloride than the North Fork Solomon River. The greater slope for Waconda Lake and the dam outlet water than for the South and North forks of the Solomon River is probably partly related to the concentration of the lake water by evapotranspiration causing chemical precipitation of carbonate minerals, thereby increasing the relative importance of chloride to the total dissolved ion content. Without this effect, the regression line for the lake and outlet water would be expected to be somewhere between the lines for the North and South forks. The best-fit lines for the Solomon River at Beloit and near Glasco are very similar. The curve for the river near Glasco could probably be used to estimate chloride concentrations for the river at Beloit for lower conductance values than observed during 2002-2003 for this study.
Figure 24. Summary of chloride concentration and specific conductance relationships for the Solomon River and Waconda Lake in the study area. The lines are the same as those in Figures 15-18.
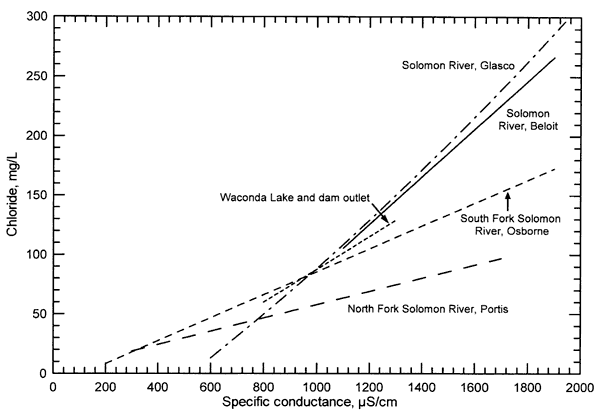
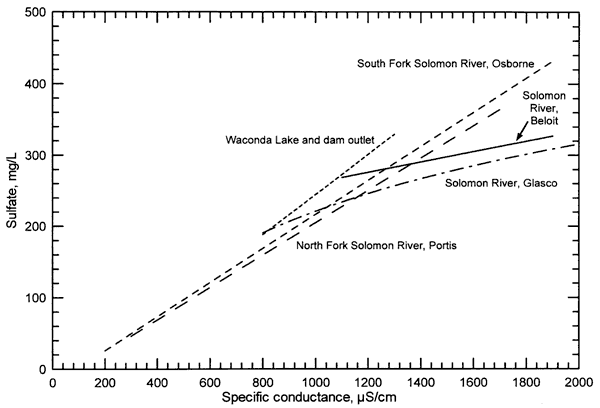
Figure 25 is a summary plot for sulfate concentration and specific conductance relationships. The linear regressions for the North and South forks of the Solomon River are nearly the same. As for the chloride-conductance relationships, the sulfate-conductance line for Waconda Lake and dam outlet water is at a greater sulfate content for the same conductance value for the North and South forks of the river. Again, much of the shift is probably related to the impact of lake evaporation and concomitant chemical changes in the lake water. The best-fit lines for the Solomon River at Beloit and near Glasco have lower slopes and are shifted to smaller sulfate concentrations for given conductance values, reflecting the saline ground-water intrusion that adds much more chloride than sulfate to the river water. The curve for the river near Glasco lies below that for the river at Beloit, consistent with the opposite relationship for the chloride-conductance lines for these locations. The line for the South Fork Solomon River below Osborne better estimates sulfate concentrations at low conductance for the Solomon River near Glasco. Thus, the curve for the Solomon River near Glasco is terminated at 800 μS/cm.
Figure 25. Summary of sulfate concentration and specific conductance relationships for the Solomon River and Waconda Lake in the study area. The lines are the same as those in Figures 19-22.
Relationship between Flow and Dissolved Constituents
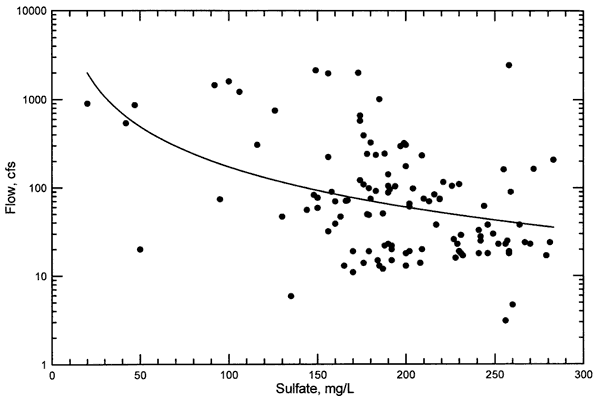
The chloride and sulfate concentrations in the Solomon River below Glen Elder are inversely related to the flow (Figures 26 and 27). There are limited recent data for this station. Thus, data extending back to 1981 were used for the plots. There is substantial scatter in the point distributions about the best-fit power curves in both graphs. This reflects the large chemical differences in the range of mixtures of water derived from Waconda Lake releases, runoff entering below the dam, and ground-water discharge. The graphs indicate that estimates of chloride and sulfate concentrations based on Solomon River flow below Glen Elder could have substantial error; estimates of sulfate content would generally have more error than of chloride content.
Figure 26. Flow versus chloride concentration for the Solomon River below Glen Elder Dam for 1981-1998 based on USGS and KDHE data. All but three of the values are for 1981-1989. The curve is a power function fit to the data.
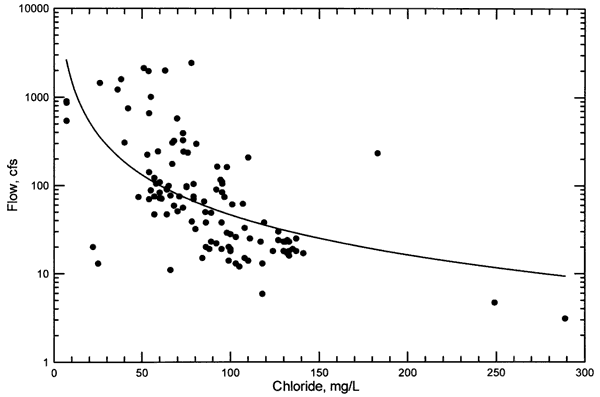
Figure 27. Flow versus sulfate concentration for the Solomon River below Glen Elder Dam for 1981-1998 based on USGS and KDHE data. All but three of the values are for 1981-1989. The curve is a power function fit to the data.
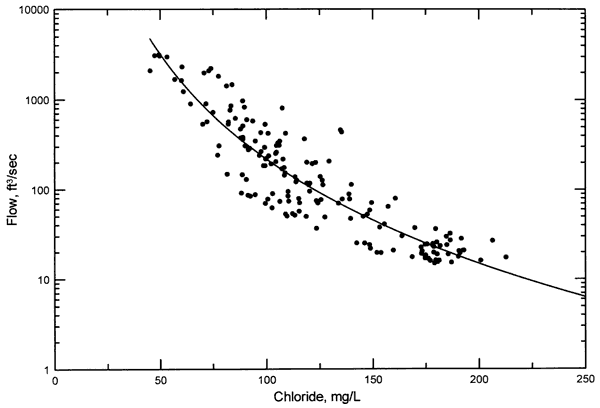
The points in a graph of mean daily flow in the Solomon River below Glen Elder Dam versus daily chloride concentration measured at the Beloit water plant (adjusted downward to correct for error) are also widely scattered (Figure 28). The flow values in the graph are for the previous day at the gaging station to reflect the approximate flow time between the gage and Beloit. Figure 29 shows the mean monthly flow at the gaging station below Glen Elder Dam versus the mean monthly chloride content (adjusted values) of the river water at Beloit. The scatter of points about the best-fit power curve is much less than that for the daily values. However, estimates of chloride concentration from flow using this plot could also have appreciable error. For example, at a low flow of 20 ft3/sec the chloride estimate could range from about 150 to 210 mg/L. The power curve in Figure 29 extends to the recommended secondary limit for chloride content in drinking water. The estimated flow predicted from the curve at a chloride value of 250 mg/L is 6-7 ft3/sec. This estimate is consistent with the very low flows of the river for the measurements in the historic USGS and KDHE record for the Solomon River below Glen Elder Dam and at Beloit that exceeded 250 mg/L chloride as discussed earlier. The data suggest that Waconda Lake releases of as low as several ft3/sec would have a substantial influence in preventing chloride concentrations from exceeding 250 mg/L in the Solomon River at Beloit during very dry periods.
Figure 28. Mean daily flow of the Solomon River below Glen Elder Dam shifted by one day versus adjusted daily chloride concentration at the Beloit water plant for 1988-2003. The curve is a power function fit to the data.
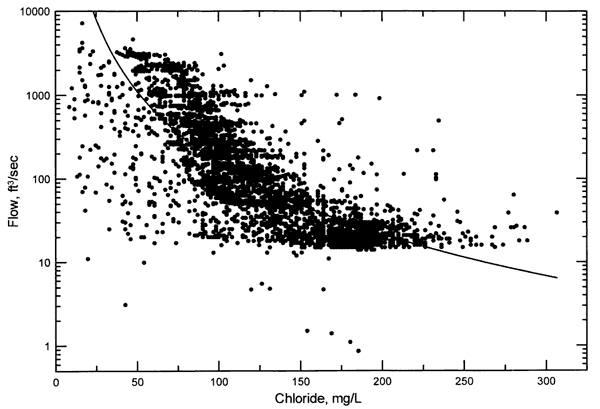
Figure 29. Mean monthly flow of the Solomon River below Glen Elder Dam versus adjusted, mean monthly chloride concentration at the Beloit water plant for 1988-2003. The curve is a power function fit to the data.
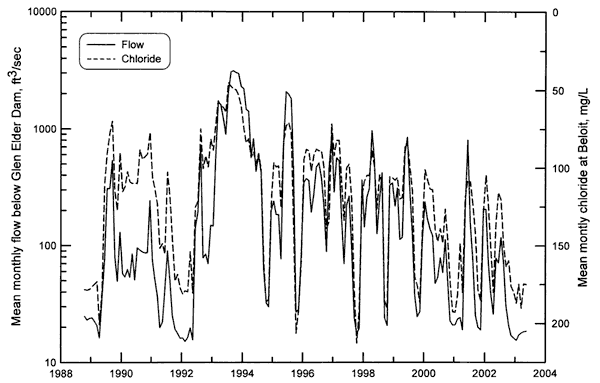
Even though there is substantial variation in the relationship between mean monthly flow of the river below Glen Elder Dam and the mean monthly chloride concentration at Beloit, the relative change in chloride values tracks fluctuations in flow well (Figure 30). If the chloride axis is inverted, the relative changes appear in the same direction on the graph and are easier to track (Figure 31). The figure illustrates that there are periods when the chloride concentration is greater for similar flows than at other times. For example, the chloride fluctuations are relatively well superimposed on the flow variations from 1993 to the present, whereas the chloride values during 1988-1992 are relatively lower for similar flows during 1993 to the present. An important feature of the graph is it shows that the high chloride concentrations can occur during relatively short periods of low flow (as short as two months) as well as during longer intervals of several or more months. This verifies that substantial reduction or termination of outflow releases from Waconda Lake can have a substantial impact in the development of high chloride contents in the river at Beloit during dry periods.
Figure 30. Mean monthly flow of the Solomon River below Glen Elder Dam and adjusted, mean monthly chloride concentration at the Beloit water plant during 1988-2003. A larger version of this figure is available.
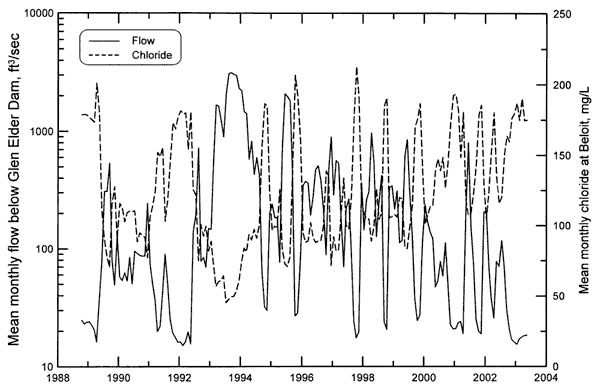
Figure 31. Mean monthly flow of the Solomon River below Glen Elder Dam and adjusted, mean monthly chloride concentration (inverted axis) at the Beloit water plant during 1988-2003. A larger version of this figure is available.
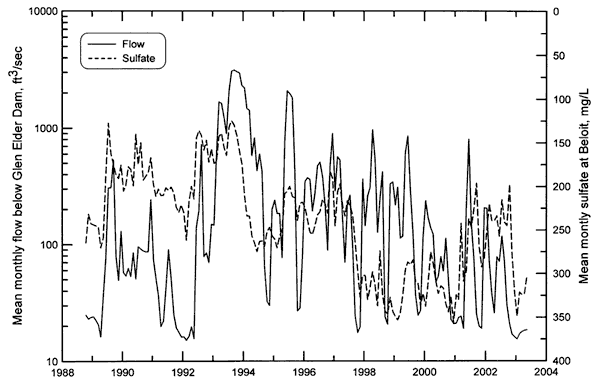
The point scatter is so great in a plot of flow of the Solomon River below Glen Elder Dam versus sulfate concentration of the river measured at the Beloit water plant (Figure 32) that estimation of sulfate from flow values is not possible. A graph of the mean monthly flow and sulfate content (Figure 33) defines the relationship somewhat better but still not enough for estimation of sulfate values from flow to be much more than random. Figure 34 is a plot of the mean monthly flow and sulfate concentration with time with the sulfate axis inverted as in Figure 31 for chloride. Comparison of Figures 31 and 34 shows that the mean monthly sulfate content does not inversely track changes in flow as well as does chloride concentration. The most probable explanation is that the sulfate content of Waconda Lake water is relatively high. Thus, large flow releases from the lake would result in relatively high sulfate concentrations in the Solomon River downstream at Beloit in contrast to the low sulfate values expected if the high flows resulted from rainfall runoff in the watershed below the dam.
Figure 32. Mean daily flow of the Solomon River below Glen Elder Dam shifted by one day versus adjusted daily sulfate concentration at the Beloit water plant for 1988-2003. The curve is a power function fit to the data.
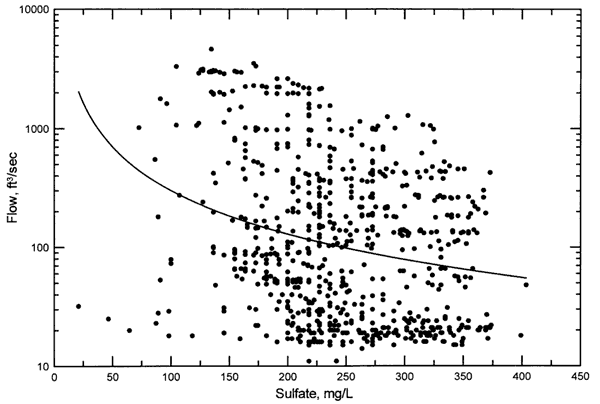
Figure 33. Mean monthly flow of the Solomon River below Glen Elder Dam versus adjusted, mean monthly sulfate concentration at the Beloit water plant for 1988-2003. The curve is a power function fit to the data.
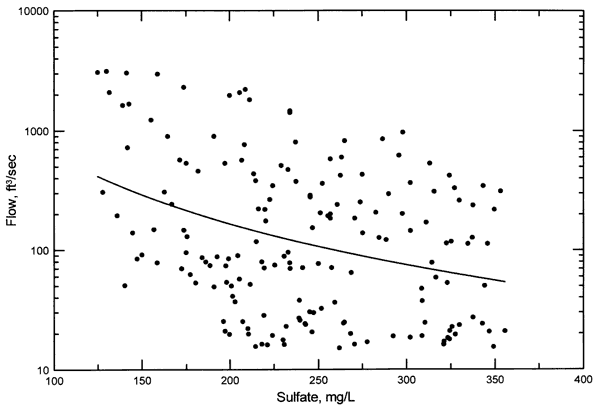
Figure 34. Mean monthly flow of the Solomon River below Glen Elder Dam and adjusted, mean monthly sulfate concentration (inverted axis) at the Beloit water plant during 1988-2003. A larger version of this figure is available.
Prev Page--Water-Quality Data || Next Page--Waconda Flow Releases
Kansas Geological Survey, Geohydrology
Comments to webadmin@kgs.ku.edu
Placed online Jan. 18, 2006
URL=http://www.kgs.ku.edu/Hydro/Publications/2003/OFR03_49/04_analysis.html