Kansas Geological Survey, Irrigation Series 4, originally published in 1978
Originally published in 1978 as Kansas Geological Survey Irrigation Series 4. This publication is also available as an Acrobat PDF file (1.1 MB). The plates are available separately.
A dependable supply of suitable quality ground water is an increasingly important factor in the economic growth of the Great Bend Prairie area. The principal source of water for all uses is from unconsolidated alluvial deposits that underlie most of the area. Therefore, it is important to evaluate the quantity and quality of water available, the effects of existing development, and the possible effects of future development.
It is estimated that 45 million acre-feet of ground water are in storage in the unconsolidated deposits. However, only about 60 percent of this water may be usable because of insufficient saturated thickness or excessively high mineralization in local areas.
From 1940 to 1974, the number of irrigation wells increased from 50 to 1,160 and the annual groundwater withdrawals increased from about 5,000 acre-feet to 140,000 acre-feet. This rapidly increasing withdrawal rate, however, has not produced long-term water-level declines that are distinguishable from the normal effects of climatic changes. Significantly increased future development for irrigation could result in water-level declines in some areas.
The chemical quality of ground water in the western half of the area generally is suitable for most uses. In the eastern half of the area, the quality may be unsuitable locally as a result of upward leakage of highly mineralized water from underlying Permian rocks.
A continuing program of monitoring changes in water levels and water quality is needed for assessing future problems and planning appropriate management.
Unconsolidated deposits of Pliocene and Pleistocene age comprise the principal aquifer in the Great Bend Prairie. Forty-five million acre-feet of ground water are estimated to be in storage in these deposits. Only about 60 percent of this amount may be usable owing to an insufficient saturated thickness and to high mineralization of water locally. Yields to irrigation wells are commonly between 500 and 1,000 gallons per minute, and yields of as much as 2,000 gallons per minute may be available in localities where the saturated thickness is greater than 100 feet.
In 1940, there were about 30 municipal and industrial wells and 50 irrigation wells in the area. In 1973, there were about 200 municipal and industrial wells and 950 irrigation wells; and in 1974, about 1,160 irrigation wells. Annual withdrawals of ground water by wells increased from about 5,000 acre-feet in 1940 to about 140,000 acre-feet in 1974. The steadily increasing withdrawal rate has not produced long-term declines of water levels that may be distinguished from the effects of climatic changes. Significant additional development for irrigation that could cause ground-water withdrawal to exceed longterm recharge and result in water-level declines is anticipated in some areas. The average annual recharge rate to ground water from precipitation is estimated to be about 2 inches.
The chemical quality of ground water from unconsolidated deposits in the western half of the area is generally suitable for most uses. The chemical quality of water in the eastern half may be unsuitable locally for most purposes as a result of upward leakage of highly mineralized water from underlying Permian rocks.
Locally, wells in rocks of Early Permian or Early Cretaceous age may yield from about 10 to 100 gallons per minute. However, the water from these wells generally contains more than 1,000 milligrams per liter of dissolved solids and more than 500 milligrams per liter of chloride and sulfate.
The purpose of this study was to combine data from previous studies and other records with current information obtained in the area, to evaluate the ground-water resources of the area with respect to future development, and to make recommendations as to the needs for future studies. This study began in 1972 as part of a cooperative program of ground-water investigations between the Kansas Geological Survey and the U.S. Geological Survey. Support for the study was provided by the Division of Water Resources of the Kansas State Board of Agriculture and the Division of Environment of the Kansas Department of Health and Environment.
Figure 1--Location of study area and system of numbering wells.
Compilation of data from previous reports and collection and analysis of records from the files of State agencies (principally the Division of Water Resources, Kansas State Board of Agriculture) and Federal agencies was done during the fall of 1972 and the winter of 1973-74. Field work was done during the summer and fall of 1973 and the spring and summer of 1974. The work consisted of (1) making an inventory of about 1,500 wells, (2) measuring the water level in a network of about 290 wells, (3) measuring the discharge and rate of fuel consumption for 53 randomly sampled irrigation wells, (4) collecting about 150 ground-water samples for chemical analysis, (5) determining the flow-duration curves of 20 small streams in the area, (6) analyzing about 2,000 logs of oil, gas, and water tests to prepare maps of the geology of the bedrock and the altitude and configuration of the bedrock surface, and (7) evaluating the hydrologic properties of the unconsolidated aquifer. The test drilling was done with auger and hydraulic rotary rigs operated by the Kansas Geological Survey. Chemical analyses of water samples were made by the Division of Environment of the Kansas Department of Health and Environment.
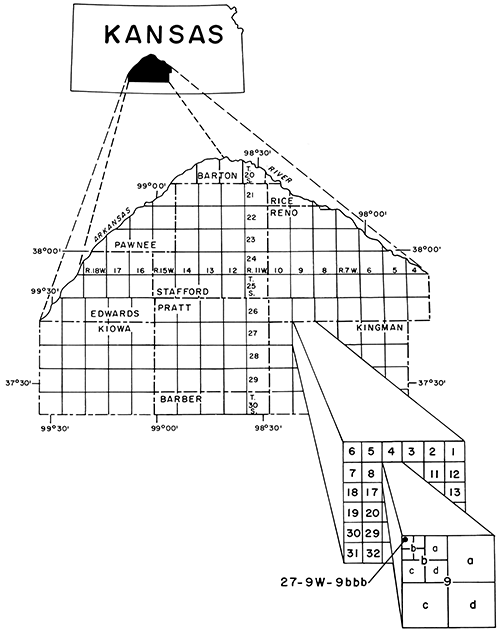
The well-numbering system used in this report gives the location of the well or test hole according to the Bureau of Land Management's system of land subdivision. In this system, the first set of digits of a well number indicates the township; the second set, the range east or west of the sixth principal meridian; and the third set, the section. The first letter after the section number denotes the quarter section or the 160-acre tract; the second, the quarter-quarter section or the 40-acre tract; and the third, the quarter-quarter-quarter section or the 10-acre tract. These tracts are designated a, b, c, and d in a counterclockwise direction beginning in the northeast quadrant. Where two or more wells are located in a 10-acre tract, wells are numbered serially, beginning with 2, according to the order ill which the wells were inventoried. Thus, in Kingman County, the number 27-9W-9bbb indicates that the well is in the NW NW NW sec. 9, T. 27 S., R. 9 W. (fig. 1).
For readers interested in the metric system, the English units of measurement given ill this report are listed below in equivalent metric units using the following abbreviations and conversion factors:
| English unit | Multiply by | Metric unit |
|---|---|---|
| Length | ||
| inches (in) | 2.54 | centimeters (cm) |
| feet (ft) | .3048 | meters (m) |
| miles (mi) | 1.609 | kilometers (km) |
| Area | ||
| acres | .4047 | square hectometers (hm2) |
| square miles (mi2) | 2.590 | square kilometers (km2) |
| Volume | ||
| gallons (gal) | 3.785 | liters (L) |
| cubic feet (ft3) | .02832 | cubic meters (m3) |
| acre-feet (acre-ft) | 1.233 x 10⁻³ | cubic hectometers (hm") |
| Flow | ||
| gallons per minute (gal/min) | .06309 | liters per second (L/s) |
| cubic feet per second (ft3/s) |
.02832 | cubic meters per second (m3/s) |
| Hydraulic conductivity | ||
| feet per day (ft/day) | .3048 | meters per day (m/day) |
| Transmissivity | ||
| feet squared per day (ft2/day) | .0929 | meters squared per day (m2/day) |
| Specific capacity | ||
| gallons per minute per foot [(gal/min)/ft)] | .207 | liters per second per meter [(L/s)/m)] |
| Gradient | ||
| foot per mile (ft/mi) | .1894 | meter per kilometer(m/km) |
The land surface of the report area is an undulating plain with little relief. The topography grades southward from sand dunes along the Arkansas River to a loess-covered upland that is terminated on the south and southeast by deeply eroded valleys. The land surface is poorly drained and traversed by relatively few streams. A typical example is the topographic basin of the prominent northeasterly flowing Rattlesnake Creek where 51 percent of the area contributes runoff to the stream and the remainder of the area has no external drainage. Modern agriculture is rapidly changing the land surface from its natural state as a prairie (grassland) to cropland .
A generalized columnar section of the geologic units and their water-bearing properties is given in table 1. Previous reports on the area have subdivided the Pleistocene deposits according to glacial and interglacial stages. Differentiation of unconsolidated deposits of Tertiary and Quaternary age in the subsurface of this area is difficult and is considered unnecessary for this study of ground water.
Table 1--Generalized columnar section of geologic units and their water-bearing properties.1
| System | Geologic unit |
Maximum thickness, in feet |
Physical character | Remarks |
|---|---|---|---|---|
| Quaternary | Undifferentiated Pleistocene deposits |
360 | Unconsolidated deposits of sand and gravel with interbedded lenses of clay, silt, and caliche. Windblown silt (loess) and dune sand occur at the surface over most of the area. Stream-laid deposits (alluvium) of late Quaternary age ranging from clay to gravel occur along the principal stream valleys. | Comprises principal aquifer. Water generally is of good chemical quality,2 but may be of poor chemical quality in the northeastern part of the area and in deep buried valleys in the southeastern part. Yields as much as 2,000 gal/min to wells. |
| Tertiary | Ogallala Formation (Pliocene deposits) |
65 | Unconsolidated deposits of silt and fine sand with interbedded caliche. Some interbedded sand and gravel. | |
| Cretaceous | Undifferentiated Lower Cretaceous rocks |
380 | Upper unit (Dakota Formation)--brown to gray fine- to medium-grained sandstone interbedded with gray sandy shale and varicolored shale. Middle unit (Kiowa Formation)--dark-gray to black shale interbedded with tan and gray sandstone. Lower unit (Cheyenne Sandstone)-gray and brown fine- to medium-grained sandstone interbedded with dark-gray shale. | Water probably of poor chemical quality. Yields 10 to 100 gal/min to wells locally in the western part of the area. |
| Permian | Undifferentiated Permian rocks |
350 | Interbedded reddish shale, siltstone, and sandstone with some beds of dolomite and anhydrite. Includes in descending order, Whitehorse Formation, Dog Creek Formation, Blaine Formation, and Flower-pot Shale. | Water generally of poor chemical quality. May yield as much as 10 gal/min to wells. |
| Cedar Hills Sandstone |
200 | Reddish shale, siltstone, silty shale, and sandstone. | Sandstone may contribute highly mineralized water to the principal aquifer where the two units are in contact. | |
| Salt Plain Formation |
300 | Reddish-brown sandy siltstone, and fine-grained sandstone. | May contribute highly mineralized water to the principal aquifer where the two units are in contact. | |
| Harper Sandstone | 250 | Brownish-red siltstone and silty shale with a few thin beds of silty sandstone. Kingman Sandstone Member is near the top of the formation. | Water may be of poor chemical quality. May yield no water or as much as 100 gal/min to wells in eastern part of area. | |
| Stone Corral Formation |
20 | White and light-gray anhydrite and dolomite. | Not known to yield significant amounts of water to wells in the area. | |
| Ninnescah Shale |
400 | Red and grayish-green shale, siltstone, and very fine grained silty sandstone. | May yield water of fair to poor chemical quality to wells in the outcrop areas. | |
| Wellington Formation |
550 | Calcareous gray and blue shale containing several thin beds of limestone, gypsum, and anhydrite. The Hutchinson Salt Member, when present, is near the middle of the formation. | Not known to yield significant amounts of water to wells. |
1 The classification and nomenclature of the rock units used in this report are those of the Kansas Geological Survey and differ somewhat from those of the U.S. Geological Survey.
2 Chemical quality of water is classed as good if the concentration of dissolved solids is less than 500 mg/L (milligrams per liter) or the concentrations of chloride and sulfate are less than 250 mg/L, fair if dissolved solids are 500 to 1,000 mg/L or chloride and sulfate are 250 to 500 mg/L, and poor if dissolved solids are greater than 1,000 mg/L or chloride and sulfate are greater than 500 mg/L.
The consolidated rocks that underlie the unconsolidated Tertiary and Quaternary deposits are referred to as bedrock. These rocks are not considered to be major aquifers in the area. [Note: Definitions of hydrologic terms used in this report are given in the glossary.] The bedrock units range in age from Permian to Cretaceous. The configuration of the buried bedrock surface and areas of subcropping bedrock units are shown on plate 1.
Rocks of Permian age underlie Early Cretaceous rocks in the western part of the area and underlie unconsolidated Tertiary and Quaternary deposits to form the bedrock surface in the eastern part. The Permian rocks crop out along the eastern and southern boundaries. Permian rocks, commonly called "red beds," consist of beds of red to brown shale, siltstone, and sandstone with minor beds of limestone, dolomite, and anhydrites.
Rocks of Early Cretaceous age underlie the unconsolidated Tertiary and Quaternary deposits to form the bedrock surface in the western part of the area and crop out along the southern boundary. These rocks consist of interbedded shales, sandy shales, and fineto coarse-grained sandstones. Of the three Cretaceous units (given in table 1), only the lower unit (Cheyenne Sandstone) may represent a potential source of water to large-capacity wells, but the water is believed to be highly mineralized.
The principal water-bearing materials underlying the Great Bend Prairie are the unconsolidated deposits of Tertiary and Quaternary age. These deposits reach a maximum thickness of 360 feet. They consist of clay, silt, sand, and gravel with some layers of loosely cemented sand and caliche. The lithology of most of the deposits suggests a Rocky Mountain origin and deposition by eastward-trending aggrading streams. The Arkansas River with its braided low-flow stream pattern represents such an aggrading stream. Eolian (windblown) deposition of materials derived from the flood plains of the streams occurs locally as a part of the unconsolidated deposits.
Climatic changes, principally in rainfall patterns, concomitant with glacial advances and retreats controlled erosion and sedimentation by the streams as they filled their channels and shifted laterally across the surface of the Great Bend Prairie. The great northward bend of the Arkansas River around the study area is the result of lateral migration and successive captures of a trunk stream by its own northern tributaries (Fent, 1950b).
The juxtaposition, dip, and subcrop locations of bedrock units pertinent to the hydrology of the area are illustrated on the generalized geologic map (pl. 1) and on the generalized geologic sections (pl. 2). Detailed descriptions of the geology of the area are given in reports by: Bayne (1956; 1960), Fent (1950a), Jewett (1964), Lane (1960), Latta (1948; 1950), Layton and Berry (1973), McLaughlin (1949), Merriam (1958), and Zeller (1968). The reader is referred to these reports for additional information.
[Note: Unless otherwise noted, the discussion in this report relates only to ground water in the unconsolidated deposits.]
The general relationship between precipitation and fluctuations in the potentiometric surface is indicated by hydrographs of water levels in wells. Figure 2 relates the annual precipitation at Pratt, Kansas to water-level hydrographs of selected wells in the area. These hydrographs show the depths to water below land surface, the long-term effects of climatic fluctuations on ground-water levels, and the short-term effects of pumpage at representative locations within the area.
Figure 2--Annual precipitation at Pratt and hydrographs of selected wells.
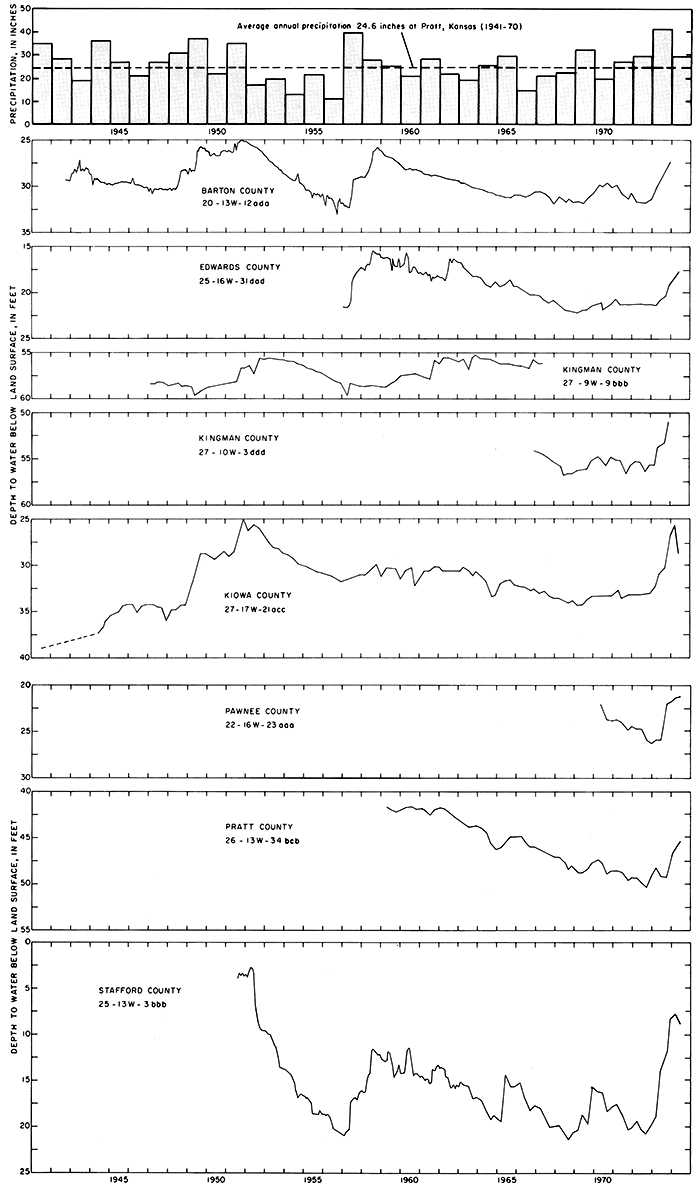
The water level in a Kiowa County observation well (27-17W-21acc) was lower in 1941 than at any time from 1942-74. This low water level probably reflected the previous 8 out of 9 years of below-normal precipitation during 1931-39 not shown. The water level in the same well rose to record and near-record heights during 1951 in response to a 10-year cycle of above-normal precipitation during 1940-49. Irrigation development was not a significant factor in the Great Bend Prairie prior to 1965; therefore, water-level declines prior to that date must be attributed to other causes.
The hydrograph of water levels in the Stafford County observation well (25-13W-3bbb) shows a series of rapid increases and less-rapid declines in water levels. The decline from 1952-57 occurred prior to significant irrigation development and shows how rapidly the aquifer is able to discharge stored water when precipitation is below normal. In general, the Stafford County hydrograph follows the trend of a 2-year running-average deviation from the mean annual precipitation.
Response to precipitation is more evident in those wells with shallow water levels (Stafford County hydrograph) than in those with deeper water levels (Barton County, 20-13W-12ada and Kiowa County, 27-17W-21acc). The long-term water-level records indicate that the natural response of the ground-water reservoir to "wet" and "dry" cycles is of sufficient magnitude that long-term response to withdrawals for irrigation may not be distinguishable.
Water levels during 1952-71 trended generally downward throughout the area. The average annual precipitation at Pratt, Kansas during 1952-71 was 2.1 inches less than the 1941-70 annual average of 24.6 inches. The downward trend in water levels was reversed by above-normal precipitation during 1972-74. The average annual precipitation during 1972-74 was 8.5 inches above the 1941-70 annual average at Pratt. Shorter periods of above-normal precipitation (1957- 59, 1964-65, and 1969) show on most of the hydrographs as smaller water-level rises.
The altitude and configuration of the potentiometric surface of ground water and the saturated thickness in the unconsolidated deposits of the Great Bend Prairie in December 1973 are shown on plates 3 and 4, respectively. Owing to appreciable recharge from the above-normal precipitation in 1973, the potentiometric surface in December 1973 probably was higher than can be expected in most future years of near- and below-normal precipitation. The December 1973 potentiometric surface represents a uniform time base for water levels in the area that may be compared with past records and with information collected in the future. Prior simultaneous water-level measurements with enough areal density for mapping ranged from those made in 1941 for the Kiowa County report (Latta, 1948) to those made in 1964 for the Pratt County report (Layton and Berry, 1973).
The direction of ground-water flow generally is eastward throughout most of the area, although some water flows northward toward the Arkansas River at the northwest part of the area and southward to the Medicine Lodge and Chikaskia Rivers. Flow is downgradient in a direction perpendicular to the waterlevel contours. Upstream flexures in the contours indicate that ground water flows toward the Arkansas River along most of its length on the north boundary of the study area. It also flows to parts of the interarea streams: i.e. Rattlesnake Creek northeast of St. John in Stafford County, North Fork Ninnescah River east of Sylvia in Reno County, and South Fork Ninnescah River east of Pratt in Pratt and Kingman Counties.
The widely spaced contours in the Lewis area of Edwards County indicate a gentle gradient and a high transmissivity in the aquifer. The closely spaced contours northeast of Pratt in Pratt County indicate an area of relatively low transmissivity where a steep gradient is required for the ground water to move through the aquifer.
The quantity of water that an aquifer will yield to wells depends on the hydrologic properties of the aquifer material. Those properties are the capability of an aquifer to transmit and store water and are called transmissivity and storage coefficient, respectively.
Five aquifer tests were analyzed. using the standard formulas outlined by Wenzel (1942), Bentall (1963), Ferris and others (1962), and Stallman (1971). Transmissivity values from these tests ranged from about 7,000 to 16,000 ft2/day. Transmissivity values estimated from specific capacities furnished by drillers and well owners of 235 irrigation wells ranged from about 2,500 to 35,000 ft2/day and averaged 11,000 ft2/day.
The storage coefficients, which are dimensionless, determined from the five aquifer tests ranged from 0.0004 to 0.17. Generally, coefficients of less than 0.001 indicate confined ground water; coefficients ranging from 0.001 to 0.05 indicate semiconfined ground water (Ferris and others, 1962); and coefficients greater than 0.05 indicate unconfined ground water. Confined conditions generally do not persist spatially or temporally in unconsolidated aquifers of this area due to the localized nature of confining beds and will change to unconfined conditions when water levels drop below those confining beds. Meyer and others (1970) found the long-term values of the coefficient of storage to be 0.14 to 0.22 in similar deposits in Finney County. Jones and Schneider (1969) found the specific yield (comparable to storage coefficient for values greater than 0.05) to range from 0.13 to 0.28 in the Ogallala Formation near Bushland, Texas. A storage coefficient of 0.15 is believed to be representative of the unconsolidated deposits in the Great Bend Prairie area.
Geophysical logs for about 1,000 oil and gas test wells and about 1,000 drillers' logs for wells distributed throughout the area were examined to determine the lithology near the position of the potentiometric surface, which indicates whether water in the aquifer is likely to be confined, semiconfined, or unconfined. The lithologic character of the aquifer for a 25-foot interval immediately below the potentiometric surface of December 1973 also was examined to allow for moderate water-level declines. Ground water in the area generally appeared to be unconfined, except for a few small areas where water was considered confined or semiconfined.
In December 1973 about 45 million acre-feet of ground water were estimated to be in storage in the unconsolidated deposits. The saturated thickness of the aquifer (shown on plate 4) ranged from a few feet to 280 feet, averaging 125 feet. The estimated amount of water in storage is based on a storage coefficient of 0.15 and the volume of saturated material computed from plate 4. However, the deposits cannot be completely drained by wells, and not all of the water is of suitable chemical quality for most uses. Assuming (based on the discussion in the section on Chemical Quality of Water) that about 25 percent of the saturated portion of the aquifer contains water of unsuitable quality, about 34 million acre-feet of suitable quality of water is in storage. Of this amount, probably no more than 75 to 80 percent or 25 to 27 million acre-feet of water could be withdrawn by wells.
Ground water for domestic and stock supplies generally is available throughout the area either from the unconsolidated deposits or from the weathered zone in the bedrock outcrop areas. Ground water for irrigation is normally available only from the unconsolidated deposits. Where the saturated thickness is 50 to 100 feet, yields to wells commonly range from 500 to 1,000 gal/min. Where the saturated thickness is greater than 100 feet, yields to wells commonly range from 1,000 to 2,000 gal/min. However, test drilling is recommended to locate an adequate thickness of the most permeable saturated material before a large-capacity weII or well field is installed.
The natural recharge-discharge regimen in' the Great Bend Prairie is variable, as is evident from the hydrographs in figure 2. Rising water levels indicate that water is entering the ground-water reservoir (recharge) more rapidly than it is leaving (discharge); that is, water is being stored in the reservoir. Declining water levels indicate that water is leaving the reservoir more rapidly than it is entering. The hydrographs show that discharge has exceeded recharge the majority of the time since peak water levels were recorded in 1952. Although the withdrawal by wells has increased significantly since about 1966-69, the hydrographs do not show water-level declines distinguishable from the response to natural recharge-discharge conditions.
Recharge to the ground-water reservoir is principally by direct infiltration of precipitation on the land surface throughout the area plus underflow laterally from the west and leakage upward from the bedrock. Discharge from the ground-water reservoir is by seepage to streams, evapotranspiration, and withdrawals by wells.
The ground-water and surface-water drainage areas above streamflow-gaging stations on Rattlesnake Creek near Raymond (station no. 07142620), North Fork Ninnescah River near Arlington (station no. 07144700), low-flow record only, and South Fork Ninnescah near Murdock (station no. 07145200) are definable areas for which some data are available to estimate and compare some of the recharge-discharge rates in the Great Bend Prairie.
Average annual precipitation in the Great Bend Prairie ranges from 22.5 inches at the western border to 31.5 inches at the eastern border (U.S. Department of Commerce, 1973). Precipitation throughout the drainage areas above the gaging stations near Raymond, Arlington, and Murdock averages 25 inches annually. The combined surface-water drainage area above the three stations is about 2,460 square miles. Precipitation on the three drainage areas amounts to about 3.3 million acre-feet annually. Part of the precipitation moves as overland flow to the streams, part is evaporated from ponds and streams before leaving the area, a large part infiltrates the soil to be evaporated and transpired before reaching the water table, and a small part percolates to the ground-water reservoir.
Layton and Berry (1973) estimated ground-water recharge in Pratt County to be from 5 to 10 percent of the average annual precipitation with the higher percentage occurring in areas that are underlain by dune sand. Large variations of the recharge rate occur with time as evidenced by the hydrographs in figure 2. Periods of below-normal precipitation and low recharge rates are followed by periods of above-normal precipitation and high recharge rates. Recharge by precipitation to the ground-water drainage areas above the gaging stations at Raymond, Arlington, and Murdock is estimated to be about 2 inches per year. The ground-water drainage area above the three stations, estimated on the basis of the potentiometric surface map, December 1973, is about 2,280 square miles. An average annual recharge of 2 inches would add 240,000 acre-feet per year to the ground-water reservoir in these three areas.
The direction and rate of ground-water movement interpreted from the potentiometric surface (pl. 3) indicates that recharge to the area by underflow occurs only across the western Kiowa County line and is estimated to be 500 to 1,000 acre-ft/yr (acre-feet per year). The inflow from the bedrock is estimated to be 5,000 to 10,000 acre-ft/yr based on the assumptions that: the Cedar Hills Sandstone is the major contributor; the hydraulic gradient in the formation is virtually equal to and in the 'same direction as in the overlying unconsolidated deposits; and the hydraulic conductivity of the Cedar Hills Sandstone is about 25 feet per day.
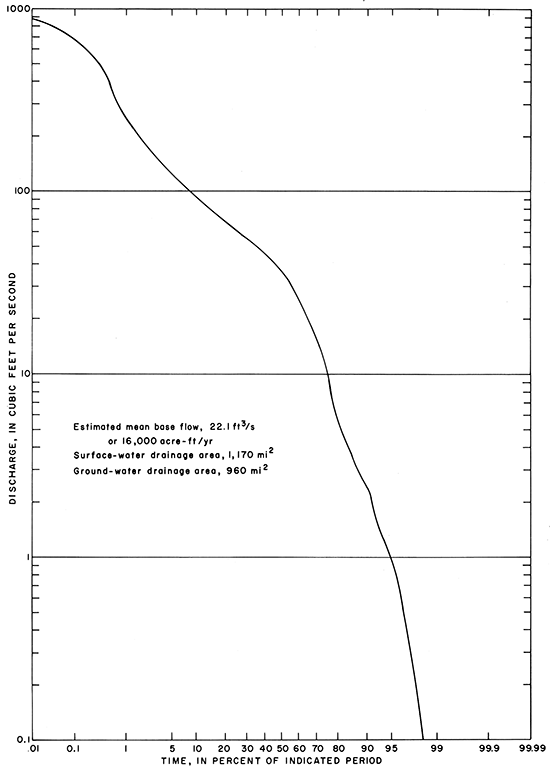
Discharge from the ground-water reservoir is by seepage to streams, evapotranspiration, and withdrawals by wells. A detailed study of streamflow hydrographs indicates that ground-water contributions to streams in the Great Bend Prairie are the amounts represented on the flow-duration curves between 20 and 100 percent of the time (Busby and Armentrout, 1965, and Paul R. Jordan, oral commun., March 1974). The curves shown in figures 3, 4, and 5 indicate a ground-water contribution of 68,000 acre-ft/yr for the South Fork Ninnescah River near Murdock, 27,500 acre-ft/yr for North Fork Ninnescah River near Arlington, and 16,000 acre-ft/yr for Rattlesnake Creek near Raymond. The combined ground-water contribution to streamflow at these stations is about 110,000 acre-ft/yr. which is equivalent to about 45 percent of the average annual recharge to the ground-water drainage area above the stations.
Figure 3--Flow-duration curve for South Fork Ninnescah River near Murdock, 1951-71.
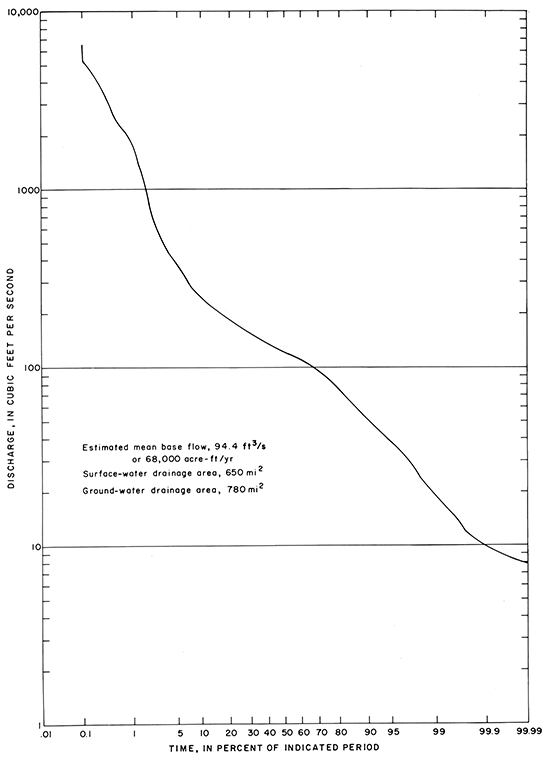
Figure 4--Synthetic flow-duration curve for North Fork Ninnescah River near Arlington.
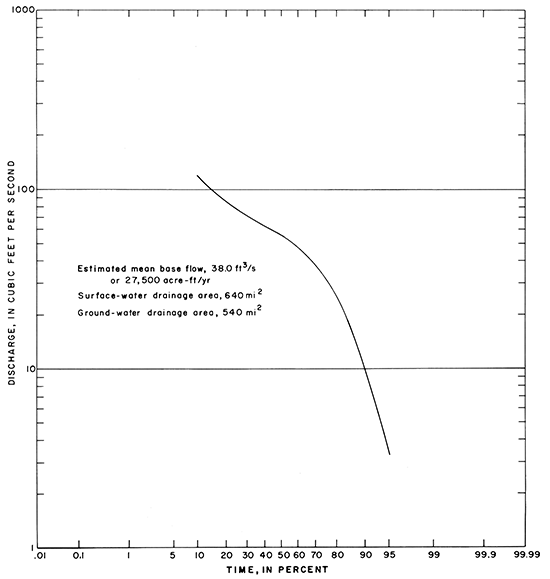
Figure 5--Flow-duration curve for Rattlesnake Creek near Raymond, 1960-7I.
If the amount of ground water stored in the aquifer fluctuates about a constant long-term mean (that is, every declining water-level trend is compensated by a rising water-level trend), then evapotranspiration from the ground-water reservoir may be considered equal to the total recharge to that reservoir minus the ground water discharged to streams or withdrawn by wells. In a broad sense, the aquifer in the Great Bend Prairie fits this pattern. Therefore, when withdrawals by wells are minimal, evapotranspiration from the ground-water reservoir above the gaging stations near Raymond, Arlington, and Murdock may approximately equal the annual recharge minus the ground water discharged to streams in that area. If it is assumed from preceding discussions that the annual recharge to ground water is 240,000 acre-feet and the annual ground-water discharge to streamflow above the three stations is 110,000 acre-feet, then average annual evapotranspiration from the aquifer is about 130,000 acre-feet or 55 percent of the recharge.
The average quantity of water withdrawn by wells from the ground-water reservoir in the Great Bend Prairie is increasing so that resulting values useful for water-budget purposes become misleading. In the section on annual withdrawals, it was estimated that 900,000 acre-feet of water was withdrawn by wells throughout the Great Bend Prairie during 1952-71. Sixty-two percent of the wells recorded in May 1974 were within the ground-water drainage area above the stations near Raymond, Arlington, and Murdock.
The amount of ground water in storage changes as the recharge-discharge relation changes. During 1952-71, most water levels throughout the Great Bend Prairie declined. The six observation wells in the Great Bend Prairie that have recorded water levels from this period show an average decline of 7.7 feet. However, the hydrographs in figure 2 show that much of this decline in stored water was recovered by 1974. The potentiometric surface map of the Great Bend Prairie, December 1973, provides a base for comparison of future water-level data so that changes in groundwater storage may be computed.
Water of suitable chemical quality for most uses generally is available to wells in the upper part of the aquifer in the unconsolidated deposits and in the lower part where the aquifer is underlain by the Lower Cretaceous rocks (pl. 1). Highly mineralized water from the Cedar Hills Sandstone moves eastward from the subcrop area into the aquifer in the basal part of the unconsolidated deposits. The highly mineralized ground water in Kingman, Pratt, and southern Stafford Counties is apparently limited to the deeper bedrock channels.
Concentrations of the major dissolved constituents in water from wells in the Great Bend Prairie are tabulated in the basic-data report (Stullken and Fader, 1976). Some concentrations exceed the limits recommended by the Kansas Department of Health and Environment for use in drinking water. These limits are as follows:
| Constituent | Recommended limits, in milligrams per liter |
|---|---|
| Dissolved solids | 500 |
| Iron (Fe) | .3 |
| Manganese (Mn) | .05 |
| Sulfate (SO4) | 250 |
| Chloride (Cl) | 250 |
| Fluoride (F) | 1.5 |
| Nitrate (NO3) | 45 |
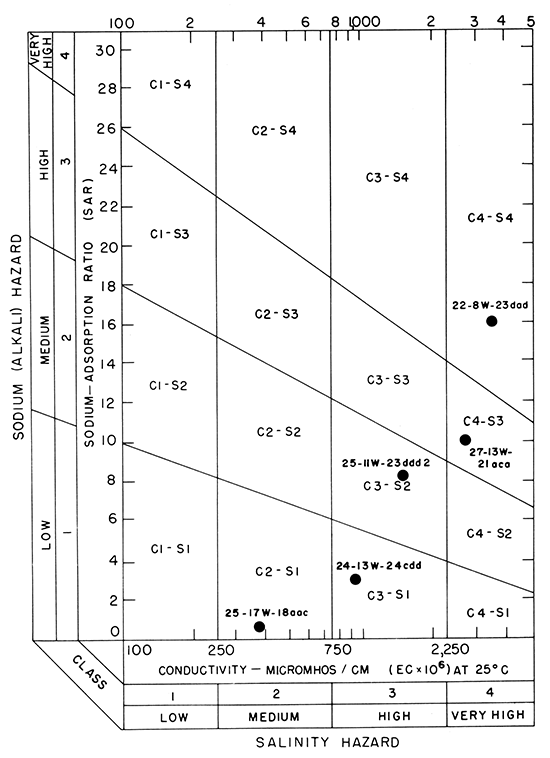
Figure 6--Classification of representative water samples showing suitability for irrigation.
For a discussion of the significance of chemical constituents in ground water of the Great Bend Prairie, the reader is referred to the reports by Latta (1948; 1950), McLaughlin (1949), Bayne (1956), Lane (1960), and Layton and Berry (1973).
The development and maintenance of successful irrigation requires controlling salinity and alkalinity of the soil as well as supplying water to the land. The chemical characteristics of water that are most important in evaluating its suitability for irrigation in the Great Bend Prairie are the total concentration of soluble salts expressed in terms of electrical conductivity and the relative proportion of sodium to other principal cations (expressed as a sodium-adsorption ratio). U.S. Department of Agriculture Handbook 60 (U.S. Salinity Laboratory Staff, 1954) classifies the suitability of water for irrigation by a comparison of these values on a diagram as shown in figure 6. The analyses of water from five selected wells are plotted in figure 6 and are considered representative of most ground water in the Great Bend Prairie.
The areal distribution of chemical suitability of ground water from the unconsolidated deposits for irrigation is shown on plate 5. In this map, water with a low sodium hazard and a low to high salinity hazard (see fig. 6) was considered suitable for irrigation. The map was prepared from analyses of water samples collected by the U.S. Geological Survey and reports of field analysis furnished by landowners, well-drilling contractors, and test-hole drilling compared with the configuration of bedrock map.
In general, ground water in the type "A" areas, about 65 percent of the total water in storage, is chemically suitable for irrigation. Small quantities of suitable quality water generally are available from wells that penetrate only the top part of the saturated zone in type "B" areas. Water contained in the type "B" areas amounts to 17 percent of the total water in storage. Because the lower part of the aquifer in type "B" areas may contain highly mineralized water, testing for suitable quality of water should precede the installation of an irrigation well. Clay layers, where present, may separate highly mineralized water in the lower part of the aquifer from water of suitable quality for irrigation in the upper part. An irrigation well screened only above the clay layer could produce water suitable for irrigation.
Ground water in the type "C" areas generally has a medium to very high sodium hazard and a high to very high salinity hazard. Water in these areas, which amounts to about 18 percent of the total aquifer storage, is unsuitable for irrigation. However, small quantities of water having low mineralization commonly are present in the upper few feet of the aquifer.
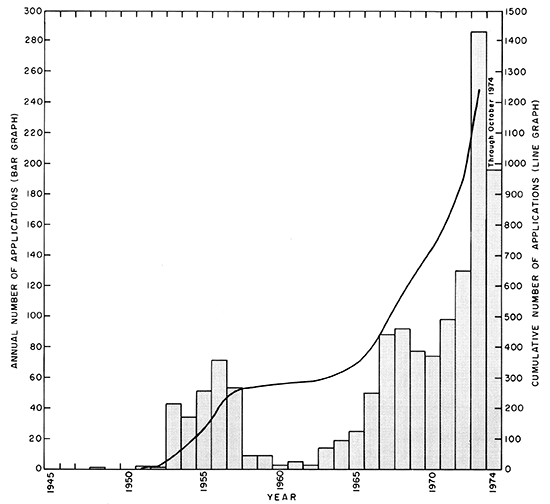
In the early 1940's, there were about 30 municipal and industrial and about 50 irrigation wells in the Great Bend Prairie. About 2,000 acres were irrigated. The majority of development since that time has been for irrigation, but development was sporadic until 1973. The number of applications to appropriate ground water for irrigation (fig. 7) indicate the growth rate of irrigation in the area. According to records of the Division of Water Resources, Kansas State Board of Agriculture, 1,230 applications to appropriate ground water had been filed by 1973. However, a field inventory indicated only 200 municipal and industrial wells and 950 irrigation wells installed and in operation. In 1974, about 1,160 irrigation wells were in operation (see pl. 4) and about 150,000 acres of land were under irrigation.
Figure 7--History of development as shown by number of applications to appropriate ground water for irrigation (Division of Water Resources, Kansas State Board of Agriculture).
The rapid expansion of irrigation during 1973-74 was the result of technological advances, fortuitous economic circumstances, plentiful ground water, and promotional and educational activities carried on throughout the area by industrial and governmental groups. Much land that previously was considered too rough or too sandy to be irrigated by former methods is now being irrigated with center-pivot sprinkling systems. Most of the rapid expansion in irrigation has resulted from efforts to produce feed crops suitable to the needs of the local cattle industry.
Total annual withdrawals of ground water increased from about 5,000 acre-feet in the early 1940's to about 140,000 acre-feet in 1974. Municipal and industrial uses comprised about 60 percent or 3,000 acre-feet of the ground water withdrawn annually by wells during the early 1940's, but comprised only 14 percent or 20,000 acre-feet of the 1974 withdrawal. Records of precipitation, applications to appropriate ground water, and estimated withdrawal data indicated that the amount of ground water withdrawn for irrigation has increased linearly from less than 1,000 acre-ft/yr in 1952 to an estimated 50,000 acre-ft/yr in 1969.
Discharge measurements were made during the 1974 irrigation season to estimate annual withdrawals for irrigation. Fifty-three wells were selected randomly from the 1,160 irrigation wells in the area. Measurements of discharge, pump speed, rate of fuel use, total fuel use, and hour-meter readings were obtained at each well during several visits throughout the irrigation season.
Withdrawals by the sampled wells ranged from zero (for 5 wells) to 366 acre-ft/yr, and the resulting mean (including the zero withdrawal wells) was 106 acre-feet of water pumped per well. Multiplying by the 1,160 wells gives an estimate of 120,000 acre-feet of ground water pumped for irrigation in 1974.
A statistical analysis of the data indicated a 70 percent chance that the computed mean annual pumpage per well was within 15 percent of the true value. If the random samples were increased to 100 wells, there would be a 90 percent chance that the mean would be within 15 percent of the true value.
The annual withdrawals for irrigation during 1952- 71 were estimated by multiplying an application rate proportional to the annual rainfall times the average irrigated acreage found in the random sample, times the estimated number of wells each year. The number of wells in operation was determined using the cumulative number of applications to appropriate water, adjusted by the ratio of operating wells in the 1974 well inventory. The average for industrial and municipal withdrawals for the period was estimated from reported water-use records. The total 1952-71 withdrawal for all uses was estimated to be 900,000 acre-feet, of which 680,000 acre-feet was for irrigation and 220,000 acre-feet was for municipal and industrial use.
Little or no permanent depletion of storage in the aquifer has occurred, except in Pratt County where effects of pumping may be reflected in the hydrographs. Seasonal pumping has caused declines of water levels of as much as 7 feet in some observation wells, but water levels have recovered to near the previous levels by the following spring.
Water of poor chemical quality reportedly has moved into a few wells owing to intensive pumping. This problem commonly has been resolved by plugging the lower parts of the wells or drilling new wells to shallower depths.
Only about 60 percent of the 45 million acre-feet of ground water estimated to be in storage may be considered usable. Some water is not available because the aquifer cannot be completely drained by wells, and some water is chemically unsuitable for most uses.
A practical method to evaluate the future availability of water is to postulate that areas of about township size are a unit and that there is no gain or loss by underRow into or out of the unit areas. Therefore, the only significant inflow to each unit would be recharge from precipitation, which is assumed to be 2 inches or an average of about 3,840 acre-ft/yr in a township area. It is further assumed that the specific yield of the aquifer is 0.15 and that any water pumped in excess of 3,840 acre-ft/yr would be removed from storage. Therefore, if 1 acre-foot/acre or 23,040 acre-feet in the township is pumped per year and no water returns to the aquifer, the average net waterlevel decline would be 5.6 feet per year. If 11,520 acre-feet were pumped to irrigate one-half of the land in the township, the average net decline would be about 2.2 feet per year. Because recharge may be more or less than the annual average, the net decline of water level in the area subject to the above conditions could be more than the estimated value in some years and less in others. The expected waterlevel decline in any given area of the Great Bend Prairie underlain by the aquifer in the unconsolidated deposits can be estimated by the above method using an assumed or projected program of pumpage.
In an area where 1 acre-foot/acre of water is applied annually for irrigation within a township, water levels would decline about 56 feet in a 10-year period. If the initial saturated thickness of the aquifer at a well site in the township area is more than 90 feet, the water from storage would be available for more than 10 years. If the initial saturated thickness is less than 60 feet, the economic life of the well probably would be less than 10 years because the reduced thickness of saturated deposits would not allow the water-level drawdown to develop a gradient sufficient to transmit an adequate quantity of water to the well during pumping.
It has not been possible to compare the accuracy of these projected drawdowns with observed drawdowns. The largest annual withdrawal from anyone township occurred in 1974 when an estimated 7,700 acre-feet was pumped. However, annual recharge in 1973 and 1974 was higher than the average 3,840 acre-feet; therefore, less than one-half of the withdrawal would be reflected in a reduction of storage. As development continues, significant water-level declines and the resultant loss of some vegetation, streamflow, and yields from shallow wells can be expected.
The availability of usable ground water for irrigation also is affected by chemical quality. In the "A" and "B" areas of plate 5, a large amount of water is available for irrigation development. However, water that is chemically unsuited for most uses may move toward areas of chemically suitable water as a result of long-term pumping by wells in the "B" areas. Ground water in the "C" areas should be considered unusable for future development unless some inexpensive method is found to reduce the sodium and salinity hazard.
Bayne, C. K., 1956, Geology and ground-water resources of Reno County, Kansas: Kansas Geol. Survey, Bull. 120, 130 p. [available online]
Bayne, C. K., 1960, Geology and ground-water resources of Harper County, Kansas: Kansas Geol. Survey, Bull. 143, 183 p. [available online]
Bayne, C. K., and Ward, J. R., 1967, General availability of ground water in Kansas: Kansas Geol. Survey, Map M-4.
Bayne, C. K., and Ward, J. R., 1969, Saturated thickness and specific (water) yield of Cenozoic deposits in Kansas: Kansas Geol. Survey, Map M-5.
Bentall, Ray, ed., 1963, Methods of determining permeability, transmissibility, and drawdown: U.S. Geol. Survey, Water-Supply Paper 1536-1, p. 243-341. [available online]
Blaney, H. F., 1957, Relationship of pan evaporation to evapotranspiration by phreatophytes and hydrophytes: Phreatophyte Subcommittee of Pacific Southwest InterAgency Committee, Symposium on phreatophytes, Sacramento, Calif., Feb. 14-15, p. 1-52.
Broeker, M. E., and McNellis, J. M., 1973, Ground-water levels in observation wells in Kansas, 1966-70: Kansas Geol. Survey, Basic Data Series, Ground-Water Release No. 3. 373 p.
Broeker, M. E., and Winslow, J. D., 1966, Ground-water levels in observation wells in Kansas, 1965: Kansas Geol. Survey, Bull. 184, 92 p.
Busby, M. W., and Armentrout, C. W., 1965, Kansas streamflow characteristics, base flow data: Kansas Water Resources Board, Tech. Rept. No. 6A, 207 p.
Fader, S. W., and Morton, R. B., 1975, Ground water in the Middle Arkansas River basin, Kansas and Oklahoma: U.S. Geol. Survey, Open-File Report 75-367,44 p. [available online]
Fent, O. S., 1950a, Geology and ground-water resources of Rice County, Kansas: Kansas Geol. Survey, Bull. 85, 142 p. [available online]
Fent, O. S., 1950b, Pleistocene drainage history of central Kansas: Kansas Acad. Sci. Trans., v. 53, no. 1, p. 81-90.
Ferris, J. C., Knowles, D. B., Brown, R. H., and Stallman, R. W., 1962, Theory of aquifer tests: U.S. Geol. Survey, Water-Supply Paper 1536-E, p. 69-174. [available online]
Furness, L. W., 1959, Kansas streamflow characteristics, flow duration: Kansas Water Resources Board Tech. Rept. No.1, 213 p.
Gutentag, E. D., and Stullken, L. E., 1976, Ground-water resources of Lane and Scott Counties, western Kansas: Kansas Geol. Survey, Irrigation Series No. 1, 37 p. [available online]
Jewett, J. M., 1964, Geologic map of Kansas: Kansas Geol. Survey, Map M-1.
Jones, O. R., and Schneider, A. D., 1969, Determining specific yield of the Ogallala aquifer by the neutron method: Water Resources Research, v. 5, no. 6, p. 1267-1272.
Kansas Water Resources Board, 1960, Preliminary appraisal of Kansas water problems, sec. 4, Lower Arkansas Unit: Kansas Water Resources Board, State Water Plan Studies, pt. A, 177 p.
Kansas Water Resources Board, 1967, Irrigation in Kansas: Planning for development, '701' Project No. Kans. P-43, Rept. No. 16(e), 233 p.
Lane, C. W., 1960, Geology and ground-water resources of Kingman County, Kansas: Kansas Geol. Survey, Bull. 144, 173 p. [available online]
Latta, B. F., 1948, Geology and ground-water resources of Kiowa County, Kansas: Kansas Geol. Survey, Bull. 65, 151 p. [available online]
Latta, B. F., 1950, Geology and ground-water resources of Barton and Stafford Counties, Kansas: Kansas Geol. Survey, Bull. 88, 228 p. [available online]
Layton, D. W., and Berry, D. W., 1973, Geology and groundwater resources of Pratt County, south-central Kansas: Kansas Geol. Survey, Bull. 205, 33 p. [available online]
McLaughlin, T. C., 1949, Geology and ground-water resources of Pawnee and Edwards Counties, Kansas: Kansas Geol. Survey, Bull. 80, 189 p. [available online]
Merriam, D. F., 1958, Preliminary regional structural contour map on top of the Stone Corral Formation (Permian) in Kansas: Kansas Geol. Survey, Oil and Gas Inv. No. 17, 1 pl.
Meyer, W. R., Gutentag, E. D., and Lobmeyer, D. H., 1970, Geohydrology of Finney County, southwestern Kansas: U.S. Geol. Survey, Water-Supply Paper 1891, 117 p. [available online]
Murray, C. R., 1968, Estimated use of water in the United States, 1965: U.S. Geol. Survey, Circ. 556, 53 p. [available online]
Stallman, R. W., 1971, Aquifer-test design, observation and data analysis: U.S. Geol. Survey, Techniques. Water-Resources Inv., Application of Hydraulics, book 3, Ch. B-1, 26 p.
Stullken, L. E., and Fader, S. W., 1976, Hydrogeologic data from the Great Bend Prairie, south-central Kansas: Kansas Geol. Survey, Basic Data Series, Ground-Water Release No. 5, 50 p.
U.S. Department of Commerce, 1973, Monthly normals of temperature, precipitation, and heating and cooling degree days 1941-70: Climatography of the United States No. 81-Kansas, 14 p.
U.S. Federal Water Pollution Control Administration, 1968, Water quality criteria: Report of the National Technical Advisory Committee to the Secretary of the Interior, 234 p.
U.S. Geological Survey, 1969, Surface water supply of the United States, 1961-65--Part 7, Lower Mississippi River basin--Volume 2, Arkansas River basin: U.S. Geol. Survey, Water-Supply Paper 1921, 878 p.
U.S. Geological Survey, 1975, Water resources data for Kansas--Part 1, Surface water records, 1974: U.S. Geol. Survey, Lawrence, Kans., 202 p.
U.S. Salinity Laboratory Staff, 1954, Diagnosis and improvement of saline and alkali soils: U.S. Dept. Agriculture, Agriculture Handb. 60. 160 p.
Wenzel, L. K., 1942, Methods of determining permeability of water-bearing materials, with special reference to discharging-well methods, with a section on direct laboratory methods and bibliography on permeability and laminar flow by V. C. Fishel: U.S. Geol. Survey, Water-Supply Paper 887, 192 p.
Zeller, D. E., ed., 1968, The stratigraphic succession in Kansas: Kansas Geol. Survey, Bull. 189, 81 p.
Acre-foot--The amount of water needed to cover 1 acre to a depth of 1 foot, equals 325,851 gallons.
Aquifer--Formation, group of formations, or part of a formation that' contains sufficient saturated permeable material to yield significant quantities of water to wells and springs.
Confined ground water--Confined ground water is under pressure significantly greater than atmospheric, and its upper limit is the bottom of a bed of distinctly lower hydraulic conductivity than the material in which confined water occurs.
Geophysical log--A continuous graphic record of the response of various sensors to physical or chemical properties of the rock material and its contained fluids as the instrument is lowered into the borehole or well.
Hydraulic conductivity--The volume of water at the existing kinematic viscosity that will move in a unit of time under a unit hydraulic gradient through a unit area measured at right angles to the direction of flow.
Hydrograph--A graph showing some property of water with respect to time, such as the hydrostatic head measured in a well.
Potentiometric surface--K surface that represents the hydrostatic head. In a confined (artesian) aquifer the water is under a pressure significantly greater than atmospheric, and the surface is defined by the levels to which water stands in wells above the water body tapped. In an unconfined aquifer, the surface coincides with the water table.
Saturated thickness--As used in this report is the thickness of the unconsolidated materials between the water-table surface and the bedrock surface.
Specific capacity--The rate of discharge of water from a well divided by the drawdown of water within the well. If the specific capacity is constant except for the time variation, it is roughly proportional to the transmissivity of the aquifer.
Specific yield--Of a rock or soil is the ratio of (1) the volume of water which the rock or soil, after being saturated, will yield by gravity to (2) the volume of the rock or soil. The definition implies that gravity drainage is complete.
Storage coefficient--The volume of water an aquifer releases from or takes into storage per unit surface area of the aquifer per unit change in head.
Transmissivity--The rate at which water of the prevailing kinematic viscosity is transmitted through a unit width of the aquifer under a unit hydraulic gradient. It is equal to an integration of the hydraulic conductivities across the saturated part of the aquifer perpendicular to the flow paths (transmissivity equals hydraulic conductivity times saturated thickness). In physical reality it is a flow expressed in cubic feet of water per day per foot of aquifer width. In this report it is given in the reduced units of feet squared per day.
Water table--That surface in an unconfined ground-water body at which the water pressure is atmospheric. It is defined by the levels at which water stands in wells that penetrate the water body enough to hold standing water. The water table is a particular potentiometric surface.
Kansas Geological Survey
Placed on web July 22, 2013; originally published in 1978.
Comments to webadmin@kgs.ku.edu
The URL for this page is http://www.kgs.ku.edu/Publications/Bulletins/IRR4/index.html