Kansas Geological Survey, Open-file Report 92-34
KGS Open File Report 92-34
Released 1992
To read this report, you will need the Acrobat PDF Reader, available free from Adobe.
Nitrate contamination of the Great Bend Prairie aquifer in east-central Stafford County, Kansas, is more pronounced at shallower than at deeper portions of the aquifer. Controls on the occurrence of nitrate in the shallow ground water appear to be irrigation well density, the presence of subsurface clay lenses, and land-use practices.
Nitrate-N concentrations of sampled wells ranged from 0.2 to 13.3 mg/L with a mean of 5.1 mg/L and a median of 4.5 mg/L. Deeper wells had significantly lower nitrate-N concentrations than shallower wells. This is probably due to their greater depth and to the greater number and total thickness of clay layers in the subsurface profile which can retard the downward movement of water and nitrate.
Depth of well showed a strong negative correlation with nitrate-N values, indicating that shallow ground water is more susceptible to contamination than deeper ground water. Correlation of thickness of clay above the well screen with nitrate-N values showed that lower concentrations were more probable in wells with more clay above the screen.
Irrigation well density showed a statistically significant positive correlation with nitrate-N concentrations of shallow wells. Nitrate-N concentrations were not significantly different between the two irrigation practices (flood vs. pivot) used in the area.
Nitrate-N concentrations were not significantly different under any of the soil classifications.in the study area regardless of how they were classified or grouped. This suggests that land-use practices, point sources, and subsurface stratigraphy may be more important influences than the surface soils.
Nitrate contamination of ground water is a serious concern in areas where ground water is a major source of drinking water. Many sources of potential nitrate contamination are due to human activities. Point sources, such as spills or leaks during mixing of fertilizers and/or pesticides, leaking septic systems, and feedlot waste disposal practices, may be causes for high nitrate values in ground water. Non-point sources in agricultural areas resulting from widespread use of fertilizers over long periods of time also may contaminate the ground water (Hallberg, 1986).
Figure 1 shows the nitrogen cycle in an agricultural system and the sources and methods of removal of nitrogen from the cycle. The major sources (shown by dashed arrows) are nitrogen fertilizers, manure, wastes and sewage, crop residues, and the changes from organic nitrogen to ammonium and then to nitrate caused by bacteria. The methods of removal (shown by solid arrows) consist of plant uptake and removal of the plants by harvesting, removal by animal uptake, denitrification (changing of nitrate to nitrogen gas by bacteria), ammonia volatilization (conversion of ammonium-N to ammonia gas with loss to the atmosphere), removal of ammonium-N through soil erosion, and leaching of nitrate below the crop rooting zone downward to the ground water.
Nitrate is a conservative contaminant in that it is soluble in water and moves with the water unless one of the removal processes shown in Figure 1 occurs. Nitrate has a negative charge and is not affected by adsorption on organic matter or clays with net negative surface charges. Sources of nitrate from fertilizer are either the transformation of ammonia or ammonium. fertilizers to nitrate by bacteria or the application of fertilizers in the nitrate form. If the fertilizers are not used by the plants or transformed into nitrogen gas or organic nitrogen in the soil by bacteria, then the nitrate is available for leaching (Follet et al., 1981; Keeney, 1986).
Figure 1--The Nitrogen Cycle (adapted from Follett et al., 1981).
Stafford County is located in the Great Bend Prairie in south-central Kansas (Figure 2). The Great Bend Prairie is an alluvial plain covered mostly with wind-blown sand and characterized by typical sand dune topography (Latta, 1950). Well- to poorly drained loamy and sandy soils are typical of the area (Dodge et al., 1978). In the four townships composing the study area (Figure 3), the land is used primarily for dryland and irrigated crop production, but some pastureland remains. Farming has been a major occupation in the county since at least 1885 (KBA, 1887). Oil production is extensive, and oil wells are numerous.
Figure 2--Location of study area in Stafford County, Kansas.
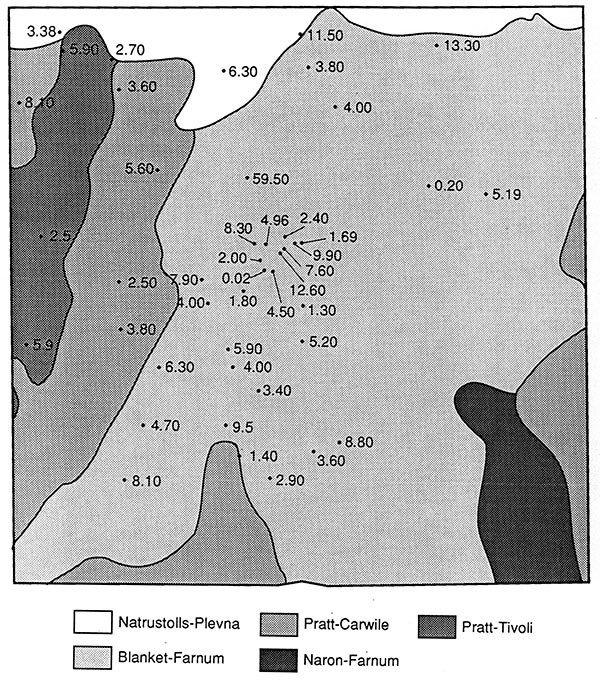
Figure 3--Location of sampled wells in the study area.
The Arkansas River is the major flow-through stream in the area. In Stafford County, Rattlesnake Creek, Peace Creek, and the North Fork of the Ninnescah River are eastward flowing tributaries to the Arkansas River. Two salt marshes occur on Rattlesnake Creek in northeastern Stafford County, indicating the shallow water table in the area.
Ground water from the Great Bend Prairie aquifer is the sole source of usable water in the study area, supplying domestic, municipal, irrigation, oil-field supply, and stock wells. The alluvial aquifer consists of unconsolidated deposits of sand, gravel, silt, and clay of Quaternary age. Subsurface silt and clay lenses of various thickness and geometry occur throughout the area (Latta, 1950; Sophocleous et al., 1990). The saturated thickness of the aquifer varies from 0 to 150 ft (46 m). The depth to water is generally less than 30 ft (9 m) and ground-water flow is to the east Ground water is managed by the Big Bend Groundwater Management District 5 (GMD5).
Madison and Brunett (1984) indicate that 3 mg/L is considered natural background level for nitrate-N in ground water throughout the United States. In the Great Bend Prairie nitrate levels are frequently found to be above background levels and are often above the drinking water standard of 10 mg/L as nitrate-N. Hathaway et al. (1978) showed that a number of irrigation wells throughout the GMD5 had nitrate-N concentrations above 10 mg/L.
A survey of irrigation and domestic wells in the GMD5 in areas with sandy soils showed that, in general, the irrigation wells were deeper and yielded water with lower nitrate-N concentrations and that domestic wells were shallower and had higher nitrate-N values (Figure 4; Table 1; Townsend and Marks, 1990). Samples collected at the base of the aquifer [approximately 100-150 ft (30-46 m)] have nitrate-N concentrations of approximately 3 mg/L or lower (Whittemore et al., 1987).
Figure 4--Comparison of depth of well with nitrate-N concentration (Townsend and Marks, 1990)
Table 1--Summary of Nitrate Concentrations of Wells in Sandy Soils in Ground Water Management District 5 From Previous Studies
| Location | County | NO3-N (mg/L) |
Well type |
Date | Depth (ft) |
Depth (m) |
|---|---|---|---|---|---|---|
| NE-33-23S-17W | Pawnee | 5.19 | I | 6-1988 | 72 | 22 |
| SE-32-23S-17W | Pawnee | 3.16 | I | 6-1988 | 62 | 19 |
| SW-32-23S-17W | Pawnee | 9.0 | D | 6-1988 | 45 | 14 |
| NE-8-23S-16W | Pawnee | 4.7 | D | 6-1988 | 60-66+ | 18-20+ |
| NE-8-23S-16W | Pawnee | 2.7 | I | 6-1988 | 63 | 19 |
| SW-16-23S-17W | Pawnee | 12.6 | D | 6-1989 | 54-63+ | 16-19+ |
| SE-23-21S-16W | Pawnee | 9.0 | D | 6-1989 | 45-54+ | 14-16+ |
| SE-15-24S-18W | Edwards | 5.19 | D | 6-1988 | 63-70+ | 19-21+ |
| SE-15-24S-18W | Edwards | 12.4a | I | 6-1988 | 63 | 19 |
| SE-25-25S-18W | Edwards | 6.1 | D | 6-1988 | 72 | 22 |
| NE-18-25S-18W | Edwards | 13.9 | D | 6-1989 | 54 | 16 |
| SE-14-27S-20W | Kiowa | 4.3 | W | 6-1988 | 45-72+ | 14-22+ |
| SE-23-27S-20W | Kiowa | 6.3 | I | 6-1988 | 90-144+ | 27-44+ |
| SW-33-21S-9W | Rice | 10.4, 8.35 | D | 9-88, 6-1989 | 40.5 | 12 |
| SW-33-21S-9W | Rice | 21.6a, 6.9 | I | 9-1988, 6-1989 | 70-80+ | 21-24+ |
| SW-34-21S-9W | Rice | 5.8 | I | 6-1988 | 70 | 21 |
| SE-11-26S-14W | Pratt | 6.5, 6.9 | I | 11-1988, 6-1989 | 66 | 20 |
| NW-12-26S-14W | Pratt | 16.9, 14.4 | D | 9-1987, 6-1989 | 58.5 | 18 |
| NE-36-23S-12W | Stafford | 12.4 | D | 6-1989 | 36-72+ | 11-21+ |
| NE-01-23S-9W | Reno | 40.8 | M | 6-1989 | 30.5 | 9 |
| NE-01-26S-10W | Reno | 19.8 | M | 6-1989 | 18 | 5 |
| NE-01-23S-9W | Reno | 67.4 | D | 6-1989 | 50 | 15 |
| D domestic; I irrigation; W windmill; M monitoring well. a. Fertilizer may have been applied shortly before the sample was collected. b. Well log not available. Range of depths from nearby wells. |
||||||
Work in Nebraska and Iowa indicates that nitrate in the shallow ground water may be due to stratification near the top of the water table rather than to stratigraphic controls on the movement of the water (Spalding, 1984; Thompson et al., 1986). In these studies there is no indication that clay zones are widespread throughout the alluvial aquifers. In the Great Bend Prairie aquifer the occurrence of clay lenses, as indicated by Rosner (1988), Sophocleous et al. (1990), and Townsend and Marks (1990), helps to support the idea of better quality water at depth as a result of the vertical retardation of the movement of water and nitrate by perching of water above the clay zones.
Research in other parts of the GMD5 has indicated that areas with sandy soil are prone to nitrate contamination (Sophocleous et al., 1990; Townsend and Marks, 1990). The current study in Stafford County was undertaken to determine whether nitrate contamination of the shallow ground water is occurring and what variables might be useful for predicting areas of possible contamination. The variables examined included soil classification, irrigation practices, well type, depth of well, clay thickness in the subsurface, depth to water table, and depth of well below water table.
The wells sampled in this study were selected (where possible) on the basis of soil type and well logs from the Kansas Department of Health and Environment. The soil associations of the four townships were overlain on topographic maps of the area. Wells were selected from the different soils and the presence of irrigation (deep) and domestic and stock (shallow) wells within a one-mile (0.6 km) radius of each other where possible (Figure 3). Two of the irrigation wells were selected for resampling for comparison with results from the irrigation well survey done by the KGS in the Great Bend Prairie in 1978 (Hathaway et al., 1978).
Soil classification was considered a potential factor in determining areas vulnerable to nitrate contamination in the study area. The general soil associations of the area, the specific soil series from the area surrounding the wells, and the general soil textural class were evaluated.
The major soil associations mapped in the 144-square-mile study area are Pratt-Tivoli (8%), Pratt-Carwile (24%), Naron-Farnum (4%), Blanket-Farnum (60%), and Natrustolls-Plevna (4%) (Figure 5). The soil series mapped at the specific well sites are described as follows. Pratt and Tivoli (Pt) soils series are generally sandy, have high permeability, and are used as pasture or cropland. Carwile (Ca) soils are loamy, of slow permeability, and are used generally as cropland. Naron (Na) soils are loamy, of moderate permeability, and are used as cropland. Blanket (Ba) soils are silt-clay loams, of moderate permeability, and are used as cropland. Natrustolls-Plevna (Nu) soils are alluvial soils with moderate permeability and are generally grasslands.
Figure 5--Soils associations map of study area with nitrate-N concentrations of sampled wells.
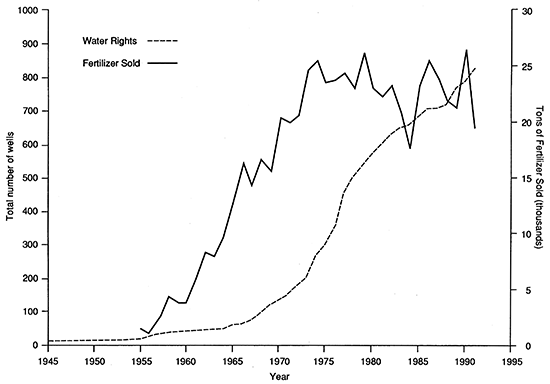
Water rights applications and the total quantity of fertilizer sold in Stafford County show a general increase from the mid-1960's to present. Both these criteria indicate that irrigated farming has increased in the county (Figure 6). An increased number of irrigation wells means that more acreage is subject to more water than is available solely from precipitation. Studies in the GMD5 and in other states suggest that irrigated farming may be a potential source of nitrate contamination, particularly in areas with well-drained soils (Hallberg, 1986; Spalding and Kitchen, 1988; Spalding et al., 1978; Thompson et al., 1986; Townsend and Marks, 1990; Young, 1992).
Figure 6--Water Rights (1945-1991) and Fertilizer Sold (1955-1991) in Stafford County, Kansas.
Irrigation can cause an increase in nitrate contamination in several ways: (1) An increase in the area of irrigated cropland means a greater potential source of fertilizer over time than when the land was not cultivated or irrigated; (2) the additional input of water provides a pathway for enhanced nitrate movement if the fertilizer and/or water is not utilized by the crop; (3) increased density of irrigation wells may result in more mixing of shallower and deeper ground water; and (4) chemigation backflow down the well because of faulty check valves or leaks from the mixing tank near the well bore may result in nitrate entering ground water directly. Improper or deteriorated well construction of irrigation, domestic, or stock wells also could permit contaminated surface flow to reach the aquifer.
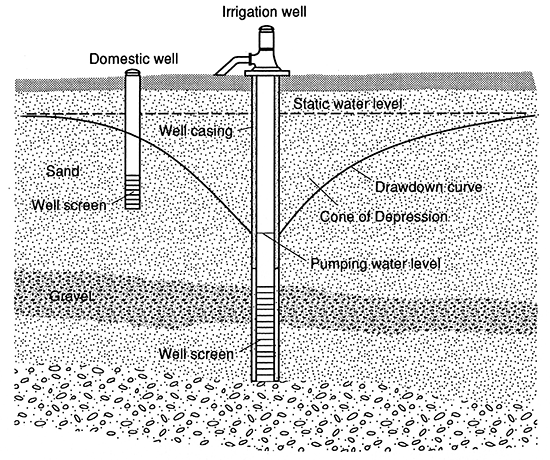
Mixing of different zones of water is illustrated in Figure 7. This figure shows that the area of influence of an irrigation well (called the cone of depression) can draw water from the shallower zone of the aquifer. If there are several irrigation wells pumping at the same time, the area of pumping influence may be greater because of competition of the wells for the same water.
Figure 7--Mixing of shallow and deep water due to irrigation.
If the shallow zone of the aquifer becomes contaminated then the deeper zones of the aquifer may become contaminated with time due to vertical mixing of the water from the two zones by natural and man-induced mechanisms. Mixing has occurred in parts of GMD5 as indicated by the nitrate-N values greater than the 3 mg/L background level in the deeper portions of the aquifer (Tables 1 and 2; Young, 1992).
A summary of the information collected for the 43 wells sampled during the study is listed in Table 2. The information on the table includes ID number, well type, location, nitrate-N (NO3-N) concentration, the soil association and series data available from the Soil Survey of Stafford County (Dodge et al., 1978), depth of well, depth to water, depth below water table, total clay thickness above the screen, and irrigation well density. The comments column provides information on land use near the well.
Table 2--Summary of Data from Stafford Coun!y Well Survey.
| ID | Well type |
Location | NO3-N (mg/L) |
Soil Series |
Soil Assoc. |
Well depth (ft) |
Depth to water (ft) |
Depth below water table (ft) |
Depth to top of screen (ft) |
Total clay (ft) |
Clay above screen (ft) |
Irr. well Density |
Comments |
|---|---|---|---|---|---|---|---|---|---|---|---|---|---|
| 1a | I | 23-11-4 DDA | 13.3 | CA | FBF | 42 | 9 | 33 | 2 | Milo, flood, no log | |||
| 2 | S | 23-11-6 CBB | 11.5 | NA | FBF | 36 | 13 | 23 | 25 | 6 | 1 | 1 | Pasture |
| 3 | I | 23-11-7 B | 3.8 | NA | FBF | 104 | 12 | 92 | 64 | 16 | 16 | 1 | Milo, wheat, pivot |
| 4 | D | 23-11-18 AAB | 4 | CA | FBF | 78 | 21 | 57 | 48 | 46 | 46 | 1 | Pens, house |
| 5 | D | 23-11-22 DDD | 5.19 | FR | FBF | 57 | 18 | 39 | 47 | 13 | 13 | 1 | Wheat, house |
| 6 | S | 23-11-30 CCC | 1.69 | BA | FBF | 90 | 10 | 80 | 70 | 43 | 43 | 4 | Stock well |
| 8 | I | 23-12-5 CCC | 5.9 | CA | PCP | 46 | 8 | 38 | 26 | 7 | 7 | 2 | Corn, alfalfa, soybeans, flood |
| 9 | I | 23-12-9 C | 3.6 | PO | PCP | 92 | 13 | 79 | 61 | 48 | 48 | 1 | Flood |
| 10 | D | 23-12-5 CBB | 3.38 | FA | PCP | 29 | 6 | 23 | 19 | 14 | 14 | 1 | Some livestock |
| 11 | S | 23-12-9 BB | 2.7 | PO | PIT | 10 | 1 | Pasture | |||||
| 12 | S | 23-12-11 BDA | 6.3 | PA | PKW | 40 | 7 | 33 | 20 | 9 | 9 | 1 | Pasture, pond |
| 14 | S | 23-12-18 BBA | 8.1 | PR | PCP | 55 | 13 | 42 | 45 | 12 | 12 | 3 | Pasture |
| 15a | I | 23-12-22 BCC | 5.6 | CA | PCP | 15 | 3 | Milo, flood | |||||
| 17 | I | 23-12-35DDC | 1.8 | BA | FBF | 69 | 15 | 54 | 22 | 3 | Milo, alfalfa, flood | ||
| 18a | I | 23-12-25 CDC | 4.96 | BA | FBF | 20 | 5 | Milo, beans, flood | |||||
| 19 | D | 23-12-25 CCC | 8.3 | BA | FBF | 65 | 20 | 45 | 45 | 30 | 30 | 5 | Lawn, house |
| 20 | S | 23-12-30 DCA | 2.5 | PO | PIT | 61 | 19 | 42 | 51 | 36 | 36 | 1 | Pens to east |
| 21 | I | 23-12-33 C | 2.5 | PR | PCP | 120 | 27 | 93 | 80 | 58 | 58 | 2 | Corn, pivot |
| 22 | D | 23-12-34 DAD | 7.9 | BA | FBF | 52 | 22 | 30 | 42 | 30 | 30 | 2 | Garden, yard |
| 23 | I | 23-12-25 DCA | 2.5 | BA | FBF | 60 | 14 | 46 | 26 | 24 | 24 | 4 | Pivot |
| 24 | D | 23-12-25 DDD | 9.9 | BA | FBF | 45 | 14 | 31 | 35 | 20 | 20 | 4 | |
| 27 | I | 24-11-19 B | 3.6 | NA | FBF | 84 | 21 | 63 | 48 | 30 | 30 | 1 | Corn, pivot |
| 28 | D | 24-11-19 AAB | 8.8 | NA | FBF | 60 | 15 | 45 | 40 | 26 | 18 | 2 | |
| 29 | D | 24-11-6 CCC | 5.2 | FR | FBF | 60 | 26 | 34 | 50 | 37 | 37 | 0 | Barns, pens |
| 30 | D | 24-11-6 BBC | 1.3 | FR | FBF | 60 | 19 | 41 | 44 | 31 | 31 | 0 | Pig pens nearby |
| 31 | D | 24-12-2 BBC | 4 | BA | FBF | 69 | 18 | 51 | 59 | 41 | 41 | 1 | Wheat, garden |
| 32 | I | 24-12-4 C | 3.8 | PR | PCP | 135 | 23 | 112 | 70 | 34 | 34 | 3 | Corn, pivot |
| 33 | S | 24-12-7 BA | 5.9 | PO | PIT | 94 | 25 | 69 | 74 | 66 | 66 | 1 | Pasture |
| 34 | D | 24-12-10 CBB | 6.3 | FR | FBF | 55 | 22 | 33 | 47 | 30 | 30 | 1 | Strip farm to west |
| 35 | D | 24-12-11 BAA | 5.9 | BA | FBF | 60 | 24 | 36 | 40 | 30 | 30 | 2 | Corn, lawn |
| 36a | I | 24-12-11 B | 4 | BA | FBF | 27 | 3 | Corn, flood | |||||
| 37 | D | 24-12-12 CCC | 3.4 | BA | FBF | 60 | 27 | 33 | 40 | 17 | 17 | 2 | |
| 38 | I | 24-12-16 D | 4.7 | FR | FBF | 103 | 30 | 73 | 63 | 31 | 31 | 3 | Corn, pivot |
| 39 | D | 24-12-14 CAD | 9.5 | NA | FBF | 70 | 21 | 49 | 60 | 34 | 34 | 5 | |
| 41 | D | 24-12-21 CD | 8.1 | FR | FBF | 26 | 4 | Corn, beans to west | |||||
| 42 | D | 24-12-23 ACA | 1.4 | NA | PCP | 85 | 17 | 68 | 76 | 68 | 68 | 3 | Barns to west |
| 43 | I | 24-12-24 CDB | 2.9 | NA | FBF | 87 | 24 | 63 | 42 | 33 | 33 | 2 | Milo, beans, pivot |
| 45 | I | 23-12-36 BBC | 2 | BA | FBF | 66 | 18 | 48 | 40 | 17 | 17 | 5 | Corn, flood |
| 46a | I | 23-12-36 BDC | 4.5 | BA | FBF | 18 | 5 | Corn, flood | |||||
| 48 | D | 23-12-36 AB | 12.6 | BA | FBF | 12 | 5 | Feedlot, barn | |||||
| 50 | D | 23-12-36 ABA | 7.6 | BA | FBF | 38 | 12 | 26 | 34 | 16 | 16 | 5 | Observation well |
| 16 | D | 23-12-23 DAA | 59.5 | FR | FBF | 88 | Barns west of house | ||||||
| 25 | I | 23-11-21 D | 0.2 | BA | FBF | 17 | Wheat, pivot | ||||||
| 47 | D | 23-12-36 BC | 0.02 | BA | FBF | 17 | House well | ||||||
| a. Pre-1976 wells. No well log available. | |||||||||||||
Statistical tests were performed to determine relationships between nitrate-N concentrations and a number of variables including: well type, depth of well, irrigation practice, irrigation well density, and soil classification. When depth of well was evaluated, only wells with available well logs were used in the analyses. Therefore only 33 values were used instead of the 43 for the other variables. Wells number 16, 25, and 47 were not included in the statistical analyses due to an obvious point source at the site 16, the lack of a representative value from 125 due to insufficient well pumping, and to lack of information about well D47 (Table 2).
All of the statistical results and criteria are listed and explained in Appendix 1. Box-plots are used to represent the median value and the total range of values for the various statistical tests. The median is the value at which 50% of the sample values are higher and 50% are lower than that value.
Mean, median, and ranges of depth and nitrate-N concentrations based on well type are listed in Table 3. Differences in nitrate-N concentrations and depth for the different well types are apparent. Irrigation wells were generally deeper and had lower nitrate-N concentrations compared with domestic and stock wells, indicating that the shallower zones of the aquifer are more contaminated than the deeper zones.
Depth of well was evaluated to determine if an overall difference existed between shallow and deep wells as represented by domestic vs. irrigation wells. The domestic wells were selected on the assumption that they intercepted the shallow portion of the aquifer and the irrigation wells were selected on the assumption that they intercepted the deeper portions of the aquifer. Figure 8 shows that irrigation wells are generally deeper than domestic and stock wells. Depth was found to be statistically different for the two well types (see Table 4 in Appendix 1).
Figure 8--Comparison of median depths with well types.
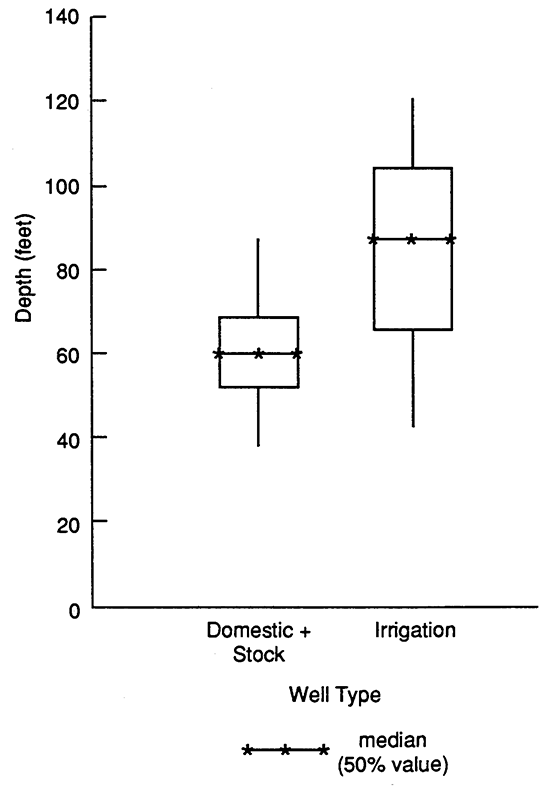
The nitrate-N values of the two well type categories (domestic and stock vs. irrigation) were evaluated to determine if there was an observable difference in concentration. Figure 9 shows the observable difference in concentration between the well types with concentrations being lower in the deeper irrigation wells. This difference is significant (see Table 4 in Appendix 1).
Figure 9--Comparison of median nitrate-N concentrations from different well types.
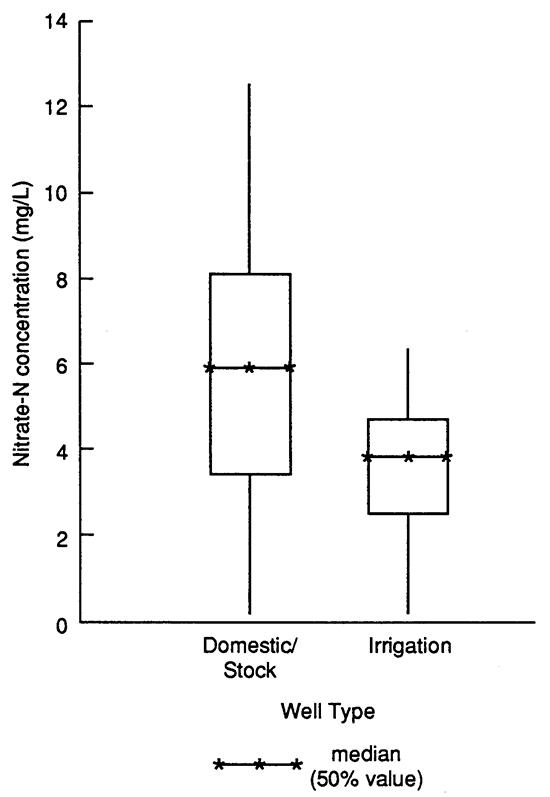
Table 3--Summary of Mean and Median Values for Well Types, Depth, and Nitrate-N Concentrations
| Well Type | Nitrate-N Concentrations | Range mg/L |
Depth of Wells* | Range (ft) |
||||
|---|---|---|---|---|---|---|---|---|
| Number of Samples |
Mean NO3-N (mg/L) |
Median NO3-N (mg/L) |
Number of Samples |
Mean Depth (ft) |
Median Depth (ft) |
|||
| All | 43 | 5.1 | 4.5 | 0.02-13.3 | 33 | 68.4 | 60.5 | 29-135 |
| Irrigation | 17 | 4.1 | 3.8 | 0.2-13.3 | 11 | 87.8 | 87 | 46-135 |
| Domestic | 19 | 5.9 | 5.9 | 0.02-12.6 | 16 | 58.9 | 60 | 29-85 |
| Stock | 7 | 5.5 | 5.9 | 1.9-11.5 | 6 | 62.7 | 55 | 36-94 |
| Only wells with well logs were used for depth analyses (see Table 2). | ||||||||
Based on the median depth for all wells (60.5 ft; 18 m) the nitrate-N values were evaluated by depth alone without considering well type (irrigation, domestic or stock). The depth categories were: less than or equal to 60 ft (18 m) and greater than 60 ft (18 m). As shown in Figure 10, there is a significant difference between the two groups with concentrations being lower in the deeper wells (see Table 5 in Appendix 1). The median values of these two groups are similar to those for the data defined by well type (Figure 9; Table 4 in Appendix 1) suggesting that analyzing the data by well type is a reasonable criterion.
Figure 10--Comparison of median nitrate-N concentrations for deep and shallow wells.
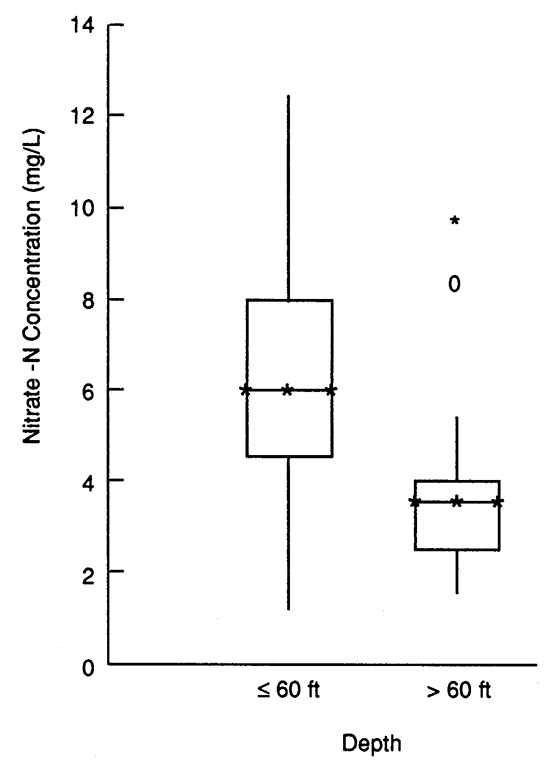
Figure 11 shows the relationship between decreasing nitrate-N concentration and increased depth of well for all wells. The result is not unexpected when one considers that the shallow portion of the aquifer is affected first by recharge, which may contain nitrate from point or nonpoint sources. The correlation coefficient for this test is statistically significant (Appendix 1).
Figure 11--Relationship between Nitrate-N concentration and depth.
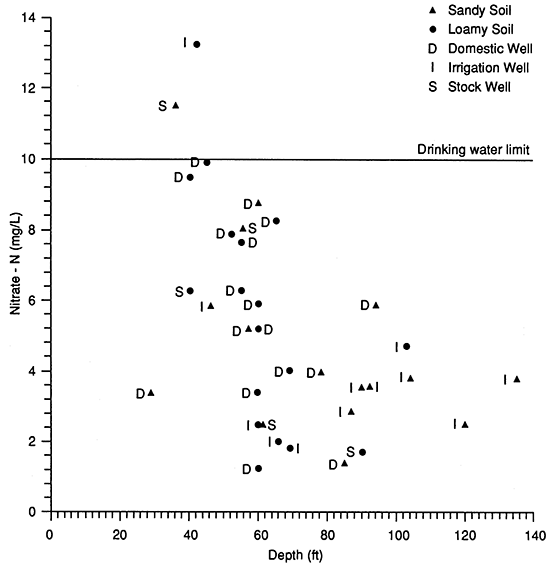
The soils data were evaluated by soil series, soil association, and general textural class: loam versus sand. Unlike previous studies that indicate that sandy soils were more likely to show nitrate-N contamination in the ground water, this study indicates that soil type had no relationship with the observed nitrate-N value of the ground water (see Table 6 in Appendix 1). However, inspection of Figure 11 shows that, of the four wells that are near the drinking water limit (10 mg/L), three are in areas with loamy soil and are less than 50 feet deep.
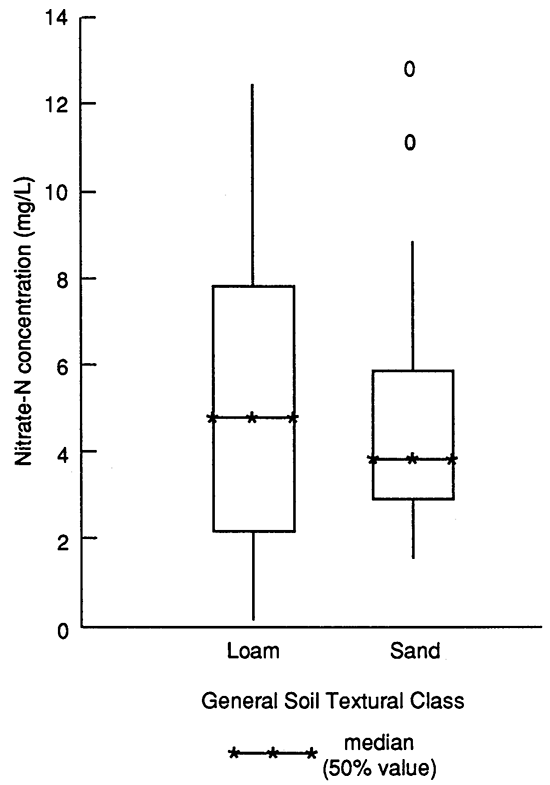
Figure 12 shows a box-plot of general soil textures and nitrate-N values. Although there is no statistically significant difference between the nitrate-N concentrations from wells in different soil textures (see Table 6 in Appendix 1), note that the median value of the loamy soils is slightly higher than that of the sandy soils. This was an unexpected result in this study.
Figure 12--Comparison of median nitrate-N concentrations under different soils.
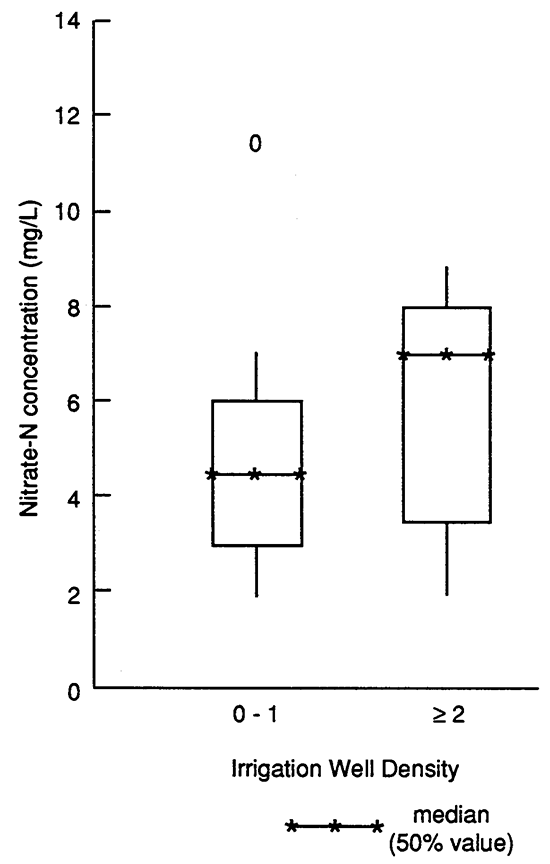
A large part of the study area is irrigated cropland. Generally more water and fertilizer are applied to irrigated than to non-irrigated land thus increasing the potential for nitrate leaching. Irrigation well density (IWD) is a measure of the proportion of an area that is influenced by irrigation practices. In this study, irrigation well density is defined as the number of irrigation wells within a one-mile (0.6 km) radius of a sampled well (Figure 3).
Irrigation well density near the domestic and stock wells (i.e, shallow wells) was examined throughout the study area. These values were evaluated against the observed nitrate-N concentration of each shallow well sampling point. A statistically significant positive correlation was found between the irrigation well density around the shallow wells and the nitrate-N concentration of those wells (Appendix 1).
Figure 13 shows the difference in observed nitrate-N concentrations based on irrigation well density. The 0-1 IWD has the lowest median value of nitrate-N, the 2-3 IWD has a higher median, and the 4-5+ IWD has the highest median nitrate-N values. This relationship indicates that increasing the number of irrigation wells in an area may result in increased nitrate-N in the ground water with time.
Figure 13--Comparison of median nitrate-N concentrations under different irrigation well densities near domestic and stock wells.
Evaluation of irrigation practice (flood vs. center pivot) showed higher nitrate-N values under flood-irrigated land than for center-pivot irrigated land although the result was not statistically significant (Figure 14; see Table 7 in Appendix 1). Several of the wells in the study were pre-1976 irrigation wells (Table 2) and did not have well logs available. All of these wells are flood irrigation wells.
Figure 14--Comparison of median nitrate-N concentrations from flood and center pivot irrigation systems.
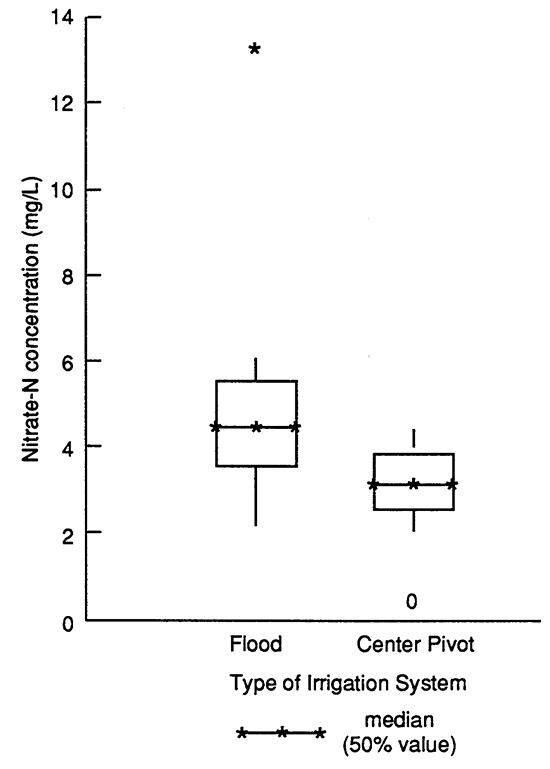
It is possible that the type of irrigation, the number of years that a particular type of irrigation has been practiced, the quantity of fertilizer applied with a particular irrigation practice, the age of the well, and/or the quantity of water applied are variables that affect the observed nitrate-N value. These variables warrant more research.
Flood irrigation wells 1 and 15 were sampled during 1978 with resulting nitrate-N concentrations of 14.2 and 5.19 mg/L respectively (Hathaway et al., 1978). These values are very similar to the results measured during this study (13.3 and 5.6 mg/L; Table 2). This suggests that the rate of change of nitrate-N concentration in the ground water may be slow and that similar land use practices in the study area with time may have resulted in a near constant recharge of nitrate to the ground water.
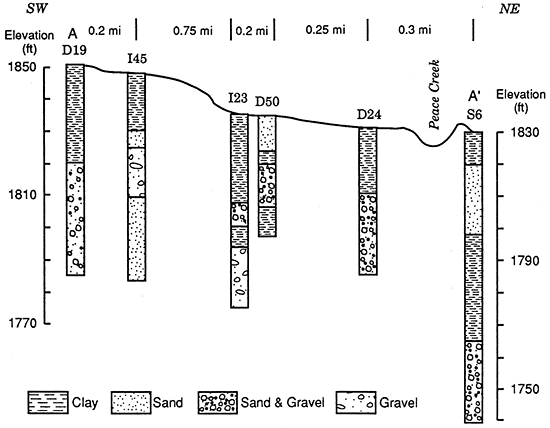
The relationship between nitrate-N concentration and the overall thickness of clay in the subsurface above the screened interval of the well was examined. If there was a reasonable thickness of clay above the screened interval we assumed that contaminants moving downward would be slowed by the clay, diverted down gradient from the well, or denitrified. The problem with this theory is that the clay lenses are not continuous in vertical or horizontal directions. Figure 15a is a schematic cross-section of clay lenses around a well. Figure 15b shows a cross section of stratigraphy based on well logs from the center of the study area (A-A' on Figure 3). Both figures illustrate the point that clay lenses are not continuous.
Figure 15a--Schematic of clay lenses distribution in the subsurface.
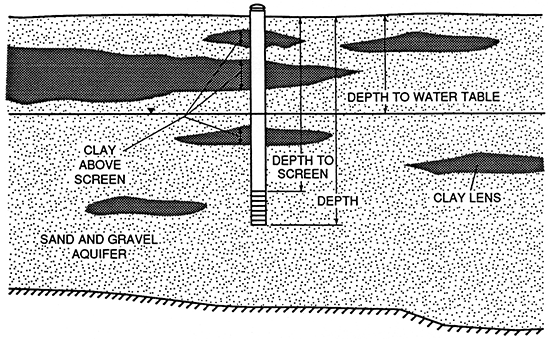
Figure 15b--Cross-section A-A' (Figure 3) showing variable thickness of clay lenses in subsurface.
Even if the clay is present in the subsurface, a well could become contaminated by several means: 1) Clay may not be specifically present at a well, and non-point or point source contaminants could be transported to the well by rainfall and/or irrigation; (2) improper or deteriorated well construction could result in contamination through surface runoff carrying contaminants down the annular space of the well; (3) long term non-point source contamination of the aquifer could result in contaminated water reaching a well; or (4) mixing of shallow and deep water could result from natural mixing or from the long-term effects of irrigation.
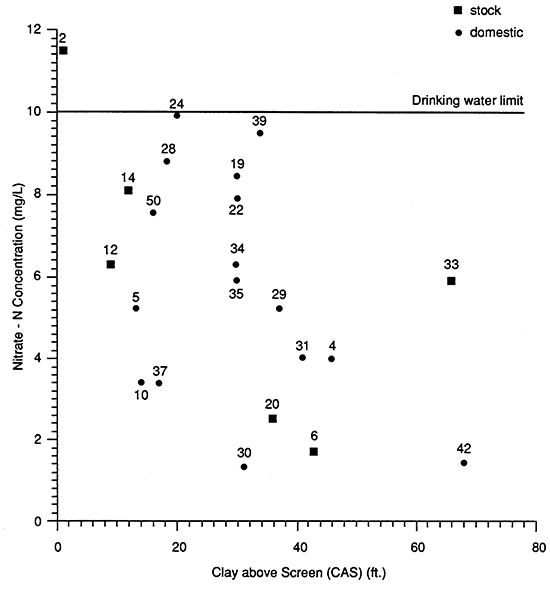
The amount of clay shown in the well logs was examined to see if there was a relationship with the observed nitrate-N values. Figure 16 shows the relationship between the nitrate-N values and thickness of clay above the screen for shallow wells. The significant negative correlation indicates decreasing nitrate-N values with increasing amount of clay above the screen (see Appendix 1).
Figure 16--Relationship between clay above sand and Nitrate-N for domestic and stock wells.
The shallow portion of the Great Bend Prairie aquifer in east-central Stafford County is more contaminated than deeper portions of the aquifer. Particularly in shallow wells, nitrate-N concentrations are related to the extent of irrigation near the well, depth of the well, and amount of clay above the well screen.
Irrigation well density (IWD) showed a positive correlation with nitrate-N concentrations of shallow wells. Concentrations were significantly higher where irrigation well densities were greater. Irrigation well density may be a useful indicator of potential areas of contamination in the shallow portion of the aquifer.
Nitrate-N concentrations in flood irrigation wells were somewhat higher than those in center-pivot irrigation wells. This difference suggests that other variables (e.g. differences in fertilizer application, differences in quantity of water applied, number of years that a particular irrigation practice has been used, and the age of the well) should be evaluated in future studies.
In shallow wells nitrate-N concentrations were lower where more subsurface clay was present above the well screen. In all wells nitrate concentrations decreased as depth of well increased. These relationships indicate that the shallow ground water is more susceptible to contamination than deeper water. Greater depth and the occurrence of more clay may have an effect on the presence of lower nitrate-N concentrations in the deeper irrigation wells.
Soil type did not influence nitrate-N concentration as expected. This suggests that the land use practices and the subsurface stratigraphy may be more important controls than the surface soils on the occurrence of nitrate in ground water.
Dodge, D.A., Hoffman, B.R., and Horsch, M.L., 1978, Soil Survey of Stafford County, Kansas: USDA, Soil Conservation Service, 60 p.
Follet, R.H., Murphy, L.S., and Donahue, R.L., 1981, Fertilizers and Soil Amendments: Englewood Cliffs, New Jersey, Prentice-Hall, Inc.
Hallberg, George R., 1986, From hoes to herbicides-agriculture and groundwater quality: Jour. Soil Water Conserv., v. 41, no. 6, p. 357-364.
Hathaway, L.R., Galle, O.K., Waugh, T.C., and Dickey, H.P., 1978, Chemical quality of irrigation waters in Ford County and the Great Bend Prairie of Kansas: Kansas Geological Survey, Chemical Quality Series 7, 40 p. [available online]
Kansas Board of Agriculture, 1887, Fifth Biennial Report of the Kansas State Board of Agriculture to the Legislature of the State, for the years 1885-86: Topeka, Kansas Publishing House. p. 540-545.
Keeney, D., 1986, Sources of nitrate to ground water: CRC Critical Reviews in Environmental Control, v. 16, no. 3, p. 257-304.
Latta, B.F., 1950, Geology and ground-water resources of Barton and Stafford counties, Kansas: Kansas Geological Survey, Bulletin 88, 229 p. [available online]
Madison, R.J., and Brunett, J.O., 1984, Overview of the occurrence of nitrate in ground water of the United States; in, National Water Summary 1984: U.S. Geological Survey, Water-Supply Paper 2275, p. 93-105. [available online]
Rosner, M.L., 1988, The stratigraphy of the Quaternary alluvium in the Great Bend Prairie, Kansas: Kansas Geological Survey, Open-File Report 88-32, 193 p.
SAS Institute Inc., 1991, Master index to SAS system documentation, Version 6, Third edition: Gary, North Carolina, SAS Institute, Inc.
Sophocleous, M., Townsend, M.A., Orountiotis, C., Evenson, R.A., Whittemore, D.O., Watts, C.E., and Marks, E.T., 1990, Movement and aquifer contamination potential of atrazine and inorganic chemicals in central Kansas cropland: Kansas Geological Survey, Ground Water Series 12, 64 p. [available online]
Spalding, M.E., 1984, Implication of temporal variations and vertical stratification of groundwater nitrate-nitrogen in the Hall county special use area: Nebraska WRRI, v.372906, Univ. Nebraska, Lincoln. 44 p.
Spalding, R.F., and Kitchen, L.A., 1988, Nitrate in the intermediate vadose zone beneath irrigated cropland: Ground Water Monitoring Review, v. 8, no. 2, p. 89-95.
Spalding, R.F., Gormly, J.R., Curtiss, B.H., and Exner, M.E., 1978, Nonpoint nitrate contamination of ground water in Merrick county, Nebraska: Ground Water, v. 16, no. 2, p. 86-95.
Thompson, C.A., Libra, R.D., and Hallberg, G.R., 1986, Water quality related to ag-chemicals in alluvial aquifers in Iowa; in, Proceedings of the Agricultural Impacts on Ground Water--a Conference, August 11-13, 1986, Omaha, NE, NWWA, (ed.): Dublin, OH, NWW A, p. 224-242.
Townsend, M.A., and Marks, E.T., 1990, Occurrence of nitrate in soil and ground water in south-central Kansas: Ground Water Management, Proceedings of the 1990 Cluster of Conferences, v. 1, February 20-21, 1990, NWWA, (ed.), Dublin, OH, p. 145-158.
Whittemore, D.O., McClain, T., Cobb, P.M., Davis, R., and Marks, E.T., 1987, Geochemistry of groundwaters in the saline intrusion area of Groundwater Management District No.5, south-central Kansas: Unpublished technical report prepared for GMD5.
Young, D. P., 1992, Nitrate contamination of ground water in northern Stafford County, Kansas: M.S. Thesis, University of Kansas, Unpublished, p. 94.
Non-parametric statistics were used because of the small sample size and of the non-normal distribution of many of the parameters. The basis of the nonparametric tests is the null hypothesis that there is no difference in nitrate-N concentrations between the compared variables (such as depth of well, clay thickness above the screen, irrigation well density, and irrigation practice). The alpha value (α) given with each test indicates the level at which the null hypothesis for the test is rejected. The 0.10 level of significance was chosen because of the small data set and because the wells were chosen on the basis of well logs (where available) and therefore cannot be considered to be a truly random sample. SAS/STAT software (SAS Institute Inc., 1991) was used for the statistical analyses.
In many of the non-parametric tests the median is used as the criterion for the test The median is the data point at which 50% of the sample values are greater and 50% are less. The mean, which is also a measure of central tendency, is given in some of the tests. It is the average value of all of the data points.
The Mann-Whitney test was used for comparison tests between groups. The Spearman correlation analysis was used to determine whether there are definable statistical relationships between the observed nitrate-N concentrations and several variables: depth of wells, clay above screen, and irrigation well density (IWD). The Spearman correlation coefficient rs shows the strength of the relationship and whether the relationship is positive or negative.
The Mann-Whitney nonparametric test was used to evaluate whether or not the differences in nitrate-N concentrations and depth of irrigation vs. domestic/stock wells are statistically significant. The domestic and stock wells were grouped together because of their similar nitrate-N concentrations and depth.
Evaluation of the results (Table 4) shows that irrigation wells were significantly deeper (α = 0.0036) and had significantly lower nitrate-N concentrations (α = 0.0641) compared with domestic and stock wells. These results help to confirm that the shallow zone of the aquifer is more contaminated than the deeper portions.
Table 4--Mann-Whitney Results for Nitrate-N Concentration vs. Well Type and Well-Type vs. Depth.
| Well Type | Nitrate-N vs. Well Type | Depth vs. Well Type* | ||||
|---|---|---|---|---|---|---|
| Number of Samples |
Mean NO3-N (mg/L) |
Median NO3-N (mg/L) |
Number of Samples |
Mean Depth (ft) |
Median Depth (ft) |
|
| Irrigation | 17 | 4.1 | 3.8 | 11 | 87.8 | 87 |
| Dom+Stock | 26 | 5.8 | 5.9 | 22 | 60.0 | 60 |
| α = 0.0641 | α = 0.0036 | |||||
| * Only wells with well logs were used for depth analyses (see Table 1). | ||||||
Comparison of nitrate-N values vs. depth of well based on the median depth [60.5 ft (18 m), Table 4] showed that there was a significant difference in the shallow vs. deep wells (Table 5). This compares favorably with the difference noted by defining the data by well type (irrigation, domestic and stock; Table 4). These two tests help to support the idea that the shallow portion of the aquifer is more contaminated than the deeper portion.
The comparison between nitrate-N concentrations and depth of all wells (n = 33) showed a significant Spearman Correlation coefficient (rs) of -0.46 (α = 0.0068). This correlation shows that decreasing concentrations of nitrate-N with depth exist. This corresponds with the results from the Mann-Whitney tests in which the nitrate-N concentrations of the deeper wells were less than the those of the shallower wells (Tables 4 and 5).
Table 5--Mann-Whitney Results for Nitrate-N Concentration vs. Depth of Well.
| Well depth | Number of samples |
Mean NO3-N (mg/L) |
Median NO3-N (mg/L) |
Range (mg/L) |
|---|---|---|---|---|
| Shallow (≤ 60 ft) | 16 | 6.19 | 6.1 | 1.3-11.5 |
| Deep (> 60 ft) | 17 | 3.88 | 3.8 | 1.4-9.5 |
| α = 0.0191 |
Several combinations of soils data were evaluated including soil association, soil series, classification based on the least permeable horizon (less than 2 in/hr), the most clayey soil versus all others, and a general grouping of sand vs. loam soils. Nitrate-N concentrations were not significantly different under any classification or grouping of the soils. Table 6 shows the lack of correlation at the most basic textural grouping: sand vs. loam. The lack of correlation was an unexpected result of this study.
Table 6--Nitrate-N Concentration vs. Soil Type Mann-Whitney Test.
| Soil type | Number of samples |
Mean NO3-N (mg/L) |
Median NO3-N (mg/L) |
Range (mg/L) |
|---|---|---|---|---|
| Loam | 23 | 5.26 | 4.96 | 0.2-12.6 |
| Sand | 19 | 5.18 | 3.80 | 1.4-13.3 |
| α = 0.7045 |
A correlation analysis was done to determine whether irrigation well density was related to nitrate-N concentrations in the ground water. Nitrate-N concentrations of domestic (shallow) wells (n = 25) were found to be strongly correlated with irrigation well density (rs = +0.50, α = 0.0099). This correlation indicates that in shallow ground water there is a greater probability of higher concentrations of nitrate-N occurring in more heavily irrigated areas.
In addition to irrigation well density, the type of irrigation (flood vs. pivot system) was evaluated. Table 7 shows the summary of the Mann-Whitney test comparing the nitrate-N concentrations from these two types of wells. Although not significant at the 90% level (possibly because of the small sample size) the flood irrigation wells had somewhat higher nitrate-N concentrations than the pivot irrigation wells (Figure 14).
Table 7--Nitrate-N Concentration vs. Irrigation Practice Mann-Whitney Test.
| Number of samples |
Mean NO3-N (mg/L) |
Median NO3-N (mg/L) |
Range (mg/L) |
|
|---|---|---|---|---|
| Flood | 9 | 5.1 | 4.5 | 1.8-13.3 |
| Pivot | 8 | 3.0 | 3.25 | 0.2-4.7 |
| α = 0.1117 |
The thickness of clay above the screen in shallow wells was also evaluated. This was done to test whether the presence of a high thickness of clay above the screen was related to lower nitrate-N concentrations. Clay thickness and depth to the top of the screen were obtained from well logs (Table 2). The domestic and stock well values of nitrate-N showed statistically significant negative correlations with clay above the screen (rs = -0.48, α = 0.0245, n = 22).
These results indicate that nitrate-N concentrations decrease with increasing thickness of clay above the screen (see Figure 15). This suggests that the thickness of clay in the subsurface above the screen plays a significant role in retarding nitrate movement, redirecting nitrate movement, or both.
Kansas Geological Survey, Geohydrology
Placed online Feb. 15, 2016; originally released 1992
Comments to webadmin@kgs.ku.edu
The URL for this page is http://www.kgs.ku.edu/Hydro/Publications/1992/OFR92_34/index.html