Kansas Geological Survey, Open-file Report 83-15
KGS Open File Report 83-15
A Report for the Kansas Department of Health and Environment
June 1983
Read the PDF version (723 kB)
Saline water has been found in the well of Mr. Gus Wilgus located in the NW of the NW of Section 20. T. 14 S., R. 2 W., in the eastern part of Salina, Saline County. The well is 82 feet deep, placing its screened interval in the upper part of the Wellington Formation which consists of shale with discontinuous gypsum beds in northeastern Saline County (Dunlap, 1975). The quality of groundwater within the upper Wellington in the region ranges from fresh to mineralized, containing dissolved calcium and sulfate up to several hundred mg/L and over 1000 mg/L, respectively (Dunlap, 1975; Whittemore et al., 1981). Chloride concentrations in the same groundwaters are nearly always less than 250 mg/L, the recommended limit for this constituent in drinking water. Natural salt water derived from solution of halite (rock salt) in the middle of the Wellington Formation might exist under the area of the Wilgus well; however, at least 120 feet of interbedded shale, gypsum, and anhydrite are present between the bottom of the well and the top of the salt bed, based on data for the Wellington Formation given by Gillespie and Hargadine (1981) and the surface geology and elevation in the vicinity of the well.
In 1979, the Kansas Department of Health and Environment found a chloride content of 1400 mg/L in water from a 72 feet deep well (owned by Don Lagerberg) in the same quarter section as the Wilgus well. The sulfate concentration in the water sample was relatively low (45 mg/L) for the area. The source of the saline water was thought to have been oil-field brine as suggested by the chemistry of the water. Both water wells are located within the Salina oil field. There are two oil wells and one brine disposal well that have been recently operating, and at least 7 abandoned oil boreholes within a half-mile radius of the Wilgus well.
The Department of Health and Environment collected three samples from the Wilgus well on March I, 1983. The first sample, collected at the bottom of the well, contained 7,250 mg/L dissolved chloride. The second and third samples were taken from the bottom of the well and at the water table, respectively, after 40 minutes of bailing and both had a chloride concentration of 5250 mg/L. The second sample (from the well bottom) was sent to the Kansas Geological Survey for identification of the saltwater source by the procedures of Whittemore et al. (1981) and Whittemore (1983). These methods are especially effective for distinguishing oil-field brine from halite-solution brine sources contaminating waters. This report gives the results of the chemical identification of the water sample provided and a comparison with the chemistry of the Lagerberg well water.
The bromide and chloride concentrations were measured by automated methods using phenol red (Basel et al., 1982) and ferric theocyanate on a Technicon AutoAnalyzer.
The chloride and bromide concentrations determined in the Wilgus well water are listed in Table 1 with the Department of Health and Environment data and calculated ratios for both the Wilgus and Lagerberg water wells. The range and average of values from Whittemore, et al. (1981) for 10 samples of oil-field brines collected from oil wells, separator tanks, and disposal systems in the northern Salina Field within a 2.5 mile radius of the Wilgus well, and samples from 15 observation wells in the Wellington saltwater aquifer in Saline County are also included in Table 1.
Table 1--Dissolved Constituent Concentrations and Ratios for Water Well, Oil-Field Brine, and Wellington Saltwater Aquifer Samples. Oil-field brine and Wellington saltwater data is from Whittemore, et al. (1981)a.
| D. Lagerberg Water Well |
G. Wilgus Water Well |
Oil-field brines (10 samples) from northern Salina Field |
Samples (12) from Wellington saltwater aquifer in Saline Countyb |
|||
|---|---|---|---|---|---|---|
| Range | Average | Range | Average | |||
| Date collected, mon-day-yr |
10-12-1979 | 3-1-1983 | 2-(11-27)-1981 | 7-2-1980 to 4-16-1981 | ||
| Ca, mg/L | 520 | 1950 | 1410-4820 | 2150 | 856-2,000 | 1310 |
| Mg, mg/L | 108 | 338 | 373-1560 | 628 | 102-1,360 | 658 |
| Na, mg/L | 190 | 703 | 10,700- 31 ,600 | 16,600 | 6,250-126,000 | 63,500 |
| HCO3, mg/L | 163 | 188 | ||||
| CI, mg/L | 1400 | 5280c | 19,700-59,500 | 29,800 | 9,480-193,000 | 97,700 |
| SO4, mg/L | 45 | 90 | 740-1,350 | 990 | 1,920-11,100 | 5,820 |
| NO3, mg/L | 0.1 | 1.7 | ||||
| Br, mg/L | 20 | 70-254 | 107 | 1.8-35 | 16.5 | |
| Ca/Cl | 0.371 | 0.369 | 0.064-0.081 | 0.071 | 0.0066-0.0260 | 0.0233 |
| Mg/Cl | 0.077 | 0.064 | 0.017-0.026 | 0.020 | 0.0028-0.0143 | 0.0079 |
| Na/Cl | O. 136 | 0.133 | 0.478-0.584 | 0.561 | 0.631-0.661 | 0.649 |
| S04/Cl | 0.032 | 0.017 | 0.018-0.049 | 0.036 | 0.027-0.203 | 0.082 |
| Br/Cl x 104 | 38 | 30-43 | 35 | 1.2-2.2 | 1.7 | |
aValues for Br and Br/Cl have been revised from Whittemore et al. (1981) based on reanalyses of many samples using an improved method for bromide determination (Basel, et al., 1982).
bSamples without oil-field brine contamination.
cAverage of Kansas Department of Health and Environment and Kansas Geological Survey values.
Major constituent ratios for the two water wells are very similar, suggesting that the saltwater contamination source was the same for both. The sulfate/chloride weight ratios for the two samples were low and in the range of oil-field brines from the Salina Field. Sulfate/chloride ratios for salt waters from observation wells screened in the Wellington Formation underlying alluvial sediments in the Smoky Hill River valley in Saline County are generally higher than in the two supply waters and the oil brines. Sodium/chloride weight ratios in samples from the Wellington saltwater aquifer that are unaffected by oil-field brine vary by only ±0.02 about the theoretical value (0.649) expected for the solution of halite. In the oil-field brines, the sodium/chloride ratios are appreciably lower, but still higher than in the waters from the Wilgus and Lagerberg wells. However, this ratio is often altered by ion exchange in clay-containing sediments. Sodium is adsorbed in clays when saline waters enter sediments in equilibrium with fresher waters, then, calcium and magnesium are released to solution. Therefore, calcium/chloride and magnesium/chloride ratios increase, while sodium/chloride decreases, as shown by the values for the Wilgus and Lagerberg waters.
A more conclusive identification of the salinity source affecting the Wilgus well water is given by direct comparison of the bromide/chloride ratio with those for salt waters. The bromide/chloride value of 0.0038 (or 38 x 10-4) is in the middle of the range for oil-field brines and much higher than in the Wellington salt waters (Table 1). This is more clearly represented by a graph of bromide/chloride versus chloride concentration (Figure 1).
Figure 1--Ratios of bromide/chloride for freshwater and brine-mixing zones, Smoky Hill River valley and Saline Oil Field. Halite-solution brines shown are unaffected by oil-field brines. Symbols: ![]() observation well, + oil-field brine,
observation well, + oil-field brine, ![]() Wilgus well.
Wilgus well.
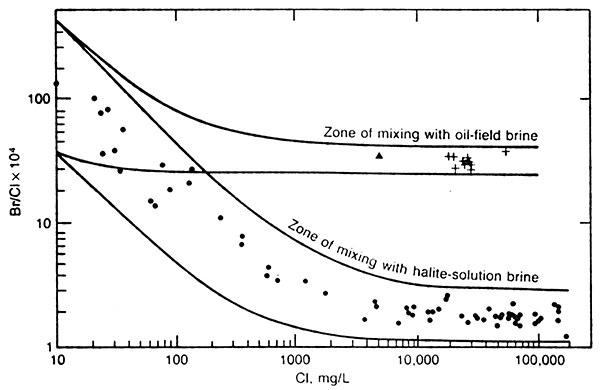
The curves in Figure 1 are the boundary lines for the zone of mixing of fresh waters in the Smoky Hill River valley with salt waters derived from solution of evaporites in the Wellington Formation (and unaffected by oil brine), and the zone of mixing of the fresh waters with the oil-field brines of Table 1. Fresh waters in the upper Wellington Formation have bromide/chloride ratios similar (at given chloride concentrations) to those in groundwaters in alluvium of the river valley. The point for the Wilgus well water falls within the zone of mixing of fresh waters with oil-field brine, and lies appreciably above the zone of mixing with halite-solution brine.
The main source of salt water contaminating the groundwater pumped from the Wilgus well is oil-field brine. The chemistry of the sample from the Lagerberg well is similar to that for the Wilgus well, indicating oil brine was also the pollution source for this water.
Dunlap, L.E., 1977, Hydrogeology in the adjacent uplands of the Saline, Smoky Hill and Solomon Rivers in Saline and Dickinson County: M.S. thesis, Kansas State University, 58 p.
Hathaway, L.R., Galle, O.K., Waugh, T.C., and Dickey, H.P., 1978, Chemical quality of irrigation waters in Ford County and the Great Bend Prairie of Kansas: Kansas Geological Survey, Chemical Quality Ser. 7, 41 p. [available online]
Whittemore, D.O., 1983, Geochemical identification of salinity sources; in, Proceedings of International Symposium on State-of-the-Art Control of Salinity, R.H. French, ed.: Ann Arbor Science, Ann Arbor, Michigan (in press).
Whittemore, D.O., Basel, C.L., Galle, O.K., and Waugh, T. C., 1981, Geochemical identification of saltwater sources in the Smoky Hill River Valley, McPherson, Saline, and Dickinson Counties, Kansas: Kansas Geological Survey, Open-File Rep. 81-6, 78 p. [available online]
Gillespie, J. B., and Hargadine, G.D., 1981, Saline ground-water discharge to the Smoky Hill River between Salina and Abiline, Central Kansas: U.S. Geological Survey, Water Resources Investigations 81-43. 71 p.
Kansas Geological Survey
Placed online Feb. 17, 2017
Comments to webadmin@kgs.ku.edu
The URL for this page is http://www.kgs.ku.edu/Hydro/Publications/1983/OFR83_15/index.htm