![]()
Prev Page--Geology || Next Page--Recharge
Ground Water
Principles of Occurrence
The following discussion of the occurrence of ground water has been adapted from Meinzer (1923, pp. 2-102) and the reader is referred to his report for a more detailed discussion.
All water beneath the surface of the earth is termed subsurface water. The part of subsurface water that is in the zone of saturation is termed ground water or phreatic water whereas subsurface water above the zone of saturation--that is, in the zone of aeration--is called suspended subsurface water or vadose water. Ground water is the water that is obtained from wells and springs.
The rocks that form the outer crust of the earth are seldom entirely solid, but have numerous open spaces, called voids or interstices, which may contain air, natural gas, oil, or water. The interstices in rocks range in size from microscopic openings to the large caverns that are found in some limestones. The open spaces are generally connected so that water may percolate from one to another, but in some rocks the interstices are isolated and the water has little or no chance to move. The occurrence of water in the rocks of any region is determined by the character, distribution, and structure of the rocks, that is, by the geological character of the region.
The porosity of a rock is its property of containing interstices. It is expressed quantitatively as the percentage of the total volume of the rock that is occupied by interstices. A rock is said to be saturated when its interstices are filled with water or other liquid and the porosity is practically the percentage of the total volume of rock that is occupied by the liquid. The porosity of a rock determines only the amount of water a given rock can bold, not the amount it may yield to wells. A rock may be very porous but may yield very little water to wells if interstices are small or disconnected. The specific yield of a water-bearing formation is defined as the ratio of the volume of water which, after being saturated, the formation will yield by gravity to its own volume. Specific yield is a measure of the yield of a water-bearing material when it is drained by a lowering of the water table. The permeability of a water-bearing material is defined as its capacity for transmitting water under hydraulic head and is measured by the rate at which the formation will transmit water through a given cross section under a given difference of head per unit of distance. A rock containing small interstices may be very porous, but water may pass through it with difficulty, whereas a coarser-grained rock, although perhaps less porous, is generally more permeable and allows water to pass through it more freely because the interstices are larger. A part of the water in all rocks is held by the force of molecular attraction, which, in fine-grained rocks, is great enough to hold most of the water against the force of gravity, thus resulting in a very low specific yield. Several common types of open spaces or interstices and the relation of texture to porosity are shown in Figure 8.
Fig. 8--Diagram showing several types of rock interstices and the relation of rock texture to porosity. A, well-sorted sedimentary deposit having a high porosity; B, poorly sorted sedimentary deposit having low porosity; C, well-sorted sedimentary deposit consisting of pebbles that are themselves porous so that the deposit as a whole has a very high porosity; D, well-sorted sedimentary deposit whose porosity has been diminished by the deposition of mineral matter in the interstices; E, rock rendered porous by solution; F, rock rendered porous by fracturing. (From O. E. Meinzer.)
The upper surface of the zone of saturation is called the groundwater table or more simply the water table. All the rocks above the water table are in the zone of aeration, which usually consists of three parts: the belt of soil water; the intermediate or vadose zone; and the capillary fringe.
The belt of soil moisture lies just below the land surface and contains water held by molecular attraction. The thickness of the soil-moisture zone is dependent upon the character and thickness of the soil and upon the precipitation and vegetation.
The intermediate zone lies between the belt of soil moisture and the capillary fringe. In this zone the interstices in the rocks contain some water held by molecular attraction but also may contain appreciable quantities of water while it is moving downward from the belt of soil water to the water table. In Sherman County the intermediate zone may be absent along some river valleys where the water table is near the surface, or it may be nearly 200 feet thick in some upland areas.
The capillary fringe lies directly above the water table where water rises from the saturated zone by capillary action. The water in the capillary fringe is not available to wells, and wells must be deepened to the saturated zone before water will enter them. The capillary fringe is thin in coarse-grained sediments, but it may be several feet thick in fine-grained sediments.
Gravel is an excellent water-bearing material. Gravel deposits of uniform texture have high porosity, high permeability, and high specific yield. In some deposits, clay, silt, or sand is mixed with the gravel, reducing its porosity, permeability, and specific yield. Most of the gravel deposits in Sherman County contain much silt and sand and some are cemented with calcium carbonate which also reduces yields of wells.
Sand ranks next to gravel as a water bearer. Sand differs from gravel in having smaller interstices; therefore it conducts water less readily and will give up a smaller proportion of water to wells. Sand consists of smaller particles than gravel and is more readily carried into wells by water, thus causing problems in connection with drilling and pumping.
Most of the ground water pumped in Sherman County comes from sand and gravel beds of the Ogallala formation with a lesser amount coming from alluvial sand and gravel. One well included in the inventory (well 11-40-1bcc, in Wallace County) is thought to derive water from the Pierre shale, which underlies the Ogallala. Shale is a very unfavorable material from which to obtain water. If not too tightly indurated, it may be highly porous and contain water. However, the interstices between individual particles are small and water is held by molecular attraction and is not readily available to wells. Some water is found in shale along joints and bedding planes.
Permeability of the Water-bearing Materials
The rate of movement of ground water is determined by the size, shape, quantity, and degree of connection of the interstices, and by the hydraulic gradient. The capacity of a water-bearing material to transmit water under hydraulic head is its permeability. The coefficient of permeability in Meinzer's units may be expressed as the rate of flow of water in gallons a day through a cross-sectional area of 1 square foot under a hydraulic gradient of 100 percent at a temperature of 60° F. (Stearns, 1927, p. 148). The coefficient of transmissibility is defined as the number of gallons of water a day transmitted through each vertical 1-foot strip extending the saturated thickness of the aquifer under a unit gradient (Theis, 1935, p. 520). The coefficient of transmissibility also may be expressed as the number of gallons of water a day transmitted through each section 1 mile wide extending the saturated thickness of the aquifer under a hydraulic gradient of 1 foot to a mile. The coefficient of transmissibility is equivalent to the coefficient of permeability multiplied by the saturated thickness of the aquifer.
Pumping Tests
The transmissibility of water-bearing materials in Sherman County was determined by three pumping tests using the recovery method involving the formula developed by Theis (1935, p. 522) and later described by Wenzel (1942, pp. 94-96). The formula as stated by Theis is as follows:
T = (264q / s) log10(t/t1)
in which T = coefficient of transmissibility, in gallons per day per foot
q = pumping rate, in gallons a minute
t = time since pumping started, in minutes
t1 = time since pumping stopped, in minutes
s = residual drawdown at the pumped well, in feet, at time t,
The residual drawdown (s) is computed by subtracting the static water level measurement from depth to water level measurements made after pumping ceases. The ratio of log10(t/t1) to s is determined graphically by plotting log10(t/t1) against corresponding values of s. This procedure is simplified by plotting log10(t/t1) on the logarithmic coordinate and s on the arithmetic co-ordinate of semi-logarithmic paper (Fig. 9). If log10(t/t1) is taken over one log cycle it will become unity and s will be the difference in drawdown over one log cycle.
Fig. 9--Curve for pumping test on well 7-39-20bad obtained by plotting residual drawdown against t/t1.
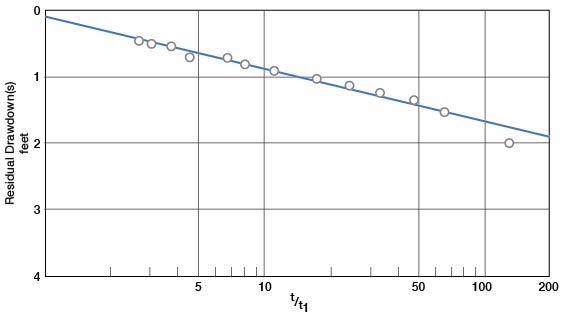
Well 7-39-20bad, an irrigation well on the Rhoads farm, was pumped for approximately 4 hours on July 29, 1949. Drawdown measurements, using the wetted tape method, were made during the period of pumping, and recovery measurements were made for 2 1/2 hours after the pump was shut down. The average pumping rate was 1,170 gallons a minute (determined by a Collins flow gage). The drawdown at the end of pumping was about 16 feet and the specific capacity (determined by dividing the yield by the drawdown) was about 73 gallons a minute for each foot of drawdown.
The computations for transmissibility and permeability are as follows:
T = (264 x 1,170 x 1) / 0.78 = 396,000 gpd / ft
P = 396,000 / 120 = 3,300 gpd / sq. ft
The transmissibility is computed as 396,000 gallons per day per foot and the coefficient of permeability, determined by dividing the transmissibility by the thickness of the aquifer, which is 120 feet, is 3,300 gallons per day per square foot.
The time versus drawdown curve for the pumping test on well 7-39-20bad is shown in Figure 9 and data that were plotted to obtain this curve are shown in Table 3. Data on two other pumping tests are given in Tables 4 and 5 and results of all three tests are given in Table 6.
Table 3--Data on pumping test of well 7-39-20bad, made on July 29, 1949.
| Time since pumping started, minutes |
Time since pumping stopped, minutes |
t/t1 | Depth to water level, feet |
Drawdown, feet |
|---|---|---|---|---|
| 22.23 (static water level) | ||||
| 10 | 38.40 | 15.17 | ||
| 40 | 37.40 | 15.17 | ||
| 70 | 38.00 | 15.77 | ||
| 100 | 38.00 | 15.77 | ||
| 130 | 38.00 | 15.77 | ||
| 160 | 38.00 | 15.77 | ||
| 190 | 37.82 | 14.59 | ||
| 220 | ||||
| 250 | 37.00 | 15.67 | ||
| 261 | 2 | 130.5 | 24.27 | 2.04 |
| 263 | 4 | 65.8 | 23.78 | 1.55 |
| 265 | 6 | 44.1 | 23.61 | 1.38 |
| 267 | 8 | 33.4 | 23.49 | 1.26 |
| 270 | 11 | 24.5 | 23.38 | 1.15 |
| 275 | 16 | 17.2 | 23.29 | 1.06 |
| 285 | 26 | 11.0 | 23.16 | 0.93 |
| 295 | 36 | 8.2 | 23.08 | 0.85 |
| 310 | 51 | 6.8 | 22.98 | 0.75 |
| 330 | 71 | 4.6 | 22.S7 | 0.64 |
| 350 | 91 | 3.8 | 22.80 | 0.57 |
| 380 | 121 | 3.1 | 22.75 | 0.52 |
| 410 | 151 | 2.7 | 22.70 | 0.47 |
Table 4--Data on pumping test of well 8-39-15ccc, made on August 4, 1949.
| Time since pumping started, minutes |
Time since pumping stopped, minutes |
t/t1 | Depth to water level, feet |
Drawdown, feet |
|---|---|---|---|---|
| 127.78 (static water level) | ||||
| 20 | 158.00 | 30.22 | ||
| 50 | 158.00 | 30.22 | ||
| 80 | 160.00 | 32.22 | ||
| 110 | 159.20 | 31.42 | ||
| 140 | 158.75 | 30.97 | ||
| 170 | 159.50 | 31.72 | ||
| 200 | 158.00 | 30.22 | ||
| 230 | ||||
| 260 | 160.00 | 32.22 | ||
| 290 | 157.55 | 29.77 | ||
| 325 | ||||
| 350 | 160.70 | 32.92 | ||
| 380 | 156.25 | 28.47 | ||
| 410 | 158.70 | 30.92 | ||
| 450 | 160.00 | 32.22 | ||
| 470 | 160.00 | 32.22 | ||
| 500 | 160.00 | 32.22 | ||
| 530 | 160.00 | 32.22 | ||
| 560 | 162.00 | 34.22 | ||
| 598 | 3 | 199.3 | 154.42 | 26.64 |
| 600 | 5 | 120.0 | 135.39 | 7.61 |
| 602 | 7 | 86.0 | 134.50 | 6.72 |
| 604 | 9 | 67.1 | 133.96 | 6.18 |
| 606 | 11 | 55.1 | 133.50 | 5.72 |
| 616 | 21 | 29.3 | 132.10 | 4.32 |
| 622 | 27 | 23.0 | 131.49 | 3.71 |
| 625 | 30 | 20.8 | 131.27 | 3.49 |
| 632 | 37 | 17.1 | 130.85 | 3.07 |
| 646 | 51 | 12.7 | 130.26 | 2.4S |
| 664 | 69 | 9.6 | 129.77 | 1.99 |
| 686 | 91 | 7.5 | 129.40 | 1.62 |
| 713 | 118 | 6.0 | 129.11 | 1.33 |
| 741 | 146 | 5.1 | 128.95 | 1.17 |
Table 5--Data on pumping test of well 8-40-12dba, made on July 27, 1949.
| Time since pumping started, minutes |
Time since pumping stopped, minutes |
t/t1 | Depth to water level, feet |
Drawdown, feet |
|---|---|---|---|---|
| 122.76 (static water level) | ||||
| 19 | 132.00 | 9.24 | ||
| 49 | 132.00 | 9.24 | ||
| 84 | 131.72 | 8.96 | ||
| 109 | 128.70 | 5.94 | ||
| 139 | 131.90 | 8.14 | ||
| 169 | 135.00 | 12.24 | ||
| 199 | 131.66 | 8.90 | ||
| 229 | 131.63 | 8.87 | ||
| 259 | 131.00 | 8.24 | ||
| 267 | 3 | 89.0 | 126.29 | 3.53 |
| 269 | 15 | 53.8 | 125.35 | 2.59 |
| 271 | 7 | 38.7 | 124.85 | 2.09 |
| 277 | 13 | 21.3 | 124.12 | 1.36 |
| 284 | 20 | 14.2 | 123.76 | 1.00 |
| 294 | 30 | 9.8 | 123.48 | 0.72 |
| 315 | 51 | 6.1 | 123.28 | 0.52 |
| 349 | 85 | 4.1 | 123.12 | 0.36 |
| 412 | 148 | 2.8 | 123.00 | 0.24 |
| 484 | 220 | 2.2 | 122.94 | 0.18 |
Table 6--Results of pumping tests made on wells in Sherman County, using Theis recovery method for determining permeability.
| Well number |
Average discharge, gallons a minute |
Drawdown, feet |
Duration of pumping, minutes |
Specific capacity (1) |
Coefficient of transmissibility (2) |
Approximate thickness of water-bearing material, feet |
Coefficient of permeability (3) |
|---|---|---|---|---|---|---|---|
| 7-39-20bad | 1,170 | 16 | 259 | 73 | 396,000 | 120 | 3,300 |
| 8-39-15ccc | 640 | 32 | 595 | 20 | 34,000 | 127 | 266 |
| 8-40-12dba | 315 | 9 | 264 | 35 | 36,000 | 117 | 309 |
| 1. The specific capacity of a well is its rate of yield per unit of drawdown and is determined by dividing the tested capacity in gallons a minute by the drawdown in feet. 2. The coefficient of transmissibility is expressed as the number of gallons of water a day transmitted through each 1 mile wide section of the saturated thickness of the aquifer, under a hydraulic gradient of 1 foot to the mile. 3. Coefficient of transmissibility divided by thickness of saturated water-bearing material. |
|||||||
Graphical methods developed by Jacob (1944, 1946) for determining permeability were also used in determining permeability of water-bearing materials near wells 7-39-20bad and 8-39-15ccc. Near well 7-39-20bad, two observation wells were drilled at distances of 100 and 200 feet north of the pumped well, and water-level measurements were made during the period of pumping and after pumping ceased. Drawdown at any given time in each observation well was plotted against distance from the pumped well on semi-logarithmic paper and transmissibility was computed by use of the formula
T = 527.7 Q [(log10r2 - log10r1) / (s1 - s2)]
Another method of analysis, in which time since pumping began is plotted against drawdown on semi-logarithmic paper, was also used. Only one observation well is needed for these calculations. Results obtained for well 7-39-20bad and well 8-39-15ccc (where only one observation well was drilled) were very similar to those obtained using the Theis recovery method. Values given by using the distance-drawdown method for well 7-39-20bad do not correspond with results determined by the other two methods and are thought to be in error, perhaps because the period of pumping was not long enough.
The Water Table and Movement of Ground Water
Shape and Slope
The water table is defined as the upper surface of the zone of saturation except where that surface is formed by an impermeable body (Meinzer, 1923a, p. 32). The shape and slope of the water table are shown by the contour lines on Plate 1. Water-table contour lines connect points of equal altitude and these lines show the configuration of the water surface just as topographic maps show the shape of the land surface. As indicated by Plate 1, the water table is not a plane surface in all parts of the county, but rather has irregularities roughly comparable to the land surface although the water table is not as rugged. The water table does not remain stationary but fluctuates due to variations in discharge and recharge. Ground water moves at right angles to the water-table contour lines in the direction of greatest downward slope.
Plate 1 indicates that ground water is moving through Sherman County in a general easterly or northeasterly direction. In southeastern Sherman County, the water table slopes southeastward. The slope of the water table seems to be controlled to some extent by the slope of the bedrock surface, for in general, the water table slopes in the direction of the slope of the bedrock floor (Fig. 7). Other factors that influence the shape and slope of the water table include: local differences in the permeability of water-bearing deposits, discharge of ground water into streams, transpiration, evaporation, pumpage, and recharge of ground water by streams.
The slope of the water table varies from place to place, but the average slope is about 15 feet to the mile in a general northeasterly direction. Ordinarily, the slope of the water table varies inversely with the permeability of the water-bearing materials. In areas where the water-bearing beds are relatively impermeable, the slope of the water table steepens, but in areas of more permeable water-bearing beds, the slope of the water table is flatter.
The discharge of ground water into streams influences the slope of the water table in Sherman County only along the eastern part of the North Fork Smoky Hill River. Here the water table slopes downward to the stream level causing the upstream flexure of the contour lines shown in Plate 1.
Recharge of ground water by ephemeral streams is probably not an important factor in the formation of any permanent irregularities in the water table. Ephemeral or intermittent streams flow only after rains. Their channels lie above the water table and are dry most of the time. In Sherman County alluvial deposits contain much sand and gravel and after rains when ephemeral streams are flowing, it is probable that much water seeps into the stream bed and moves downward to the water table. This would cause a temporary mound or ridge on the water table, but such an irregularity would not be permanent and probably would not be evident on a small-scale map such as Plate 1. The movement of ground water from influent (losing) streams and to effluent (gaining) streams is shown by the diagrammatic sections in Figure 10.
Fig. 10--Diagrammatic sections showing influent and effluent streams. (From O.E. Meinzer.)
Fluctuations in the Water Table
The water table is not a static surface but a surface that fluctuates much like the surface of a lake. The water table rises when the amount of recharge exceeds the amount of discharge and declines when the discharge is greater than the recharge. The fluctuations of the water table indicate in part the extent to which the ground-water reservoir is being depleted or replenished.
The main factors controlling the rise of the water table in Sherman County are the amount of precipitation within the county that penetrates the ground and reaches the zone of saturation, the amount of seepage that reaches the underground reservoir from surface streams, and the amount that enters the county from the west. Factors controlling the decline of the water table are pumpage from wells, seeps and springs, evaporation and transpiration in areas where the water table is near the surface, seepage into streams, and movement of ground water from the county to adjacent areas.
Periodic water-level measurements were begun in three observation wells in Sherman County in 1948 to obtain information concerning the fluctuations of the water table. The water-level measurements will appear in forthcoming annual water-level reports of the U. S. Geological Survey.
Prev Page--Geology || Next Page--Recharge
Kansas Geological Survey, Geology
Placed on web Aug. 1, 2008; originally published Nov. 1953.
Comments to webadmin@kgs.ku.edu
The URL for this page is http://www.kgs.ku.edu/General/Geology/Sherman/05_gw.html