![]()
Prev Page--Ground-water Principles and Water Table || Next Page--Chemical character
Ground Water, continued
Ground-water Recharge
Recharge is the addition of water to the ground-water reservoir and may occur in several ways. The original source of all recharge is precipitation; however, in addition to direct infiltration of precipitation through the soil and subsoil, a ground-water reservoir may be recharged locally by the infiltration of water from streams, by return of irrigation water applied on the surface, or by subsurface inflow of water from adjacent areas. In Kingman County irrigation is not widely practiced, so that recharge by return of irrigation water is negligible. The annual quantity of recharge in Kingman County is not known, but it is believed to be a small percentage of the total precipitation that falls in the county. Nevertheless, recharge must amount to several tens of thousands of acre-feet per year.
Infiltration of Precipitation in Upland Areas
For the purpose of this discussion the "upland areas" of Kingman County include the relatively flat divide areas between major streams where not deeply dissected by tributary streams. Upland areas occupy less than a fifth of the total area of the county. Recharge in the uplands results chiefly from percolation of precipitation that falls on the area, but there is some subsurface inflow from Pratt County on the west. In those areas in the western half of the county that are underlain by deposits of Nebraskan and Kansan age (Pl. 1), the beds of silt and clay that lie above the water table retard the downward percolation of water. The rate of recharge in this area, therefore, is controlled by the vertical permeability of these beds. The shape of the water table (Pl. 3) shows, however, that recharge does occur in these areas, as the movement of ground water toward points of discharge starts in the divide areas. In the uplands in the eastern half of the county, silt and clay beds are not extensive in the subsurface, and the rate of recharge is probably greater.
Influent Seepage from Streams
South Fork of Ninnescah River and its main tributaries (Smoots and Painter Creeks) and Chikaskia River and its main tributary (Sand Creek) are all effluent streams--that is, they have cut their channels below the water table throughout their courses in Kingman County and thus generally receive water from rather than add water to the zone of saturation. Deposits adjacent to the channels are recharged during flood stages on these streams, but the water represents temporary "bank" storage and returns to the stream soon after the flood. The smaller tributaries to these streams, however, which head near the upland divides, lie above the water table in their upper reaches. Where these tributaries have cut their channels into beds of permeable sand and gravel, the ground-water reservoir is recharged when surface runoff is available in the streams.
Subsurface Inflow
Subsurface inflow to an area results from the movement of ground water downgradient toward areas of discharge. Ground water moves into Kingman County along the western border of the county and locally along the eastern part of the northern border. The quantity of subsurface inflow to the county is not known but is estimated to be on the order of 100 acre-feet per day (1 acre-foot equals 325,850 gallons).
Ground-water Discharge
When water derived from precipitation or other sources reaches the zone of saturation it immediately starts moving down the slope of the water table toward a point of discharge. The water remains a part of the ground-water body until discharged by natural or artificial means. Water may be discharged from an aquifer by evaporation, by transpiration, by seepage into streams or drains, through springs, or by pumping from wells. Over a period of years or a climatic cycle under natural conditions the amount of water discharged from an aquifer is approximately equal to the quantity of recharge.
Transpiration and Evaporation
Ground water may be taken up by the roots of plants directly from the zone of saturation, or from the capillary fringe above it, and discharged into the atmosphere by the process of transpiration. The depth from which plants will lift ground water differs with the plant species and the type of soil in which it grows. Most grasses and cultivated crops will not lift water more than a few feet; however, alfalfa and some desert plants have been known to extend their roots to depths of 60 feet or more to reach the water table. Where the water table is near the surface, ground water may be discharged directly by evaporation.
Significant quantities of ground water are discharged in Kingman County by evaporation and transpiration in the valleys of the major streams where the depth to water is generally less than 10 feet. The quantity of ground water discharged in this manner is difficult to determine but probably exceeds the discharge by all other means combined. After the first killing frost in the fall, when evaporation and transpiration generally cease, South Fork of Ninnescah River and Chikaskia River show an appreciable increase in flow, which can be accounted for only by increased discharge to these streams of ground water ordinarily discharged by plant transpiration and evaporation.
Springs and Seeps
Streamflow at low stages in South Fork of Ninnescah River, Chikaskia River, and their major tributaries is maintained by groundwater discharge. Water is discharged into these streams mainly as seeps along stream channels, but there are many springs along the valley walls where the stream channels intercept the water table and also at the contact of unconsolidated water-bearing material and the relatively impermeable Permian redbeds. Many of the seeps and springs in Kingman County continue to discharge ground water even during periods of drought, and the shallow ground water along the streams supports a heavy growth of vegetation. Whenever the supply of ground water is greater than the amount required by vegetation along the stream courses, the excess contributes to the flow of the stream. The amount of discharge through seeps and springs in Kingman County is not known but is believed to be large.
Wells
Ground water is pumped for municipal, domestic, stock, irrigation, and industrial use in Kingman County. The total withdrawal of water from wells in Kingman County is estimated to be about 5,600 acre-feet per year. Natural discharge of ground water in Kingman County greatly exceeds withdrawal from wells.
Subsurface Outflow
Subsurface outflow of ground water occurs near the west end of the north border and along the east edge of Kingman County. The areas where ground water is discharged in this manner are small and the quantity discharged is not believed to be significant. Thus, ground water is discharged from the county mainly by evapotranspiration and by effluent flow into streams that leave the county.
Recovery of Ground Water
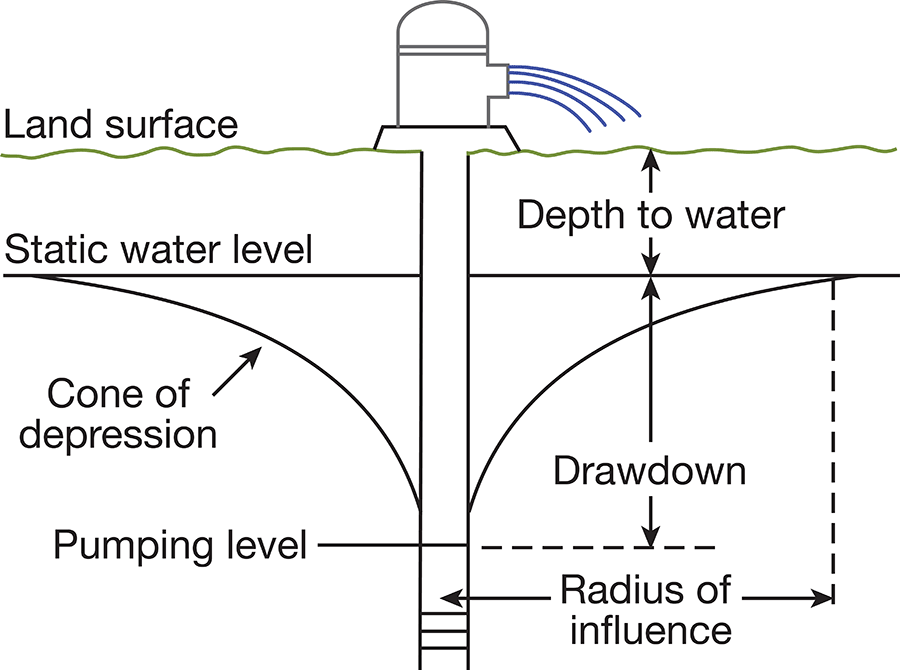
When water is pumped from a well, the head becomes lower in the well than outside, and water moves toward the well. The water table or piezometric surface for some distance surrounding the pumped well is lowered, assuming the approximate shape of an inverted cone whose apex is at the well. This is called the cone of depression (Fig. 9). The size and shape of the cone of depression surrounding a pumped well are determined by the transmissibility of the water-bearing formation, and the extent to which the well penetrates the formation, the rate at which water is being pumped, and the length of time that the well is pumped. The cone of depression around a pumped well will increase in depth and area until it intercepts enough recharge or reduces natural discharge by an amount sufficient to supply the demand of the well. The distance from the pumped well to a point where the drawdown of the water level on the cone of depression is zero is called the radius of influence of the well. If pumping from the well is stopped, water will continue to move toward the well, and the cone of depression created by pumping will be filled. For a short time after pumping is stopped, while the slope of the cone of depression is near the maximum, the movement of water into the cone of depression will be rapid. As the cone of depression fills and its slope becomes less, the rate of water movement into the cone decreases and the rate of recovery of the water level near the well becomes slow. If pumping from the well is not resumed, the water table or piezometric surface surrounding the well win in time return to its original position.
Figure 9--Diagrammatic section of well that is being pumped, showing its drawdown, cone of depression, and radius of influence.
If wells are spaced close together, as in a well field or an intensively irrigated area, the cone of depression created by each well may overlap those of adjacent wells, causing mutual interference among the wells (Fig. 10). When mutual interference occurs the drawdown at any point within the radius of influence of the wells is the sum of the drawdowns caused by each individual well at that point. Thus, when wells interfere, the pumping lift in each well is increased and the discharge is decreased. Also, to maintain a constant discharge from the wells the drawdown caused by pumping each well must be greater and the volume of the cone of depression for each well will be greater. In areas where many wells are pumping from the same aquifer, the large cone of depression resulting from mutual interference may not have sufficient time to recover between pumping periods and the water level may decline persistently.
Figure 10--Diagrammatic section of two closely spaced pumping wells, showing mutual interference between wells and the resulting cone of depression.
Utilization of Ground Water
Domestic and Stock Supplies
Most domestic and stock water supplies in Kingman County are obtained from wells. Ponds are used in some places to supply stock water, but most of the ponds that provide a perennial water supply are constructed on small streams fed by springs and, therefore, represent ground water. The ground water in the county generally is suitable for domestic use, although adjacent to South Fork of Ninnescah River the water in the alluvial fill has been polluted by water containing much sodium chloride (common salt) from the river, which drains an area of salt marshes in Pratt County. Few if any domestic supplies are obtained from this source, however, and the water is suitable for livestock. The supply of ground water available in Kingman County is adequate for all domestic and stock use, except in small areas where Permian rocks are at the surface and form steep slopes.
Public Water Supplies
Three communities in Kingman County have public water supplies. Descriptions of the water systems in these communities follow, and additional information may be found in the table of well records at the end of this report.
Kingman--Kingman, the largest city in Kingman County, is supplied with water from three springs about 3 miles west of the city and from five wells in terrace deposits of South Fork of Ninnescah River in the city. The springs west of the city issue at the contact between Pleistocene sand and gravel and the underlying Permian rocks. Each spring is equipped with a concrete collecting box from which tile collectors radiate. The three springs have a combined yield of about 200 gpm (gallons per minute) in years of normal precipitation and about 300 gpm in wet years. The water is piped to the city by gravity flow and is stored in an underground reservoir of 0.5-million-gallon capacity. The spring supply is not adequate during periods of peak demand and is supplemented with water from the five wells in the city. Two of the five city wells are 3-inch driven wells pumped with a single centrifugal pump and have a combined yield of about 190 gpm. Three of the wells are drilled gravel-walled wells equipped with electric turbine pumps and each has an average yield of about 275 gpm. The wells produce water that has an objectionable chloride content and the water is mixed with that from the city springs before distribution. The water is not treated except for chlorination and is pumped directly into the mains, the excess going to a 70,000-gallon elevated storage tank. Water use by the city ranges from about 0.3 million gpd (gallons per day) in March to about 1.2 million gpd in July.
Norwich--The city of Norwich is supplied with water from two gravel-walled wells 98 feet deep. One well pumping about 100 gpm is adequate to meet the demand and the second well is normally used as a standby. The water is chlorinated and pumped directly into the mains, the excess going to a 50,000-gallon elevated storage tank. Use of water by the city is reported to range from about 30,000 to 140,000 gpd.
Cunningham--The city of Cunningham is supplied with water from two gravel-walled wells 59 and 60 feet deep. The wells yield about 200 gpm; one normally meets the demand and the second is used as a standby. The water is chlorinated and pumped directly into the mains, the excess going to a 50,000-gallon elevated storage tank. Use of water by the city is reported to range from about 15,000 to 75,000 gpd.
Industrial Supplies
Kingman County is not an industrialized area, and only two industrial wells currently in operation were inventoried during the investigation for this report. A gas compressor station owned by the Drillers Gas Co. in the NW NW NE sec. 33, T. 27 S., R. 5 W., is supplied with cooling water from a well 65 feet deep in terrace deposits bordering Smoots Creek. The well is reported to yield 350 gpm and is pumped continuously. A gas compressor station owned by the Kansas Power and Light Co. in the SW SW SW sec. 6, T. 28 S., R. 8 W., is supplied with water from a gravel-walled well 82 feet deep in sand and gravel of Pleistocene age. The well is reported to yield 200 gpm.
Irrigation Supplies
Irrigation with ground water was not practiced in Kingman County prior to the drought beginning in 1952. By the end of 1956 there were in operation 14 irrigation plants utilizing ground water, and 6 additional irrigation wells have been installed in the county since completion of field work for this report. Information on 11 of these irrigation plants is reported in the well tables at the end of this report.
The yields of irrigation wells in the county range from about 100 to 700 gpm. Sprinkler irrigation is used throughout the county, as the topography of much of the county and the quantity of water available generally are not suitable for ditch irrigation. Figure 11 shows the locations of ground-water irrigation plants in the county, including those not included in Table 7, and, by patterns, the quantity of water generally available from wells in the county. Some irrigation plants producing water from relatively thin terrace deposits along Smoots Creek and Chikaskia River, in the eastern part of Kingman County, use multiple-well systems because yields of individual wells are not adequate. Where multiple-well systems are used in thin aquifers, the spacing between wells should be sufficient to reduce mutual interference between wells to a minimum.
Figure 11--Outline map of Kingman County showing location of irrigation plants using ground water, and yields generally available from wells in the county. A larger version of this figure is available as an Acrobat PDF file (1 MB).
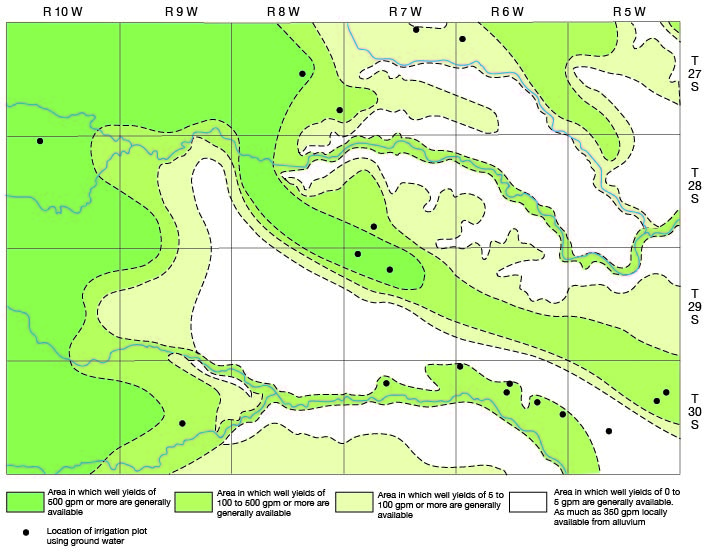
Table 4--Analyses of water from wells, springs, and rivers in Kingman County Analyzed by Howard A. Stoltenberg. Dissolved constitutents given in parts per million. One part per million is equivalent to one pound of substance per million pounds of water or 8.33 pounds per million gallons of water.
| Well no. | Location | Depth (feet) |
Geologic source | Date of collection |
Temp. (°F) |
Dissolved solids |
Silica (SiO2) |
Iron (Fe) |
Calcium (Ca) |
Magnesium (Mg) |
Sodium and potassium (Na+K) |
Bicarbonate (HCO3) |
Sulfate (SO4) |
Chloride (Cl) |
Fluoride (F) |
Nitrate (NO3) |
Hardness as CaCO3 | ||
|---|---|---|---|---|---|---|---|---|---|---|---|---|---|---|---|---|---|---|---|
| Total | Car- bonate |
Noncar- bonate |
|||||||||||||||||
| T. 27 S., R. 5 W. | |||||||||||||||||||
| 27-5-3ccc | SW SW SW sec. 3 | 37 | Holdrege Formation | 10-21-1955 | 61 | 198 | 24 | 0.18 | 40 | 5.4 | 20 | 167 | 4.1 | 9.0 | 0.2 | 13 | 122 | 122 | 0 |
| 27-5-36aab | NW NE NE sec. 36 | 42 | Ninnescah Shale | 10-21-1955 | 62 | 302 | 16 | .77 | 55 | 19 | 24 | 237 | 36 | 9.0 | .3 | 26 | 215 | 194 | 21 |
| T. 27 S., R. 6 W. | |||||||||||||||||||
| 27-6-6ccd | SE SW SW sec. 6 | 30 | Crete (?) Formation | 10-18-1956 | 64 | 604 | 27 | 1.6 | 86 | 29 | 58 | 89 | 322 | 34 | .4 | 3.6 | 334 | 73 | 261 |
| T. 27 S., R. 7 W. | |||||||||||||||||||
| 27-7-3adc | SW SE NE sec. 3 | 55 | Crete (?) Formation | 10-18-1956 | 61 | 343 | 20 | .08 | 68 | 13 | 35 | 279 | 19 | 15 | .4 | 35 | 223 | 223 | 0 |
| T. 27 S., R. 8 W. | |||||||||||||||||||
| 27-8-15ddb | NW SE SE sec. 15 | 50 | Holdrege Formation | 10-12-1956 | 63 | 287 | 21 | .10 | 69 | 4.9 | 24 | 228 | 7.8 | 18 | .2 | 30 | 192 | 187 | 5 |
| 27-8-31cca | NE SW SW sec. 31 | 66 | Holdrege Formation | 10-12-1956 | 59 | 274 | 20 | .03 | 49 | 4.9 | 40 | 176 | 13 | 38 | 1 | 22 | 142 | 142 | 0 |
| T. 27 S., R. 9 W. | |||||||||||||||||||
| 27-9-18dcc | SW SW SE sec. 18 | 82 | Holdrege Formation | 10-10-56 | 63 | 262 | 18 | .05 | 65 | 4.9 | 15 | 181 | 20 | 8.0 | .3 | 42 | 182 | 148 | 34 |
| T. 27 S., R. 10 W. | |||||||||||||||||||
| 27-10-32dec1 | SW SW SE sec. 32 | 60 | Grand Island Formation | 1956 | 261 | 19 | .15 | 66 | 6.7 | 14 | 222 | 7.0 | 11 | .4 | 19 | 192 | 182 | 10 | |
| T. 28 S., R. 6 W. | |||||||||||||||||||
| 28-6-12cdd | SE SE SW sec. 12 | 67 | Ninnescah Shale | 10-20-1955 | 62 | 497 | 13 | .30 | 84 | 39 | 29 | 305 | 21 | 50 | .4 | 111 | 370 | 250 | 120 |
| 28-6-25bbc | SW NW NW sec. 25 | Ninnescah River | 10-15-1956 | 1,200 | 7.0 | .35 | 64 | 14 | 377 | 183 | 70 | 575 | .4 | 1.8 | 217 | 150 | 67 | ||
| T. 28 S., R. 7 W. | |||||||||||||||||||
| 28-7-30ddd | SE SE SE sec. 30 | 65 | Holdrege Formation | 10-13-1956 | 152 | 24 | .19 | 23 | 6.5 | 13 | 88 | 4.1 | 8.0 | .2 | 30 | 84 | 72 | 12 | |
| T. 28 S., R. 8 W. | |||||||||||||||||||
| 28-8-2ccc | SW SW SW sec. 2 | Holdrege Formation | 10-15-1956 | 62 | 202 | 20 | .43 | 37 | 6.2 | 19 | 124 | 14 | 12 | .2 | 32 | 118 | 102 | 16 | |
| T. 28 S., R. 10 W. | |||||||||||||||||||
| 28-10-5dbb | NW NW SE sec. 5 | 96 | Grand Island Formation | 10-11-1956 | 64 | 231 | 20 | .05 | 61 | 5.4 | 12 | 194 | 7.0 | 15 | .3 | 15 | 174 | 159 | 15 |
| T. 29 S., R. 7 W. | |||||||||||||||||||
| 29-7-9baa | NE NE NW sec. 9 | 132 | Holdrege Formation | 10-9-1956 | 64 | 267 | 23 | .09 | 61 | 4.9 | 29 | 249 | 2.5 | 16 | .2 | 7.5 | 172 | 172 | 0 |
| 29-7-10abb | NW NW NE sec. 10 | 33 | Holdrege Formation | 8-9-1956 | 60 | 197 | 22 | .08 | 35 | 8.9 | 13 | 107 | 9.5 | 14 | .1 | 42 | 124 | 88 | 36 |
| 29-7-24dba | NE NW SE sec. 24 | 34 | Holdrege Formation | 8-4-1956 | 62 | 254 | 19 | 2.9 | 56 | 6.5 | 27 | 210 | 13 | 27 | .2 | 1.9 | 166 | 166 | 0 |
| 29-7-26abb | NW NW NE sec. 26 | Ninnescah Shale | 8-4-1956 | 61 | 296 | 22 | .08 | 56 | 11 | 37 | 259 | 16 | 24 | .2 | 2.4 | 184 | 184 | 0 | |
| T. 29 S., R. 9 W. | |||||||||||||||||||
| 29-9-35ccb | NW SW SW sec. 35 | Chikaskia River | 10-13-1956 | 262 | 19 | .37 | 66 | 7.7 | 18 | 244 | 12 | 12 | .4 | 6.2 | 196 | 196 | 0 | ||
| T. 29 S., R. 10 W. | |||||||||||||||||||
| 29-10-24bc | SW NW sec. 24 | 40 | Grand Island Formation | 8-2-1956 | 60 | 208 | 20 | .09 | 41 | 4.8 | 21 | 144 | 13 | 11 | .2 | 26 | 122 | 148 | 4 |
| T 30 S., R. 5 W. | |||||||||||||||||||
| 30-5-3cdd1 | SE SE SW sec. 3 | 100 | Holdrege Formation | 1956 | 196 | 21 | .06 | 30 | 6.1 | 13 | 68 | 21 | 13 | .2 | 38 | 100 | 44 | 56 | |
| 30-5-12cca | NE SW SW sec. 12 | 63 | Holdrege Formation | 9-29-1955 | 62 | 232 | 24 | .54 | 39 | 6.9 | 28 | 168 | 7.0 | 11 | .3 | 33 | 126 | 126 | 0 |
| 30-5-30aaa2 | NE NE NE sec. 30 | 14 | Colluvium | 9-29-1955 | 68 | 225 | 15 | .12 | 42 | 14 | 16 | 174 | 13 | 17 | .2 | 22 | 162 | 142 | 20 |
| 30-5-35cbb | NW NW SW sec. 35 | 60 | Ninnescah Shale | 10-9-1956 | 64 | 1,920 | 13 | .11 | 278 | 76 | 225 | 156 | 1,035 | 190 | .5 | 26 | 1,010 | 128 | 878 |
| T. 30 S., R. 6 W. | |||||||||||||||||||
| 30-6-21cda | NE SE SW sec. 21 | 35 | Harper Siltstone | 10-20-1955 | 62 | 481 | 12 | .74 | 74 | 39 | 37 | 298 | 120 | 24 | .6 | 27 | 345 | 244 | 101 |
| T. 30 S., R. 9 W. | |||||||||||||||||||
| 30-9-22db | NW SE sec. 22 | Holdrege Formation | 10-13-1956 | 263 | 24 | .54 | 66 | 5.7 | 18 | 232 | 11 | 9.0 | .2 | 15 | 188 | 188 | 0 | ||
Prev Page--Ground-water Principles and Water Table || Next Page--Chemical character
Kansas Geological Survey, Geology
Placed on web Sept. 8, 2008; originally published March 1960.
Comments to webadmin@kgs.ku.edu
The URL for this page is http://www.kgs.ku.edu/General/Geology/Kingman/05_gw2.html