![]()
Prev Page--Geology || Next Page--Recharge, Discharge, and Utilization
Ground Water
Principles of Occurrence
The fundamental principles governing the occurrence and movement of ground water were described by Meinzer (1923), and as they apply to Kansas were summarized by Moore (1940). These principles will be discussed only briefly here; for a more detailed discussion the reader is referred to the reports by Meinzer and by Moore.
Figure 5 is a diagram of the hydrologic cycle adapted by S. W. Lohman of the U. S. Geological Survey and depicts the part of ground water in the circulation of water near the surface of the earth. Ground water is derived chiefly from water that falls as rain or snow. A part of this water runs off directly in streams to the sea, a part evaporates, a part is transpired by plants, and a part sinks through pore spaces in the soil and underlying rocks to become subsurface water. Figure 6 depicts graphically the divisions of subsurface water as they generally occur.
Figure 5--Diagram of the hydrologic cycle (From Lohman, 1953). Solid flow lines indicate movement of water as a liquid, broken lines, movement as vapor. Heavy flow lines indicate man's principal changes in the natural cycle.
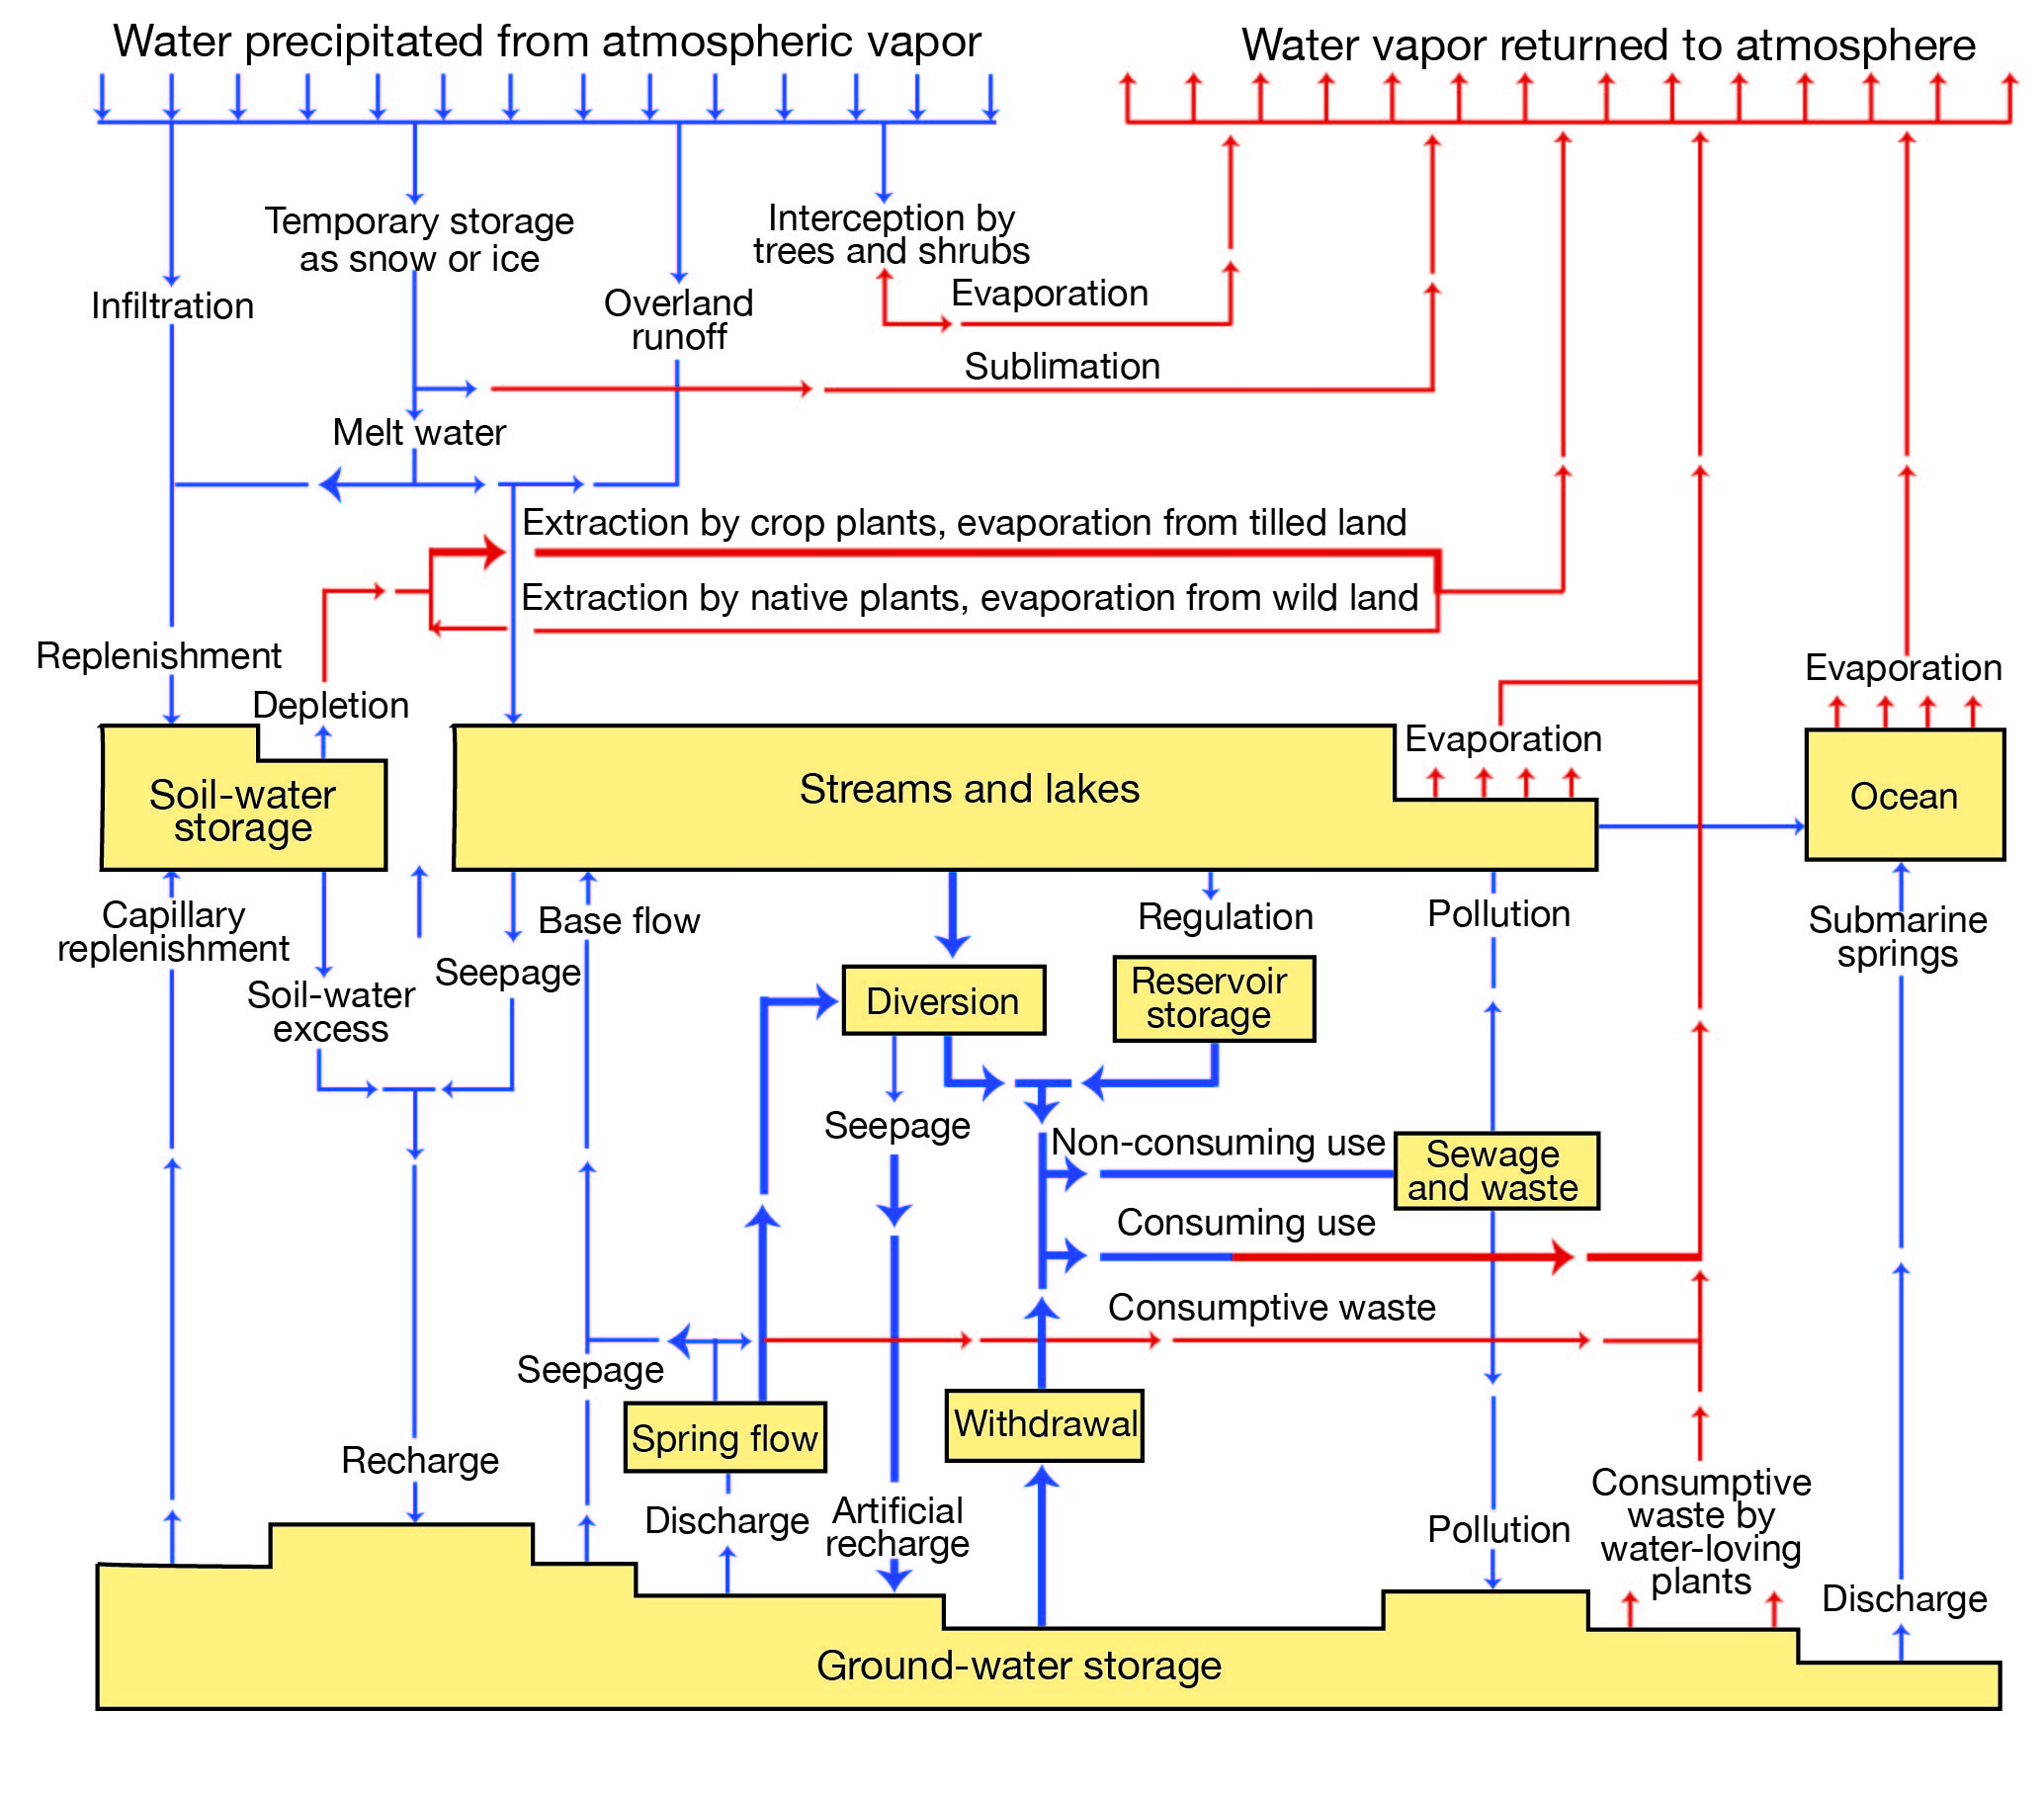
Figure 6--Diagram showing divisions of subsurface water. (After Meinzer, 1923b)
Subsurface water can be divided into two zones, the zone of areation, or vadose zone, and the zone of saturation. Within the zone of aeration are three belts, the belt of soil water, the intermediate belt, and the capillary fringe. The belt of soil water is that part, directly below the surface, from which water is discharged into the atmosphere by plants or by direct evaporation from the soil. The water in this belt is of great importance to the agriculturist, for it is the water near enough to the surface to be available to plant roots. The capillary fringe is a belt that overlies the zone of saturation and contains pores some or all of which are filled with water that is continuous with the zone of saturation but is held above that zone by capillarity acting against gravity. The thickness of the capillary fringe depends upon the texture of the rock or soil in which it occurs, being greatest in fine-grained material having small pores. The water in the capillary fringe is called fringe water. The intermediate belt of the zone of aeration is the part that lies between the belt of soil water and the capillary fringe. Water that sinks into this belt is either drawn downward by gravity to the zone of saturation, is retained within the belt by molecular attraction as a coating on individual grains or a meniscus at grain contacts, or returns to the surface by capillary or vapor flow. Water in the intermediate belt is called intermediate vadose water. Both the belt of soil water and the capillary fringe are limited in thickness by local conditions, such as the character of vegetation and texture of rock or soil, but the intermediate belt is not thus limited and may be absent or may be several hundred feet thick.
The top of the zone of saturation is marked by the water table, below which all connected pore spaces are filled with water under hydrostatic pressure. Water within this zone is free to move under the force of gravity, and it is only from the zone of saturation that wells are able to derive water. The water in the zone of saturation is called ground water.
Below the zone of saturation is the zone of rock flowage, in which temperature and pressure are such that pores or openings cannot exist in the rocks. In this zone, far below the earth's surface, subsurface water exists only in the molecular structure of the rocks and is called internal water.
Physical and Hydrologic Properties of Water-bearing Materials
The physical and hydrologic properties of water-bearing materials discussed in this section include grain size, porosity, moisture equivalent, specific retention, specific yield, permeability, transmissibility, and storage. The specific capacity of wells, which is related to these properties, also is discussed. Determination of these properties of water-bearing materials is necessary in any area where a quantitative estimate of the amount of ground water available for use is desired, such as for the development of an extensive well field or as a legal guide for the orderly development of the resource. Most of these properties can be determined approximately in the laboratory from samples of the water-bearing material collected in the field. Laboratory determinations, however, have inherent errors resulting from spot sampling of the material and from disturbance of the material as it occurs in its natural state, but are useful as a check against determinations made in the field.
Hydrologic properties of an aquifer can be determined in the field by means of carefully controlled pumping tests on wells, involving observation of the effects of pumping on the ground-water levels in the area surrounding the well. Pumping tests have the advantage of sampling the hydrologic properties of an aquifer over a relatively large area and of smoothing out differences in these properties caused by local changes in lithology. In the interpretation of the results of pumping tests, several basic assumptions concerning the physical properties of the aquifer must be made. The assumed conditions are rarely fulfilled completely in nature. Divergence from these assumptions introduces errors in the values of hydrologic properties obtained in pumping tests, but the errors are generally within acceptable limits, and in some cases the divergences can be compensated mathematically. A detailed discussion of pumping-test analysis is beyond the scope of this report, but several references on the subject are included at the end of this report (Cooper and Jacob, 1946; Theis, 1935, 1938; Wenzel, 1942).
Grain Size
Mechanical (particle-size) analysis of granular water-bearing material consists of separating into groups the grains of different sizes and determining what percentage of the total, by weight, each size group constitutes. Mechanical analysis of grain size will show the degree of homogeneity of an aquifer and make possible comparisons with granular material from different aquifers or from different locations in the same aquifer. Also, methods are available for making indirect determinations of certain other physical properties from mechanical analyses and are useful as checks against other methods.
Porosity
The rocks that make up the outer crust of the earth are generally not solid but have many openings called voids or interstices. This property of having voids or interstices is called porosity. The size, shape, and number of these openings depend upon the character of the rocks, and the presence of ground water in any region is in part determined by the character and structure of the rocks--that is, the geology. The voids in rocks range from microscopic openings in clay to large caverns in limestone. The openings generally are connected so that water can move from one void to another, but in some rocks the openings are isolated or so minute that there is little or no movement of water. Figure 7 shows several common types of voids or interstices and the relation of texture to porosity. Porosity is expressed as the percentage of the total volume occupied by interstices.
Figure 7--Diagram showing several types of rock interstices and the relation of rock texture to porosity. (From Meinzer, 1923a.) A, Well-sorted sedimentary deposit having high porosity; B, poorly sorted sedimentary deposit having low porosity; C, well-sorted sedimentary deposit consisting of pebbles that are themselves porous, so that the deposit as a whole has a very high porosity; D, well-sorted sedimentary deposit whose porosity has been diminished by the deposition of mineral matter in the interstices; E, rock rendered porous by solution; F, rock rendered porous by fracturing.
Moisture Equivalent, Specific Retention, and Specific Yield
The moisture equivalent of a water-bearing material is the ratio of the weight of water that the material, after saturation, will retain against a centrifugal force 1,000 times the force of gravity, to the weight of dry material. The moisture equivalent by volume is computed by multiplying the moisture equivalent by weight by the apparent specific gravity of the material. The moisture-equivalent determinations are used in estimating the specific retention of the water-bearing material. The specific retention is the quantity of water that a soil or rock will retain against the pull of gravity if it is drained after being saturated. Specific retention is expressed as the ratio of the retained water to the total volume of material.
The specific yield of a water-bearing formation is defined as the ratio of the volume of water that a saturated aquifer will yield by gravity to its own volume. The specific yield of a material is equal to the porosity minus specific retention.
Permeability, Transmissibility, and Storage
The permeability of a water-bearing rock is an expression of the capacity of the rock to transmit water under pressure and is related to the size and interconnection of the pore spaces. Permeability is generally expressed as a coefficient of permeability and is defined as the number of gallons of water a day, at 60° F, that is conducted laterally through each mile of the water-bearing bed measured at right angles to the direction of flow, for each foot of thickness of the formation and for each foot per mile of hydraulic gradient. The unit of permeability, gallon per day per square foot, is also called the Meinzer's unit, or meinzer.
The transmissibility, generally expressed as a coefficient of transmissibility, is defined as the number of gallons of water a day, at the prevailing temperature, that is transmitted through each mile of the formation under a hydraulic gradient of 1 foot per mile. It is the average coefficient of permeability taken at the prevailing temperature (field coefficient of permeability) multiplied by the saturated thickness of the aquifer, in feet.
The storage capacity of a water-bearing material, usually expressed as the coefficient of storage, may be defined as the volume of water it releases from or takes into storage per unit surface area of the aquifer per unit change in the component of head normal to that surface. Underwater-table conditions the coefficient of storage is practically equal to the specific yield.
Specific Capacity
Specific capacity is a term applied to a well producing ground water, and is expressed as the number of gallons a minute that a well will yield for each foot of drawdown. It has been demonstrated that this is not a linear relationship and is only approximate, but it is useful nevertheless in estimating relative efficiencies and permeabilities of water-bearing formations. The specific capacities of 11 wells in Kingman County are given in Table 3.
Table 3--Specific capacity of selected wells in Kingman County and their water-bearing formation.
| Well number | Specific capacity, in gallons per minute per foot of drawdown |
Water-bearing formation |
|---|---|---|
| 27-5-33abb | 18 | Crete(?) Formation |
| 27-8-15ddb | 15 | Holdrege Formation |
| 27-10-31ccd | 17 | Holdrege Formation |
| 27-10-31cca | 20 | Holdrege Formation |
| 27-10-32dcc1 | 25 | Grand Island Formation |
| 27-10-32dcc2 | 22 | Grand Island Formation |
| 28-7-6dab | 22 | Alluvium |
| 28-8-6ccc | 33 | Holdrege Formation |
| 28-10-5dbb | 44 | Grand Island Formation |
| 29-7-9baa | 39 | Holdrege Formation |
| 30-5-12cca | 31 | Holdrege Formation |
Water Table and Movement of Ground Water
The upper surface of the zone of saturation in permeable rock or soil is called the water table. Where the water table is intersected by relatively impermeable material, the water table is interrupted, the ground water is confined, and artesian conditions exist. If the relatively impermeable bed confining water under artesian pressure is penetrated by a well, the water will rise above the level at which it was encountered. The imaginary surface representing the level to which water under artesian pressure would rise is called a piezometric surface, each artesian aquifer having its own piezometric surface.
Shape and Slope of Water Table
The water table is not a flat surface but has irregularities that are related to the topography, geology, and hydrology of the area. The shape of the water table in Kingman County is shown on Plate 3 by means of contour lines drawn on the water table. All points along a contour line have the same altitude, and the lines show the shape and slope of the water table as the land surface is shown on a topographic map. The shape of the water table is very similar to the surface topography of the county but is less rugged.
In central and eastern Kingman County, where Permian rocks are at or near the surface (Pl. 1) and form steep slopes, the water table may be discontinuous or absent and in this area the inferred position of the water table is shown by dashed contours. Ground water, where not confined, moves toward areas of discharge in response to gravity, and the direction of movement is down the slope of the water table at right angles to the water-table contours. The movement of ground water is slow compared to the movement of surface water, and in unconsolidated materials such as are found in Kingman County, the rate may range from a fraction of an inch per day in silt and clay to several feet per day in well-sorted sand and gravel.
Fluctuations of Water Table
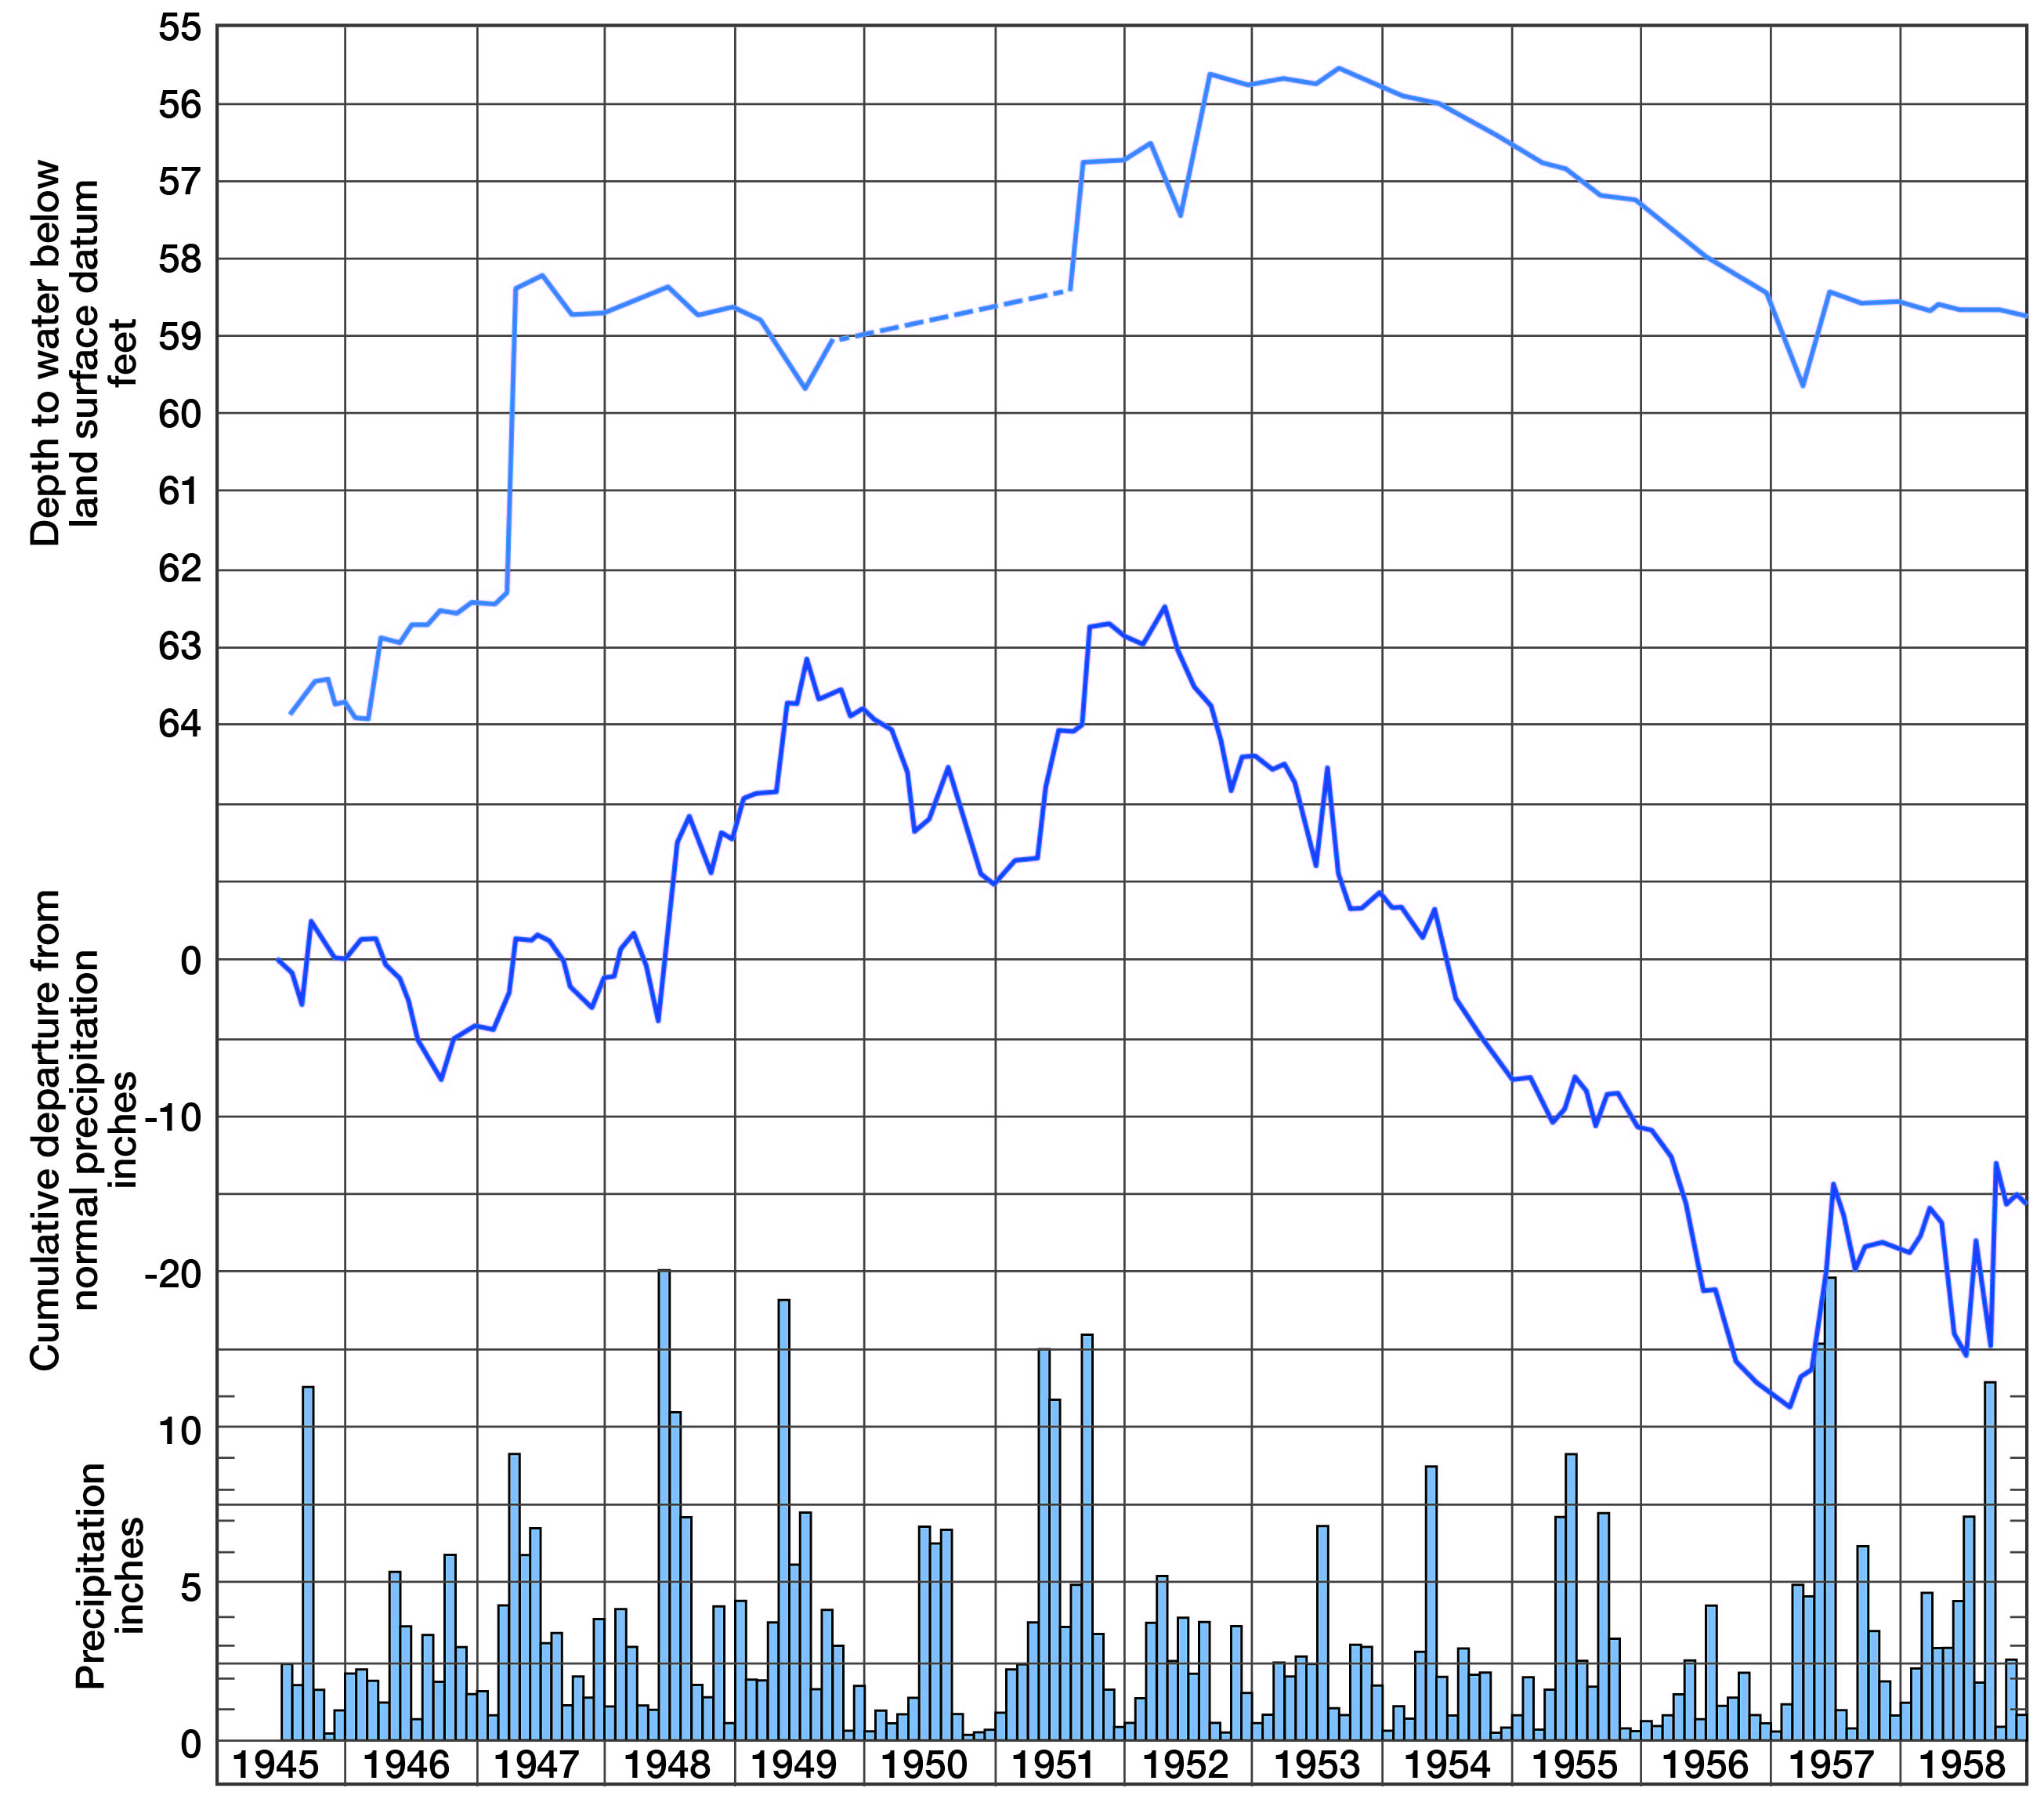
The water table is not a stationary surface but fluctuates up and down in response to additions to or withdrawals from the groundwater reservoir. Fluctuations of the water table can be determined by periodic measurements of the depth to water in wells, and if the specific yield of the aquifer is known, changes in storage within the aquifer can be calculated. The depth to water has been measured periodically in one well (27-9-9bbb1) in Kingman County since 1945 and the results have been published annually by the U. S. Geological Survey through 1955 (see "References") and thereafter by the Kansas Geological Survey (Fishel and Mason, 1957, 1958). Figure 8 is a hydrograph showing fluctuations of the water level in this well, monthly precipitation, and cumulative departure from normal precipitation at Kingman.
Figure 8--Hydrograph showing fluctuations of water level in well 27-9-9bbb1, monthly precipitation, and cumulative departure from normal precipitation at Kingman.
Prev Page--Geology || Next Page--Recharge, Discharge, and Utilization
Kansas Geological Survey, Geology
Placed on web Sept. 8, 2008; originally published March 1960.
Comments to webadmin@kgs.ku.edu
The URL for this page is http://www.kgs.ku.edu/General/Geology/Kingman/05_gw.html