![]()
Prev Page--Recovery and Utilization || Next Page--Formations
Ground Water, continued
Chemical Character of the Ground Water
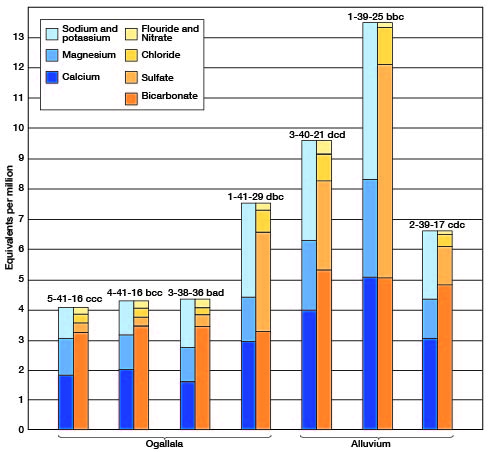
The chemical character of the ground water in Cheyenne County is indicated by the analyses of water from 19 wells and 1 spring (Tables 3 and 4). Table 3 includes analyses of water from the Bird City and St. Francis municipal water supplies. Figure 10 shows graphically the chemical character of water from the principal water-bearing formations. The water samples were analyzed by Howard A. Stoltenberg, chemist, in the Water and Sewage Laboratory of the Kansas State Board of Health at Lawrence. The analyses show only the dissolved mineral content and do not indicate the sanitary conditions of the water.
Table 3--Analyses of water from typical wells in Cheyenne County. Analyzed by H. A. Stoltenberg. Dissolved constituents given n parts per milliona, and in equivalents per millionb (in italics).
| Well number |
Depth (feet) |
Geologic source |
Date of collection |
Temp. (° F) |
Dissolved solids |
Silica (SiO2) |
Iron (Fe) |
Calcium (Ca) |
Magnesium (Mg) |
Sodium and potassium (Na + K) |
Bicarbonate (HCO3) |
Sulfate (SO4) |
Chloride (Cl) |
Fluoride (F) |
Nitrate (NO3) |
Hardness as CO3 |
||
|---|---|---|---|---|---|---|---|---|---|---|---|---|---|---|---|---|---|---|
| Total | Carb- onate |
Non- carbon- ate |
||||||||||||||||
| T. 1 S., R. 37 W. | ||||||||||||||||||
| 1-37-20bcc | 39.0 | Alluvium | Dec. 5, 1950 | 53 | 648 | 44 | 0.16 | 87 4.34 |
33 2.71 |
93 4.05 |
439 7.20 |
112 2.33 |
41 1.16 |
1.7 0.09 |
20 0.32 |
352 | 352 | 0 |
| T. 1 S., R. 39 W. | ||||||||||||||||||
| 1-39-21bcc | 45.0 | Ogallala | Dec. 5, 1950 | 591 | 46 | 2.4 | 88 4.39 |
25 2.06 |
73 3.17 |
322 5.28 |
177 3.68 |
21 0.59 |
0.9 0.05 |
1.1 0.02 |
322 | 264 | 258 | |
| 1-39-25bbc | 28.1 | Alluvium | Dec. 4, 1950 | 56 | 841 | 38 | 0.2 | 102 5.09 |
39 3.21 |
120 5.20 |
307 5.03 |
341 7.09 |
43 1.21 |
1.5 0.08 |
5.8 0.09 |
415 | 252 | 163 |
| T. 1 S., R. 41 W. | ||||||||||||||||||
| 1-41-7abd | 38.0 | Colluvium, alluvium |
Dec. 2, 1950 | 57 | 905 | 37 | 0.19 | 132 6.59 |
49 4.03 |
80 3.5 |
222 3.64 |
475 9.88 |
16 0.45 |
1 0.05 |
6.2 0.10 |
531 | 182 | 439 |
| 1-41-29dba | 93.0 | Ogallala | Dec. 2, 1950 | 57 | 470 | 27 | 0.19 | 59 2.94 |
18 1.48 |
72 3.11 |
200 3.28 |
158 3.29 |
27 0.76 |
1.2 0.06 |
8.8 0.14 |
221 | 164 | 57 |
| T. 2 S., R. 37 W. | ||||||||||||||||||
| 2-37-20ddd | 220.0 | Ogallala | Dec. 5, 1950 | 58 | 298 | 60 | 0.45 | 37 1.85 |
18 1.48 |
28 1.22 |
207 3.39 |
24 0.50 |
11 0.31 |
1.8 0.09 |
16 0.26 |
166 | 166 | 0 |
| T. 2 S., R. 39 W. | ||||||||||||||||||
| 2-39-17adc | 15.1 | Alluvium | Dec. 5, 1950 | 56 | 381 | 31 | 0.3 | 61 3.04 |
16 1.32 |
51 2.23 |
295 4.84 |
60 1.25 |
15 0.42 |
1.4 0.07 |
0.93 0.01 |
218 | 218 | 0 |
| T. 2 S., R. 40 W. | ||||||||||||||||||
| 2-40-12bbc | 130.6 | Ogallala | Dec. 5, 1950 | 559 | 59 | 0.35 | 64 3.19 |
34 2.79 |
51 2.21 |
205 3.36 |
44 0.92 |
45 1.27 |
1.6 0.08 |
159 2.56 |
299 | 168 | 131 | |
| T. 3 S., R. 38 W. | ||||||||||||||||||
| 3-38-36bad | (c) | Ogallala | Feb. 3, 1950 | 298 | 51 | 0.04 | 32 1.60 |
14 1.15 |
37 1.62 |
209 3.43 |
19 0.40 |
9 0.25 |
1.5 0.08 |
13 0.08 |
138 | 138 | 0 | |
| T. 3 S., R. 40 W. | ||||||||||||||||||
| 3-40-21dcd | (d) | Alluvium | Nov. 15, 1950 | 606 | 44 | 0.03 | 80 3.99 |
28 2.30 |
76 3.31 |
324 5.31 |
143 2.97 |
32 0.90 |
1.5 0.08 |
21 0.34 |
314 | 266 | 48 | |
| T. 3 S., R. 41 W. | ||||||||||||||||||
| 3-41-2ccc | 182.0 | Alluvium | Dec. 2, 1950 | 57 | 283 | 49 | 0.1 | 37 1.85 |
19 1.56 |
25 1.09 |
205 3.36 |
20 0.42 |
12 0.34 |
1.3 0.07 |
19 0.31 |
170 | 168 | 2 |
| T. 3 S., R. 42 W. | ||||||||||||||||||
| 3-42-28dda | 159.0 | Ogallala | Dec. 2, 1950 | 60 | 244 | 51 | 0.14 | 32 1.60 |
14 1.15 |
23 1.02 |
185 3.03 |
13 0.27 |
9.3 0.15 |
1.4 0.07 |
9.3 0.15 |
138 | 138 | 0 |
| T 4 S., R. 37 W. | ||||||||||||||||||
| 4-37-23bcc | 129.0 | Ogallala | Nov. 25, 1950 | 58 | 283 | 49 | 0.58 | 42 2.10 |
17 1.40 |
25 1.07 |
220 3.61 |
21 0.44 |
11 0.31 |
1.1 0.06 |
9.3 0.15 |
175 | 175 | 0 |
| T. 4 S., R. 38 W. | ||||||||||||||||||
| 4-38-4bbb | 220.0 | Ogallala | Nov. 25, 1950 | 293 | 50 | 0.24 | 39 1.95 |
18 1.48 |
28 1.24 |
217 3.56 |
26 0.54 |
10 0.28 |
1.4 0.07 |
14 0.22 |
172 | 172 | 0 | |
| T. 4 S., R. 40 W. | ||||||||||||||||||
| 4-40-2aad | 91.0 | Ogallala | Nov. 25, 1950 | 58 | 277 | 51 | 0.14 | 38 1.90 |
14 1.15 |
29 1.28 |
200 3.28 |
24 0.50 |
11 0.31 |
1.7 0.09 |
9.3 0.15 |
152 | 152 | 0 |
| T. 4 S., R. 41 W. | ||||||||||||||||||
| 4-41-16bcc | Ogallala | Dec. 2, 1950 | 264 | 45 | 0.06 | 40 2.00 |
14 1.15 |
26 1.12 |
210 3.44 |
15 0.31 |
11 0.31 |
1.3 0.07 |
8.8 0.14 |
158 | 158 | 0 | ||
| T. 4 S., R. 42 W. | ||||||||||||||||||
| 4-42-24dad | 24.3 | Alluvium | Dec. 2, 1950 | 239 | 46 | 0.08 | 37 1.85 |
12 0.99 |
22 0.95 |
193 3.16 |
11 0.23 |
8 0.23 |
1.1 0.06 |
7.1 0.11 |
142 | 142 | 0 | |
| T. 5 S., R. 38 W. | ||||||||||||||||||
| 5-38-23cbc | 66.0 | Ogallala | Nov. 25, 1950 | 56 | 239 | 33 | 0.16 | 51 2.54 |
11 0.90 |
12 0.53 |
200 3.28 |
7 0.14 |
9 0.25 |
0.7 0.04 |
16 0.26 |
172 | 164 | 8 |
| T. 5 S., R. 39 W. | ||||||||||||||||||
| 5-39-2bbb | 140.0 | Ogallala | Nov. 25, 1950 | 58 | 422 | 43 | 0.36 | 73 3.64 |
25 2.06 |
17 0.74 |
207 3.39 |
10 0.21 |
31 0.87 |
0.8 0.04 |
120 1.93 |
285 | 170 | 115 |
| T. 5 S., R. 41 W. | ||||||||||||||||||
| 5-41-16ccc | 179.0 | Ogallala | Dec. 2, 1950 | 58 | 255 | 47 | 0.08 | 36 1.80 |
15 1.23 |
24 1.04 |
198 3.25 |
19 0.40 |
8 0.23 |
1.7 0.09 |
6.2 0.10 |
152 | 152 | 0 |
| a. One part per million is equivalent to one pound of substance per million pounds of water or 8.33 pounds per million gallons of water. b. An equivalent per million is a unit chemical equivalent weight of solute per million unit weights of solution. Concentration in equivalents per million is calculated by dividing the concentration in parts per million by the chemical combining weight of the substance or ion. c. Composite sample from Bird City water supply. d. Composite sample from St. Francis water supply. |
||||||||||||||||||
Table 4--Summary of the chemical character of the samples of water from typical wells in Cheyenne County.
| Range in parts per million | Number of samples | |
|---|---|---|
| Ogallala formation |
Alluvium | |
| Dissolved solids | ||
| 200-250 | 3 | 0 |
| 251-300 | 7 | 1 |
| 301-400 | 0 | 1 |
| 401-500 | 2 | 0 |
| 501-600 | 2 | 0 |
| 601-700 | 0 | 2 |
| 701-1000 | 0 | 2 |
| Total hardness | ||
| 100-150 | 2 | 1 |
| 151-200 | 8 | 0 |
| 201-250 | 1 | 1 |
| 251-300 | 2 | 0 |
| 301-400 | 1 | 2 |
| 4014W | 0 | 2 |
| Fluoride | ||
| 0.5-1.0 | 3 | 1 |
| 1.1-1.5 | 7 | 4 |
| 1.6-2.0 | 4 | 1 |
| Nitrate (NO3) | ||
| Less than 10 | 7 | 4 |
| 11-20 | 5 | 1 |
| 21-30 | 0 | 1 |
| 31-160 | 2 | 0 |
Fig. 10--Analyses of water from the principal water-bearing formations in Cheyenne County.
Chemical Constituents in Relation to Use
The following discussion of the chemical constituents of ground water has been adapted in part from publications of the Federal Geological Survey and the State Geological Survey of Kansas.
Dissolved solids--When water is evaporated, the residue consists of rock materials, a little water of crystallization, and sometimes a small amount of organic material, The most important of these rock materials are listed in Table 3. The kind and quantity of these soluble rock materials in the water determine its suitability for use. Water with less than 500 parts per million of dissolved solids genera]IN, is satisfactory for domestic use, except for hardness or occasional excessive iron content. Water containing more than 1,000 parts per million is likely to contain enough of certain constituents to produce a noticeable taste or to make the water unsuitable in some other respect.
The dissolved solids in samples of water from Cheyenne County ranged from 239 to 905 parts per million. Six samples contained more than 500 parts per million.
Hardness--Hardness of water is commonly recognized by its effects when soap is used with the water in washing. Calcium and magnesium cause practically all the hardness of ordinary waters and are also the active agents in the formation of the greater part of the scale formed in steam boilers and in other vessels in which water is heated or evaporated.
Hardness is of two types, carbonate hardness and noncarbonate hardness. Carbonate hardness, often called temporary hardness because it can be removed almost entirely by boiling, is caused by calcium and magnesium bicarbonate. Noncarbonate or permanent hardness is caused mainly by sulfates and chlorides of calcium and magnesium and to a lesser degree by nitrates and fluorides of calcium and magnesium. Carbonate and noncarbonate hardness are the same with respect to consumption of soap. In general, however, noncarbonate hardness forms the hardest scale in steam boilers.
Water having a hardness of less than 50 parts per million is rated as soft and is seldom treated to remove hardness. Hardness between 50 and 100 parts per million increases the consumption of soap and the removal of hardness by a softening process may be profitable by laundries or other industries using large amounts of soap. Hardness of more than 150 arts per million is easily noticeable and where hardness exceeds 200 parts per million water for household use is sometimes softened or rain water is stored in cisterns for washing. Where municipal water supplies are softened the hardness is reduced generally to about 100 parts per million.
The hardness of samples of water collected in Cheyenne County ranged from 138 to 531 parts per million. Nine samples had a hardness of more than 200 parts per million and 11 samples, less than 200.
Silica--Silica is a common rock material in solution in ground water. The silica in water may be deposited with other scale-forming constituents in steam boilers, but otherwise it has no effect on the use of water for most purposes.
Iron--The quantity of iron in ground water may differ greatly from place to place, even in water from the same formation. If a water contains much more than 0.1 part per million of iron the excess, after exposure to the air, may settle as a reddish precipitate. Iron stains cooking utensils, bathroom fixtures, and clothing and may give a disagreeable taste if present in sufficient quantity. Iron content in water can generally be reduced by simple aeration and filtration, but for certain industrial uses iron must be completely removed by other methods.
In water samples from Cheyenne County, the iron content ranged from 0.03 to 2.4 parts per million. All but five samples contained 0.1 part per million or more of iron.
Sulfate--According to the U. S. Public Health Service (1946) a maximum of 250 parts per million of sulfate is recommended in water supplies used on interstate carriers. Waters containing excessive amounts of sodium sulfate (Glauber's salt) or magnesium sulfate (Epsom salt) may have an adverse effect on the human system. Only two samples from Cheyenne County contained more than 250 parts per million of sulfate and most samples contained considerably less than this amount.
Fluoride--Although fluoride is usually present only in small quantities in ground water, the amount of fluoride in water consumed by children should be known. Fluoride in water is associated with the dental defect known as mottled enamel, which may appear on the teeth of children, who, during the formation of the permanent teeth, drink water containing too much fluoride. Teeth affected with mottled enamel have white chalky spots on them and in more severe cases may have brown stains or may be pitted.
According to Dean (1936) mild cases of mottled enamel may develop in a small percentage of children whose supply of drinking water contains about 1 part per million of fluoride. Mild cases of mottled enamel were reported in about 40 or 50 percent of children who drank water containing 1.7 to 1.8 parts per million. Drinking water containing 4 parts per million of fluoride resulted in mottled enamel in 90 percent of the children, 35 percent of the cases being classified as moderate or worse. The Public Health Service (1946) recommends that the content not be in excess of 1.5 parts per million.
Recent studies indicate that water containing small amounts of fluoride is beneficial in preventing tooth decay. At the present time fluoride is being added to public water supplies in many areas in the United States where the water is deficient in fluoride. In most such places the fluoride content is brought up to about 1.0 part per million, or about 0.5 part less than the maximum specified by the Public Health Service.
The fluoride content of water samples from Cheyenne County ranged from 0.7 part to 1.8 parts per million. Most of the samples were within the safe limits suggested by the Public Health Service, and only 5 samples contained more than 1.5 parts per million of fluoride.
Nitrate--Some of the nitrate in ground water is derived from nitrate-bearing rocks and minerals in the water-bearing formations, but high concentrations of nitrate probably are due to direct flow of surface-water into the well or to percolation of nitrate-bearing water into the well through the top few feet of the well. In Kansas probably much of the nitrate in well waters is derived from soils, which are rich in highly soluble organic nitrogen. Other sources of nitrate are barnyards, cesspools, and privies which may also contribute dangerous bacteria to the ground water.
The amount of nitrate in water should be known, not only because high nitrate may indicate pollution but because nitrate itself may be dangerous. A large amount of nitrate in water used in the preparation of a baby's formula can cause cyanosis of infants. If the water supply is not changed, eventual death may result.
According to Metzler and Stoltenberg (1950, p. 194): The nitrates are converted to nitrites and absorbed by the blood, where they destroy its oxygen-carrying properties. The blood becomes chocolate brown, the skin develops a blue color, and death may result from oxygen starvation.
Nitrate-bearing water does not cause cyanosis in adults but it may have other adverse effects.
The Kansas State Board of Health considers that concentrations of nitrate as NO3 exceeding 45 to 90 parts per million are unsafe and should not be used for infant-formula preparation. All water samples collected in Cheyenne County contained nitrate, but only two samples, which contained 159 and 120 parts per million, respectively, were considered unsafe for drinking.
Sanitary Considerations
The analyses of water given in Table 3 show only the amounts of dissolved mineral matter in the water and do not indicate the sanitary quality of the water. The water in a well may contain mineral matter that imparts an objectionable taste or odor, yet may be free from harmful bacteria and be safe for drinking. On the other hand, the water in a well may be clear, palatable, and seemingly pure, yet may contain harmful bacteria. An abnormal amount of certain mineral constituents such as nitrate or chloride sometimes indicates pollution.
The entire population of Cheyenne County is dependent upon ground-water supplies and every precaution should be taken to protect these supplies from pollution. Wells should not be located near possible sources of pollution or where surface water can enter the ground at or near the well; every well should be constructed to seal off all surface water. As a rule, dug wells are more subject to contamination than drilled wells. They generally are not effectively sealed at the top, or the depth to water may be so shallow that bacteria may not be filtered out effectively as the water descends to the water table, even if the well is constructed properly.
Water for Irrigation
The suitability of a water for irrigation is dependent mainly on the concentration of dissolved solids and on the percentage of sodium. The quantity of chloride is sometimes large enough to affect use of water for irrigation, and boron is sometimes present in sufficient amounts to be harmful to plants. The total concentration of dissolved constituents may be expressed in terms of total equivalents per million of anions or cations, parts per million of dissolved solids, or electrical conductivity. Electrical conductivity is the measure of the ability of the inorganic salts in solution to conduct an electric current, the current being dependent upon the number and kinds of dissolved solids. Electrical-conductivity measurements are not shown in analyses of water from Cheyenne County, but an approximate value can be obtained by multiplying total equivalents of anions or cations by 100, or by dividing dissolved solids in parts per million by 0.7 (Wilcox, 1948, pp. 4-5). To find the percentage of sodium, the results of the analysis must be reported in equivalents per million. The equivalents per million of sodium is divided by the sum of the equivalents per million of calcium, magnesium, sodium, and potassium, and the result is expressed as a percentage.
The classification of water for irrigation use is shown in Table 5 (Wilcox, 1948a). The classification is empirical only and, as in any method for interpretation of analyses, it is assumed that the water will be used under average conditions as related to soil, permeability, quantity of water used, climate, and crops. In general, water containing more than 60 percent of sodium or having an electrical conductance of more than 2,000 is unsuitable for irrigation. All samples of water from Cheyenne County analyzed are within the permissible limits suggested by Wilcox.
Table 5--Permissible limits for electrical conductivity and percentage of sodium in several classes of irrigation water (From Wilcox, 1948a, p. 27)
| Classes of Water | Electrical conductivity (micromhos at 25° C.) |
Percent sodium |
|
|---|---|---|---|
| Rating | Grade | ||
| 1 | Excellent | less than 250 | less than 20 |
| 2 | Good | 250-750 | 20-40 |
| 3 | Permissible | 750-2,000 | 40-60 |
| 4 | Doubtful | 2,000-3,000 | 60-80 |
| 5 | Unsuitable | more than 3,000 | more than 80 |
Prev Page--Recovery and Utilization || Next Page--Formations
Kansas Geological Survey, Geology
Placed on web Aug. 8, 2008; originally published April 1953.
Comments to webadmin@kgs.ku.edu
The URL for this page is http://www.kgs.ku.edu/General/Geology/Cheyenne/05_gw3.html