![]()
Prev Page--Geology--Lansing-Kansas City, Permian || Next Page--History
Oil production
Oil production by years 1926-1986
Cumulative production
The Gorham oil field produced 93,860,011 barrels of oil (BO) in 60 years from October 24,1926, through December 31,1986. During 1986, oil production was officially reported as 520,292 BO from 531 oil wells. These official figures calculate to 1,425 barrels of oil per day (BOPD) or an average production of 2.68 BOPD per well during the year 1986.
The author counted wells in the field in October 1986, and found 444 oil wells in actual production. Using that figure, the production calculates as 3.21 BOPD per well. Twelve years earlier, in December 1974, the official production figures showed 448 oil wells producing 3.46 BOPD per well. At that time, the author conducted a field check and counted 341 pumping wells. Using the well-count figure, the production calculates at 4.55 BOPD per well. Both field checks confirm that there is an appreciable lag from the time a well is shut down to the time that it is reported as plugged and abandoned.
The Gorham oil field has been in the stripper classification since 1955. A stripper oil-well is defined as an oil well that produced on the average less than 10 BOPD for 365 consecutive days of actual operation. The term "stripper" is applied to an oil field with an average production of less than 10 BOPD per well for a year. In spite of the low average production per well, the Gorham oil field is a substantial contributor to Kansas oil production by providing 1,425 bbls of domestic oil per day for Kansas refineries in 1986.
Sources of oil-production statistics
Kansas Corporation Commission records are the source of oil-production statistics. Operators are required to report the barrels of oil produced each month on a lease-by-lease basis. The current and recent monthly records of oil and gas production are available to the public in the offices of the Kansas Corporation Commission. Records from 1931, the advent of proration, through the following decades, are poorly preserved on film with somewhat uneven indexing. Although these older records are theoretically available for public use, they are difficult to access. Commercial service companies use the current Kansas Corporation Commission oil-production records to abstract and publish monthly oil and gas production data which are sold by subscription. Two companies are Dwight's Energydata, Inc. of Tulsa and other cities, and Petroleum Information, a company of the Dun and Bradstreet Corp. of Denver, Houston, and other cities. Production statistics available from these commercial sources provide oil and gas production records indexed geographically (by section, township, and range) on a lease-by-lease basis. Their statistics include cumulative lease production to the date of the report for active leases. A separate report is available for abandoned leases. The Kansas Geological Survey utilizes the Kansas Corporation Commission records and the commercial reports to compile annual summaries of oil production for the state on a county-by-county basis and by individual oil fields. Publications by the Kansas Geological Survey are listed in the appendix, table 8, "Petroleum-production statistics for the state of Kansas." These publications are listed by the year of statistical data, not by the year of publication, which may be from one to five years later.
There are no generally available records preserving oil-production information on a well-by-well basis. None preserve production records by formation. All listings in this report of production by formations are based on the judgment of the author and are allocations or estimates. For each lease, the cumulative oil production in barrels to December 31, 1986, was recorded on a spreadsheet as were the number of oil wells, the lease area in acres, the producing formations, and the author's estimated allocation of cumulative oil production among the formations for each lease. From data on the spreadsheet, the production from each formation was calculated for the entire oil field and for discrete areas within the oil field as needed for examples.
Annual production statistics from which the graphs in fig. 4 were made are summarized in the appendix, table 2. Oil-production data from the early years are difficult to compile. Like other major oil fields in central Kansas, the present Gorham oil field was formed by merging many former smaller oil fields, each with its own discovery well. Thirty-seven of these recognized discovery wells of former oil fields now merged into the Gorham oil field are mapped in fig. 3 and listed in the appendix, table 1. The author had access to unpublished oil-company production records for western Kansas oil fields to 1940. The production figures in table 2 were assembled by diligently compiling a "genealogy chart" accounting for the merging of the 37 named oil fields into the present Gorham oil field. Some ambiguities remain. For example, Atherton oil field was at one time a separate oil field. It was then combined with the Russell oil field by the Kansas Corporation Commission Oil Field Nomenclature Committee, but later part of the former Atherton oil field was reassigned by that committee to the Gorham oil field. Some production records may have been lost in this and other comparable transfers, but the production figures by formations are reasonably correct as presented. If stripper production continues for about 15 more years, oil production from the Gorham oil field will reach lob million BO qualifying it for the rank of a domestic "giant oil field."
Oil production by formations
General statement
In general, two-thirds of the oil sold from the Gorham oil field to December 31,1986, was produced from the unconformity-related Arbuckle dolomite and Reagan Sandstone. One-fourth of the oil was produced from the Pennsylvanian Lansing-Kansas City limestones. The Topeka fracture zone is considered to have produced about 7% of the total oil. A little more than 1% came from the Permian (Tarkio, etc.) reservoirs. A small amount of oil was produced from Precambrian granite and quartzite. The percent of production, by formations, and the gross oil production figures in barrels of 42 U.S.A. gallons are shown in the appendix, table 4, p. 100.
Oil production, Reagan Sandstone
Statistical data summarized in table 4 may be analyzed further. Oil recoveries from the Reagan Sandstone averaged about 88,000 BO per well but varied widely depending on the updip or downdip location of the oil wells as shown by the following specific examples:
| Oil production, Reagan Sandstone | |||||
|---|---|---|---|---|---|
| Location in T. 14 S., R. 15 W. |
BO produced |
No. of wells |
BO/ well |
Acres | BO/ acre |
| sec. 15 | 4,692,730 | 35 | 134,078 | 500 | 9,385 |
| sec. 10 | 4,146,820 | 45 | 92,152 | 450 | 9,215 |
| sec. 11 | 669,285 | 45 | 14,240 | 500 | 1,339 |
The Reagan Sandstone wells in secs. 10 and 15 are located either in the updip or the midportion of the sandstone-producing area in T. 14 S., R. 15 W. In contrast, the wells in sec. 11, some of which have a few feet of dolomite above the sand, are located near the downdip edge of sandstone oil production. They went to 100% water early, after only producing about 11% as much oil as the best of the updip wells.
The sec. 15 area was drilled on irregular wider spacing, averaging 14 acres (5.6 hectares) per well, compared with the regular 10-acre (4-hectare) spacing of sec. 10 oil wells. Per-acre production in sec. 15 was comparable to that from the 10-acre-spaced oil wells, but the per-well recovery was 45% higher in sec. 15; hence, wells were much more profitable with the wider spacing.
It is not possible to transfer this information into barrels of oil per acre foot because of the method of production. All of the Reagan Sandstone oil wells in T. 14 S., R. 15 W. were drilled in the 1930's, mostly with cable tools. When oil entered the borehole while drilling the very first foot or two in the sand, drilling was stopped. The thickness of the sand at most locations was and is unknown. Pipe was then set and the well put on production. No permeability measurements are available, but it is probable that the excellent permeability of the leached Reagan Sandstone is measurable in Darcy's--not in millidarcies. Reagan Sandstone oil production had an enormously effective water drive for energy. In the Gorham oil field in 1975 (Walters, 1978, p. 68), three Reagan Sandstone oil wells in a late stage of production history were equipped with 3-inch tubing and were pumping 900 bbls of fluid per day (BFPD) each. One well with a bottomhole Reda pump was observed lifting 2,000 BFPD, mostly saltwater.
Comparable figures for oil production per well or per acre are not available for the Reagan Sandstone or "Gorham sand" production in the vicinity of the 1928 discovery well in sec. 33, T. 13 S., R. 15 W. At that time, wells were pumped at capacity, subject only to finding a market for the crude oil. This situation changed abruptly May 28, 1931, when House Bill 387 became effective. With that bill, the State regulated oil production by proration. Koester (1934) stated that it was for the purposes of "the prohibition of waste, including gas energy; the regulation and prevention of discrimination of purchasers; and the marketing of oil ratably from wells in each field when the daily production is above fifteen barrels of oil per welL" No mention is made of price; rather, the banner under which price controls were achieved in Kansas through all the years of the Gorham oil-field history after May 1931 was "prohibition of waste."
Annual oil-production figures published by Folger (1933) for production from the Reagan Sandstone (Gorham sand) around the discovery well in sec. 33, T. 13 S., R. 15 W., on a lease-by-lease and well-by-well basis for the years 1928 and 1929 were used for calculations of the daily production per well for those years. In 1928, the first 10 "Gorham sand" wells (called "Pennsylvanian basal conglomerate" by Folger) had a daily average oil production of 149 BOPD per well for the year. Highest production was from the Johnson and Vickers #1 Gorham (the well from the derrick of which the cover photo was taken in April 14, 1928), which produced and sold 56,173 BO in 226 days after its completion May 18, 1928, or 248 BOPD. Production from that well declined to 45 BOPD in 1929. During 1929, the same 10 wells averaged 59 BOPD per well, a 60% decline. Folger (1933, p. 98), to whom monthly figures were available, stated in more detail that,
It is significant that the average production of the Pennsylvanian basal conglomerate wells declined from 580 barrels per day in February, 1928, to 57 barrels per day in December, 1929. Part of this is normal decline, and part appears to be due to the fact that since the producing sand is connected, as each new well is completed it reduces the production of all the wells.
Thus it was early recognized that the Gorham sand reservoir was being overdrilled and overproduced, justifying the curtailment of production by regulated well proration in 1931. During the general economic depression affecting the country in the early 1930's, devastatingly low oil prices bottomed at 22¢ a barrel in July 1930. These low prices led to waste when viewed from the historical vantage point of 60 years of oil production from the Gorham oil field.
The 1928-29 production figures cited are in contrast to the situation after May 28, 1931, when production was limited to a ratable portion of the well's capacity or a minimum of 15 BOPD per well. Development in the mid-1930's of the Reagan Sandstone oil wells in T. 14 S., R. 15 W. was slowed. These regulations did, however, enforce regular well spacing in the 10-acre (4-hectare) pattern, 660 ft (198 m) between oil wells and with each oil well 330 ft (99 m) from the lease boundary. The regulations also inadvertently encouraged the over-drilling of the Reagan Sandstone wells in T. 14 S., R. 15 W. and elsewhere. This is due in part because the cash flow from one oil well with the reduced allowed-production of a maximum of 25 BOPD to a minimum of 15 BOPD per well was quite low for economically viable operation. Leases with more wells had more profitable cash flow. Weak wells, producing less than 15 BOPD, were sometimes helped, illicitly, by overproducing stronger wells.
Oil production, Arbuckle dolomite
Further analysis can be made from the figures for oil production from the Arbuckle dolomite shown in table 4, p. 100. Oil production is stated separately for Arbuckle lithologic units B, C, 0, and E. There is no production from Unit F within the Gorham oil field. For the most part, Arbuckle dolomite oil wells are spaced on regular 10-acre (4-hectare) locations so that the per-acre production can be approximately projected as 10% of the per well recovery figures. The per-acre recovery range is, therefore, from 3,500 BO/acre for the cherty dolomite E member to 7,000 BO/acre for the sandy dolomite C member. The average for the 829 Arbuckle wells is 5,247 BO/acre. The rounded figure of 5,000 BO/acre is useful in approximating oil reserves in the Arbuckle dolomite, particularly where the amount of reservoir porosity within the oil column is not known, as is often the case.
The Arbuckle dolomite-Reagan Sandstone reservoir in the Gorham oil field has a strong water drive so that the oil column is approximately the distance from the top of the Arbuckle or Reagan Sandstone to the oil-water contact, originally near subsea -1,440 ft (-432 m). The oil column is defined as the vertical interval from the top of the structurally highest oil-bearing porosity to the base of the producible oil. The oil column in the Arbuckle dolomite reservoir in the Gorham oil field had a maximum thickness of 42 ft (12.6 m) with the same thickness in the Reagan Sandstone area. Although the lithologic subdivisions of the Arbuckle are a factor affecting relative oil recovery, the structural position of the oil well and the local development of porosity are far more important. Structurally high wells have more oil column. They, therefore, have a greater thickness of reservoir porosity after eliminating tight, nonporous zones or beds. It is the author's opinion that the high per-well and per-acre recovery of the sandy dolomite C member, 70,000 BOPW and 7,000 BO per acre, is largely due to its fortuitous subcrop position along the southeast axis of the Gorham anticline. Along this anticlinal axis, 22 oil wells producing from the sandy dolomite member encountered the top of the Arbuckle above subsea -1,400 ft (-432 m), and thus had more than 40 ft (12 m) of oil column or "pay." This is the thickest Arbuckle production zone within the Gorham oil field.
Oil production, Lansing-Kansas City
Lansing-Kansas City limestone reservoirs provided 25% of the total oil production of the Gorham oil field. The amount produced is 24 million barrels of oil from 477 wells known to the author to have produced oil from the Lansing-Kansas City beds. These figures were obtained by first ascertaining which wells produced from any part of the Lansing-Kansas City. For the first 20 years (1926-1946), the era of predominantly cable-tool drilling, this is rather easily determined. When a well encountered or "discovered" oil, drilling stopped. The scout tickets and record cards give total depth even though they do not always indicate the pay zone. For the last 40 years, Lansing-Kansas City oil production is not so clearly ascertained. Most rotary-drilled holes drill to the deeper Arbuckle formation, testing the Lansing-Kansas City on the way down. Only when deeper oil production either is not present or is later depleted are such wells plugged back to produce oil from the Lansing-Kansas City, Toronto, Topeka, etc., in upward sequence without necessarily publicly recording the plug-back operation. The second step was to ascertain the lease or section production and the third step was to attempt to make a reasonable allocation of the total production to the appropriate producing zone. This is not precise on a lease-by-lease basis but does give a reasonable order of magnitude figure for the whole oil field.
No effort was made to distinguish among zones in the Lansing-Kansas City or among separate Lansing-Kansas City producing areas within the Gorham oil field, for the reason previously stated--the Kansas Corporation Commission, the regulatory agency, considers all Lansing-Kansas City wells in the Gorham oil field to be producing from a common source of supply regardless of the zone within the Lansing-Kansas City; hence, no separate zone-byzone figures are required to be kept for the public record.
Oil production by enhanced-recovery methods, Lansing-Kansas City
It is difficult to know how much of the Lansing-Kansas City oil produced is due to secondary recovery by waterflooding. Even the owner or operator of the lease is usually not certain. For 23 years (1959-1982), the Kansas Geological Survey recorded such information. It discontinued publishing secondary-recovery series annual reports in 1983 because of the low demand for the information, the high personnel-time cost of collecting the information, and the questionable reliability of some of the volunteered information, according to Larry H. Skelton (personal communication, 1988), who formerly assisted in compiling annual secondary-recovery reports. A reasonable order of magnitude figure is that one-third, or 8,000,000 bbls, of the Lansing-Kansas City oil was recovered by waterflooding.
With new technologic development, substantial improvements have been and will be made in the recovery of additional oil. For example, acidizing of carbonate rocks during well completion has provided a tremendous boost in well-production capacity. Although acidizing was introduced as a secondary-recovery method to depleted "Oswald" wells in the Fairport and Gorham oil fields in the 1930's, it is now a routine part of well completions. Certain methods of tertiary oil recovery-notably miscible polymer injection and carbon dioxide miscible injection process-have significant potential but are on "hold" for the future because of the low price of crude oil.
One of these tertiary oil-recovery processes was investigated by Poyser (1988). She reviewed the Lansing-Kansas City oil production in seven major central Kansas oil fields, including the Gorham oil field, and found that "the range for primary recovery . . . was between 6.1% and 34.2% of the original oil in place. For waterflooding, the recoveries were 5.7% to 19.6% of the original oil in place." She concluded that the application of the carbon dioxide miscible process to Lansing-Kansas City oil reserves can increase incremental oil production by as much as 10-20% of the original oil in place, but estimated that the oil price must be $24 a barrel or higher for the process to be economically attractive.
Oil production, Shawnee Group--Oread and Plattsmouth
Shawnee oil production from intercrystalline porosity in the Oread (Toronto) and Plattsmouth ("Topeka") is commonly comingled with Lansing-Kansas City production. No separate production figures are available. Topeka oil wells producing from the Oread and Plattsmouth limestones are not mapped in fig. 12.
Oil production, Topeka fracture zone
Topeka production from fracture zones was obvious in cable-tool drilling in the 1930's. However, additional oil production from fracture-zone porosity has seldom been found during the past 50 years, probably because of the difficulty in detecting it using rotary-drilling equipment with mud-filled holes. Figures given for production from the 30 mapped Topeka fracture-zone wells (fig. 12) are derived from surviving well records plus arbitrary allocation. The figure 6,500,000 BO is considered correct as an order of magnitude figure for oil production from this zone. Although regarded as "freak" production, Topeka fracture-zone production amounts to a sizable estimated 7% of the total oil produced from the Gorham oil field.
Oil production, shallow formations
No specific figures are available for oil production from formations encountered at depths less than 2,500 ft. Most of the shallow oil production is from the Tarkio (Pennsylvanian, Wabaunsee) and results from technical advances in formation fracturing. Ver Wiebe et al. (1953) provided a brief description of fracturing when there was much interest in this theninnovative well-completion process:
Production from Tarkio sands in earlier years (then called Indian Cave sand) was small. In sand fracturing, special sand is suspended in prepared heavy oil and pumped into the producing formation under pressure, forcing the mixture of sand and oil into the producing sandstone. When the prepared oil is later removed, the suspended sand grains remain in the producing zones holding the grains in the sandstone apart and thus providing avenues of migration for the oil.
Crude oil, well-head prices, 1926-1986
Flush and settled production stages, 1926-1956
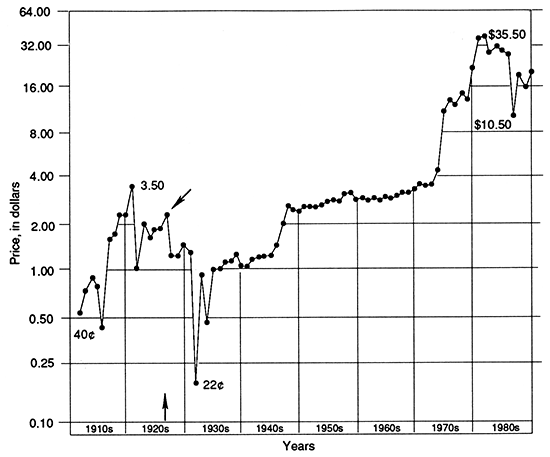
The well-head price of crude oil is a decisive factor affecting the amount of crude oil that will be produced from an oil well. Oil wells generally run out of profit before they run out of oil. Crude-oil prices in dollars per barrel are shown graphically in fig. 17 by years from 1901 to the 1980's. The annual mid-year figures from which the graph in fig. 17 was prepared are listed in the appendix, table 5. In fig. 17 the arrow shows the year 1926 when the Gorham oil field came on production. During the Gorham oil field's flush production stage in the 1920's and 1930's, crude oil well-head prices were depressed. Crude oil prices were $1.80 (1926) to $2.00 (1927) a barrel, declining to $1.25 a barrel one year later when the big oil wells were completed in the Gorham sand. Shortly thereafter, the stock market crash of 1929 occurred and was followed by the economic depression of the 1930's. Many major oil fields were being discovered including the Oklahoma City field in December 1928, and the giant east Texas oil field in 1930. Miner (1987, p. 188) summarized:
The effect of the sudden shift in supply and demand for energy affected the price structure in a dramatic way. Kansas crude averaged $1.32 in 1930, 69¢ in 1931, 91¢ in 1932, and 66¢ in 1933. It ranged between $1 and $1.20 a barrel--about one-half the mid-1920's price--until 1946. There were times when spot prices were much lower. On July 8, 1931, for example, the posted price for high gravity Mid-Continent crude of the finest quality was 18¢ a barrel.
Figure 17--Posted price in dollars, paid for Kansas crude oil at the well head, 1910's-1980's. Based on average mid-year price for 42-gallon (U.S.) barrel of crude oil, gravity 40°. Figures from which the graph were prepared are given in the appendix, table 5. Arrow indicates 1926, the year of discovery of the Gorham oil field.
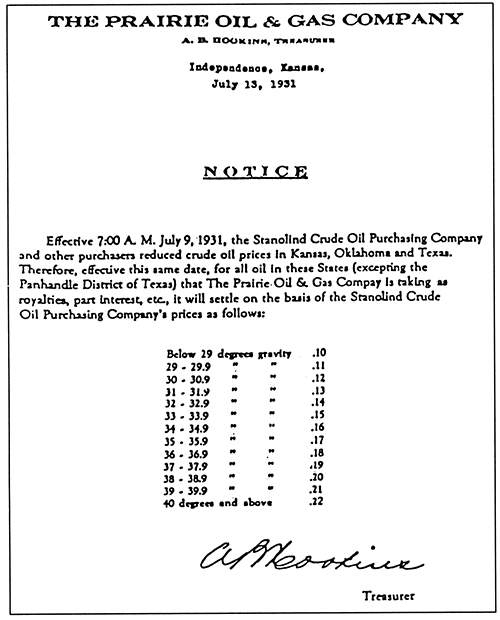
A photocopy of an actual "posting" dated July 13, 1931, is included as fig. 18. These low crude-oil prices resulted from uncontrolled overproduction that led to the formation of the Interstate Oil Compact Commission (IOCC), the curtailment of Kansas oil production under State laws, and to regulations concerning well spacing and production prorationing to prevent waste. This, in turn, led to relatively steady crude oil prices, near $3.00 a barrel, in the settled production stage of the Gorham oil field in the late 1940's, the 1950's, and the 1960's.
Figure 18--Facsimile of notice "posted" by the Prairie Oil and Gas Company, July 13, 1931, reducing the price for Kansas crude oil to 22¢ a barrel for 40° gravity crude oil with penalties for lower gravity oil down to 10¢ a barrel.
Stripper stage of production, 1956-1986
As shown on the bottom graph of fig. 4, the Gorham oil field entered the stripper stage of its production history (averaged less than 10 BOPD per well) in 1955. Twenty years later in 1975, production had declined to an average of 4.56 BOPDPW. Many hundreds of Gorham oil-field wells were at or near their economic limit and would have been abandoned except that the Mideast oil crisis caused domestic crude-oil prices to rise dramatically in the mid-1970's as graphed in fig. 17. The high crude-oil prices of the second half of the 1970's and the first half of the 1980's, reaching $36/bbl, prolonged the production of many of those Gorham oil-field stripper wells for an additional 10 years and caused the drilling of many infill and re-entry wells. Note that there were 341 active oil wells in 1975, averaging 4.56 BOPD per well, increasing to 444 active oil wells in 1986, but averaging only 3.21 BOPDPW. The severe drop in the price of crude oil in 1986, the 60th year of the Gorham oil-field production, to as low as $10.50 a barrel in July of that year, may cause these small oil wells to be abandoned. This development may prevent the Gorham oil field from reaching the domestic "giant oil field" status of 100 million barrels of oil production.
Prev Page--Geology--Lansing-Kansas City, Permian || Next Page--History
Kansas Geological Survey, Geology
Placed on web Jan. 30, 2015; originally published 1991.
Comments to webadmin@kgs.ku.edu
The URL for this page is http://www.kgs.ku.edu/Publications/Bulletins/228/04_prod.html