![]()
Prev Page--Geology--Precambrian, Paleotopography || Next Page--Oil Production
Geology, continued
Lansing-Kansas City Group
Map, Lansing-Kansas City structure
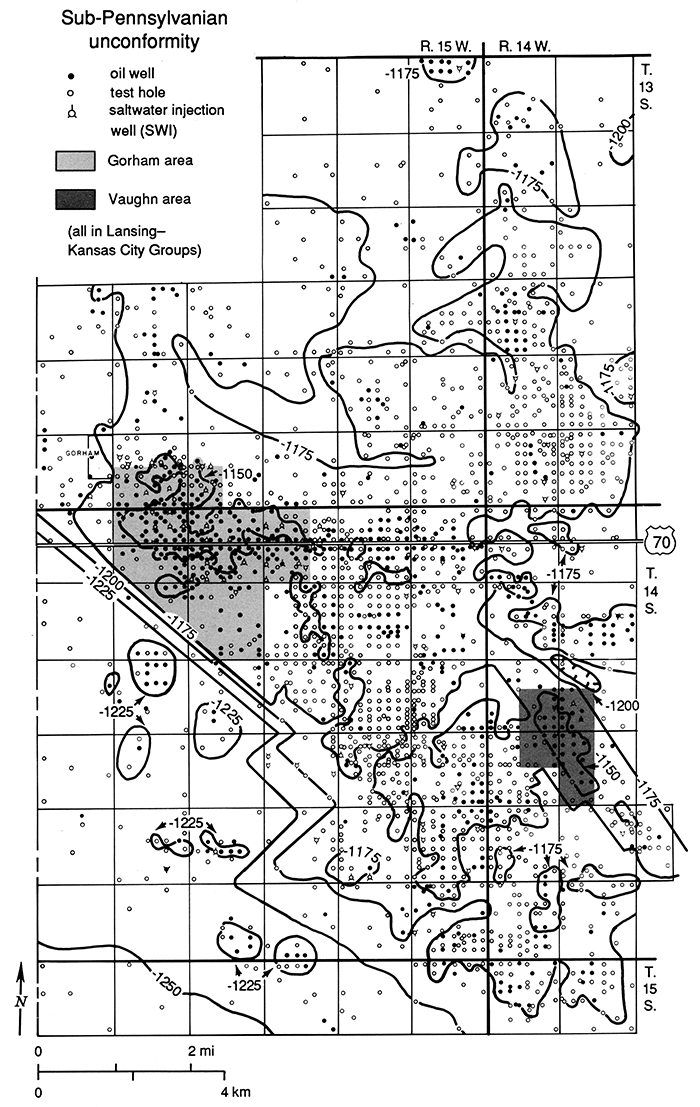
Pennsylvanian limestones interbedded with shales unconformably overlie the sub-Pennsylvanian surface, resting on Arbuckle beds over most of the area but resting directly on Precambrian rocks in the highest area. Oil production is derived from the porous, often oolitic, limestones in the Lansing-Kansas City Group. Structural attitude of the top of the Lansing-Kansas City is mapped in fig. 11 with a 25-ft contour interval. Oil wells known to have produced from these rocks are indicated by solid dots. Test holes, which penetrated the Lansing-Kansas City beds but did not produce oil from the Lansing-Kansas City Group, are mapped as open circles.
Figure 11--Structure of the Lansing-Kansas City Group, Pennsylvanian, contour interval 25 ft. Solid dots indicate oil wells known to the author to have produced from the Lansing-Kansas City limestones. Open circles indicate other test holes penetrating, but not producing from, the Lansing-Kansas City beds. Small closed areas outside the Gorham oil field are individual named oil fields (see fig. 2, p. 3), but within the Gorham oil field such areas are classified as a common source of supply for regulatory purposes. Of the total relief of 120 ft (36 m), over 60 ft (18 m) is due to the post-Lansing-Kansas City movement on the northwest-trending basement faults with less movement in the area of northeast cross faulting in the south-central part of T. 14 S., R. 15 W. Within the Gorham oil field proper, about 24 million BO, or one-fourth of the field's total production, was produced from the Lansing-Kansas City limestones.
Oil fields, Lansing-Kansas City
Outside the official boundaries of the Gorham oil field, but within the area mapped in fig. 11, are several small, named oil fields producing from the Lansing-Kansas City limestones. These are mapped in fig. 2 and include
- T. 13 S., R. 15 W.
- Air Base East; Kune; Kune South; Kune Southwest; Lacey; Lacey North; Lacey Northeast; Lacey Southeast; S and S Ranch
- T. 14 S., R. 15 W.
- Aley; Aley North; Baxter; Baxter East
- T. 15 S., R. 15 W.
- Donovan North
- T. 13 S., R. 14 W.
- Rogg; Salt Creek
- T. 14 S., R. 14 W.
- Hall-Gurney (part)
Within the official limits of the Gorham oil field are several clusters of Lansing-Kansas City oil wells. Geologically these are individual Lansing-Kansas City oil fields, completely separated from each other and functioning as discrete unrelated oil reservoirs. Two of the largest of these oil fields, the Gorham area (secs. 32 and 33, T. 13 S., R. 15 W. and secs. 3, 4, 5, 8 and 9, T. 14 S., R. 15 W.) and the Vaughn area (secs. 17,18,19, and 20, T. 14 S., R. 14 W.) are designated "areas" rather than oil fields on the Lansing-Kansas City map (fig. 11) for convenience of discussion. These two areas are further discussed in connection with secondary-recovery operations by waterflooding.
Oil reservoirs
In general, oil in the Lansing-Kansas City is structurally trapped on anticlines but production is also dependent on the development of porosity. The original reservoir mechanism for the Lansing-Kansas City reservoirs was solution-gas drive. This resulted in high initial production (the flush production stage) followed by rapid decline to less than 25 BOPD per well (the settled production stage), then to the "stripper" stage of less than 10 BOPD per well.
In the 1920's and 1930's, if a market could be found, wells were produced at their maximum capacity or "potential" until the reservoir energy became depleted. Often the gross ultimate recovery was only 10% of the oil in place. Secondary recovery by waterflooding added considerably to the cumulative oil recovery, sometimes doubling the production.
Lithology
In the Gorham oil field, Lansing-Kansas City rocks are encountered near 3,000 ft (900 m). They consist of 230 ft (69 m) of alternating limestone and shales. The limestone beds, often oolitic where oil-productive, provide individual oil reservoirs. Watney (1980a) has described the cyclical nature of the Lansing-Kansas City beds and discussed the environments of deposition, the diagenetic changes, and the lithologic properties, all illustrated with photographs of core slabs. For convenience in his study, limestone zones were designated alphabetically from A to K downward. The same or nearly identical nomenclature has been applied by operators in the Gorham oil field. Each porous limestone "zone" within the Lansing-Kansas City Group is a separate oil reservoir isolated from the other limestone beds by interbedded cyclical shales. However, once the beds have been drilled, the borehole itself serves as an interconnection, often even when oil-string casing has been set and cemented through the Lansing-Kansas City beds.
This is in part due to hole enlargement opposite the shales during drilling and to the difficulty of getting a tight cement bond opposite shales. In addition, the Lansing-Kansas City carbonate zones are customarily acidized. The acid may dissolve cement and channel up or down the hole interconnecting the zones. The Kansas Corporation Commission has ruled that all oil produced from the Lansing-Kansas City Group is a common source of supply and no distinction is made on a bed-by-bed basis as regards their regulation of allowed production, the keeping of statistics, or the issuing of permits for drilling of wells or for secondary-recovery operations by waterflooding.
Well-completion procedures
Lansing-Kansas City producing zones are evaluated today by drilling through one or more zones with oil shows detected by well-site examination of well cuttings or by logging of oil in the drilling mud. The zone drilled may then be evaluated by a drill-stem test in which the drill pipe serves as temporary casing permitting actual recovery of oil and the recording of reservoir pressures. Drilling then proceeds and the testing is repeated until the full section has been drilled and evaluated after which wire line open-hole logs are recorded, casing set and cemented, cased-hole logs recorded, and one or more zones perforated, tested, acidized, and put on production. Zones are selectively perforated from the lowest upward as it is easier to set a plug inside the casing and work above the plug. Otherwise, to test a deeper zone below perforations, it is necessary to squeeze off the perforations with cement (a costly procedure) before testing a deeper zone. Alternatively, the perforations can be isolated by using a packer and tubing.
The situation was quite different in 1926 when the Gorham oil field was discovered. All drilling was by cable tools. Fluids encountered during drilling, whether oil or saltwater, moved directly and immediately into the borehole while drilling. Thus when the first, most shallow oil-producing zone in the Lansing-Kansas City was encountered, oil was "struck," pipe set, and the well completed "natural," i.e. without acidizing. The zone was then produced "wide open" if a market could be found, resulting in high original production, rapid decline, and the recovery of only a small percentage of the oil in place. Note that the production graphs (fig. 4) show oil production in the 1920's averaging 80 BOPD per well in 1928, declining rapidly in the early 1930's to 18 BOPD per well. Prior to 1928, all the oil produced in the Gorham oil field was from the "Oswald" formation near 3,000 ft (900 m) as the Lansing-Kansas City Group was then called. Some "Oswald" oil wells were depleted and the wells abandoned before it was recognized that wells drilled deeper might "discover" another pay zone in the "Oswald" or a still deeper pay zone in the Arbuckle or basal sand. Almost all of the early Kansas City oil wells drilled with cable tools were deepened later, sometimes by a new operator after abandonment by the original owners.
Acidization
A major breakthrough occurred in January 1933', when Central Petroleum Co., operated by Nathan Appleman, introduced to the U.S. oil business the application of inhibited hydrochloric acid to increase oil production from limestones (Oringderff, 1984). The acidization of two oil wells in the Fairport oil field, 9 mi (14.4 km) north of the Gorham oil field, was successful and Appleman, who held an option to purchase most of the oil-producing leases in the Fairport oil field, exercised his option. Acidization by his company of the original western Kansas discovery well, the Oswald No. 1, increased production from 2 BOPD to 108 BOPD. Similar spectacular results were obtained from acidizing 33 more wells. Appleman then applied this form of secondary recovery by acidizing his Central Petroleum Company's Gorham leases in 1933 with similar results. Other operators immediately acidized their oil wells. The acidization of oil wells producing from limestone and dolomites is no longer viewed as a secondary-recovery process but is a routine part of new well completion.
Accidental waterflooding, 1940's
In the 1940's in the Vaughn area of the Gorham oil field (known then as the Vaughn oil field), accidental waterflooding of Lansing-Kansas City zones in oil wells resulted in a great increase in the production from surrounding oil wells (Roy P. Lehman, personal communication, 1975). This was initiated by the accidental break-in of corrosive natural brines from the Cheyenne or Cedar Hills Sandstones at depths of 500 to 800 ft (150-240 m) below the surface through holes corroded in the oil-string casing. Water from those zones poured down inside the oil-string casing and flooded the open-hole Lansing-Kansas City producing zones near 3,100 ft (930 m), causing dramatic production increases in surrounding oil wells. When operators realized what was causing such increases in oil production, some illicit midnight well-perforating of casing opposite the Cheyenne-Cedar Hills Sandstones took place.
The production graph (fig. 4, top graph) shows the all-time high in annual oil production for the Gorham oil field in 1942. Production in that year increased 38% over the prior year, 1941, even though there were four fewer oil wells. A considerable part of this increase was due to the break-in of "Dakota" water through corroded casing causing accidental waterflooding of the Lansing-Kansas City beds.
An example of such accidental production increase is the six-well Carroll lease, the SE sec. 18, T. 14 S., R. 14 W., which produced oil from structurally high Lansing-Kansas City beds overlying the Vaughn quartzite hill. The Carroll lease, developed in 1937-39, had a production decline of 17% per year for the years 1939 and 1940, declining to an average daily production of 18.7 BOPD per well in 1940. During 1941, the same six wells increased production by 50% to 28 BOPD per well. In the following year, 1942, production increased by an additional 73% to 106,880 BO or an average of 48.8 BOPD per well from the same six wells. This was followed by a decline to 7.4 BOPD per well by the end of 1946. From 1937 through 1946 inclusive, the cumulative production was 578,076 BO or nearly 100,000 BO per well. Secondary recovery by waterflood was responsible for 244,000 BO or 42% of the production. Ultimately, after drilling the wells deeper into additional Lansing-Kansas City production zones, and installing a planned waterflood in 1957, the Carroll lease produced 1,348,989 BO or 224,000 BO per well from the six wells. The structurally high Lansing-Kansas City limestones in the Carroll lease, located on a sharp anticline above the Vaughn quartzite hill, are representative of the best Lansing-Kansas City oil production in the Gorham oil field.
A second area where accidental waterflooding occurred was the E/2 sec. 3, T. 14 S., R. 15 W. on the Foster-A, Foster-B. and Witt leases. "Dakota" water disposed in nearby shallow saltwater-distribution (SWD) wells moved past the uncemented casings of oil wells, corroding holes in the casing of some wells. The corrosive waters flooded down the casing of those wells, out into the Lansing-Kansas City porosity, causing dramatic increases in oil production from adjacent oil wells as described in detail in the environmental section of this book on p. 73.
Waterflooding, 1960's-1970's
In 1962, Homestake Production Co. of Tulsa initiated an extensive secondary recovery project by waterflooding 1,800 acres (720 hectares) south and east of the town of Gorham (Bass, 1966) in secs. 32 and 33, T. 13 S., R. 15 W. and secs. 3, 4, and 5, T. 14 S., R. 15 W. The area, which had been essentially abandoned since the 1940's, included the original Gorham oil field of the 1920's and 1930's, located on the summit of the Gorham granite hill and on its north and east flanks. Homestake's oil wells were drilled mostly in the center of 40-acre (16-hectare) tracts on a five-spot pattern centered among four abandoned oil wells each in the center of a 10-acre (4- hectare) tract. Injection wells were drilled at the corners and the center of each 160-acre (64-hectare) quarter section. Most wells drilled directly out of Pennsylvanian limestones and shales into "granite wash."
The maximum number of water-injection wells was 46 in 1965, the same year that the maximum 58 oil wells were active. Water was injected into the Lansing-Kansas City zones near 3,050 ft (915 m; and some into the Shawnee-Topeka zones near 2,750 ft [825 m]) under well-head pressures from a low of 364 lbs/inch2 (psi) in 1965 to a high of 550 psi in 1966-68. Source of water was a 600-ft (180-m) "Dakota" watersupply well used in 1962 to 1965. While drilling new oil wells and water-injection wells, an unexpected bonus was obtained when several new wells encountered an undrained updip wedge edge of Reagan or Gorham sand in sec. 32, T. 13 S., R. 15 W. Thereafter, beginning in 1965, water produced with oil from the Gorham sand oil wells was introduced into the Lansing-Kansas City flood because it was available and was less corrosive than the Dakota water (Bass, 1966). Statistics for secondary or enhanced recovery of oil from the Homestake project are quoted from annual publications at the Kansas Geological Survey (appendix, table 8) to 1982, at which time the service was discontinued. Oil produced by secondary recovery in the Homestake project reached a maximum of 287,442 bbls during 1964, the second year after water was injected. Production declined about 12% per year to 71,720 bbls per year in 1972 from 32 oil wells with 10 injection wells. Production in the range of 66,000 bbls per year prevailed in the five years to 1977, then declined to 20,000 BO in 1982. Ultimate production was 2,5l3,OOO BO. Not all of the oil recovered can be attributed to secondary recovery by waterflood because the statistics quoted include oil production from Reagan Sandstone wells drilled in the project area.
Other successful Lansing-Kansas City waterflood projects were undertaken throughout the Gorham oil field in the 1960's and 1970's. These included projects in secs. 17, 18, 19, 20, 30, 31, and 32, T. 14 S., R. 14 W. Other projects were located in secs. 10, 11, and 36, T. 14 S., R. 15 W. and in sec. 6, T. 15 S., R.14 W.
The beneficial results of this period of extensive secondary recovery by waterflooding can be seen in fig. 4 (p. 6), the top graph, where the increase in production is labeled "waterflood."
Summary
Oil wells producing from Lansing-Kansas City limestones flowed gassy oil initially in structurally high areas such as the Vaughn area and the Gorham granite hill area, the oldest part of the Gorham oil field. The Lansing-Kansas City oil wells were characterized by vigorous natural production followed by rapid decline with a recovery of only a small portion of the oil in place, perhaps 10%. The reservoir energy was solution gas drive, with little water produced. In 1933, it was discovered that the Lansing-Kansas City oil wells responded to acidization. In the 1940's, accidental waterfloods greatly enhanced oil production from these nearly water-free solution-gas reservoirs. This was followed in the 1960's and 1970's by extensive and successful planned waterflooding of many separate areas within the Gorham oil field.
Oil production from the Pennsylvanian Shawnee Group
About 60 oil wells in the Gorham oil field produce oil from limestones in the Shawnee Group. Shawnee limestone oil production falls into two classes: wells producing from intercrystalline porosity (not mapped) and wells producing from fracture porosity (fig. 12, solid dots).
Toronto and Plattsmouth oil production
Within the Shawnee Group, the lowest bed, the 18-ft (5.4-m)-thick Toronto Limestone Member of the Oread Formation, occurs below the Heebner Shale, a 4-ft (1.2-m)-thick, black, carbonaceous, highly radioactive shale, depth near 2,900 ft (870 m). The Heebner Shale is used as a dependable, persistent, stratigraphic correlation point. Just above the Heebner Shale is the 80-ft (24-m)-thick Plattsmouth Limestone Member of the Oread Group. When these formations were drilled with cable tools in the 1920's and the 1930's, "oil shows" were noted but usually the holes did not fill with oil. These oil shows were passed up and the wells drilled to the deeper, more prolific Lansing-Kansas City limestone reservoirs. However, during the period from 1960 to the late 1980's, excellent wire line logs became available. These logs recorded various properties through measurement of gamma radiation, neutron radiation, resistivity, conductivity, spontaneous potential, density, and sonic velocity, or often combinations of these curves, making it possible to localize and partially evaluate oil-productive porous zones from the logs. Extensive acidizing of what were formerly just "oil shows" has resulted in small but commercial oil wells. Production data are difficult to impossible to obtain. For the most part, these wells are in structurally high areas, which also produce from the Lansing-Kansas City and the oil production is comingled. Shawnee oil production from intercrystalline porous zones is largely due to technical advances during the second half of the 60-year history of the Gorham oil field. Operators often term all such production "Topeka" and do not distinguish between it and the fracture production next discussed, which occurs 200 ft (60 m) higher in the section.
Topeka fracture-zone oil production
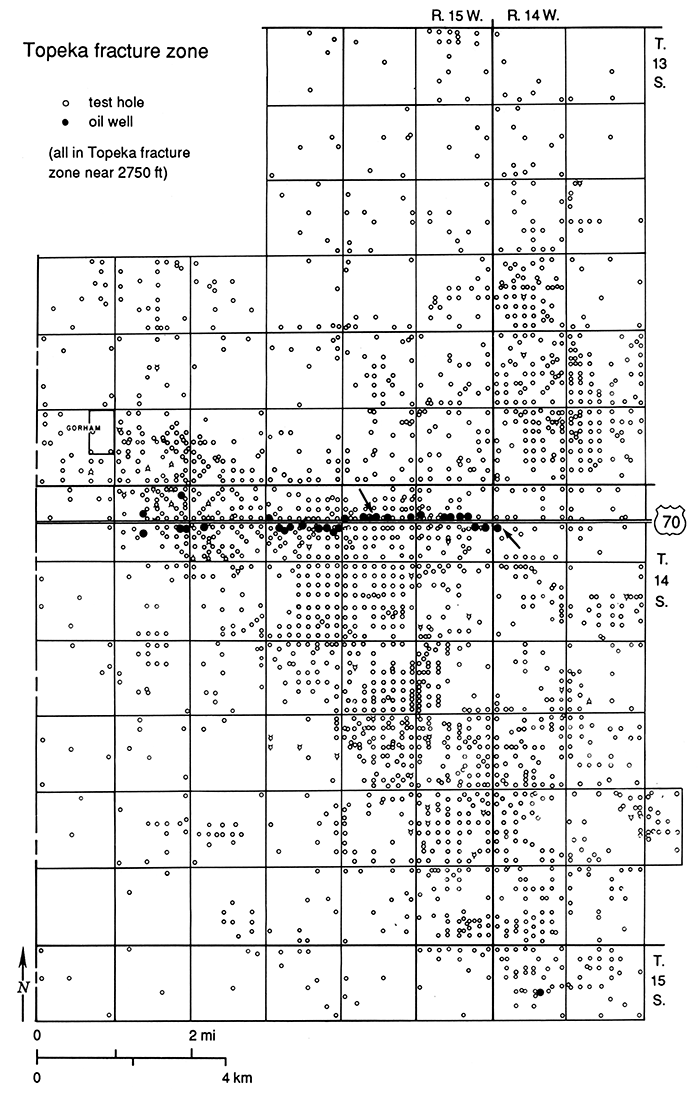
Fig. 12 shows the unusual distribution of Topeka Limestone oil wells producing from a fracture zone (solid dots). Most of the wells known to have produced from the Topeka fracture zone are aligned in a nearly straight east-west line, which by chance coincides with the location of I-70 through the centers of sec. 6, T. 14 S., R. 14 W., and secs. 1,2,3,4, and 5, T. 14 S., R. 15 W. The following facts confirm that Topeka oil production is associated with a large-scale fracture zone:
Figure 12--Locatlon of wells that produced oil from the Pennsylvanian Topeka fracture zone near I-70. Solid dots in a west to east alignment indicate the location of 29 oil wells that produced an average of over 200,000 BO per well from a fracture zone in the Topeka Limestone, depth near 2,700 ft (810 m). The Topeka oil well in sec. 6, T. 15 S., R. 14 W., may indicate a second fracture zone (p, 30). Open circles indicate the location of the other 2,138 test holes penetrating the Topeka without finding oil production in the fracture zone. Thin slanting arrows mark the two giant oil wells described on p. 30.
- The Topeka production is from the limestone, depth near 2,750 ft (825 m), which shows no intercrystalline porosity and no oil staining.
- The alignment of 29 oil wells is in a nearly straight east-west line 5 mi (8 km) long and such wells are generally absent elsewhere.
- Oil occurrence is erratic and limited. Operators carefully watched offset wells in locations north or south of the producing zone but failed to find Topeka production even when the offset wells were structurally flat with, or higher than, the Topeka fracture-zone oil wells.
Two unique giant oil wells are marked in fig. 12 by thin, slanting arrows. They are Topeka fracture-zone wells that have large oil-producing capacity. One of the giant oil wells is Phillips Petroleum Company's Amelia No. 2, drilled in September 1937 in the C NW NW SW sec. 6, T. 14 S., R. 14 W., which has produced over one-half million barrels of oil from the Topeka fracture zone, depth 2,766 to 2,771 ft (830-831 m), and was still producing 18 BOPD in 1986. The Amelia lease has a cumulative production of 579,108 BO to January 1, 1987, nearly all of which is from Amelia No. 2. This giant oil well has been offset by carefully watched dry holes drilled 1,200 ft (360 m) northwest in 1952, 660 ft (198 m) north in 1938, 933 ft (280 m) northeast in 1981, 660 ft (198 m) east in 1987, and 737 ft (221 m) southeast in 1941. Only the west offset, Dumler No.4, on-trend 660 ft (198 m) west in the NE NE SE sec. 1, T. 14 S., R. 15 W., encountered Topeka fracture-zone production. Amelia No. 2 is considered to have encountered an open fracture zone, oil-filled, presumably (judging by the unusually large production) part of an extensive fracture system.
The second giant oil well is the Hartman and Blair Roubach No. 1, C SE SE NW sec. 2, T. 14 S., R. 15 W. It is discussed in the historical section of this report and illustrated by figs. 32 and 33. The Roubach No. 1, drilled with cable tools as a wildcat well, is believed to have produced about one million barrels of oil from the Topeka, depth 2,787-2,793 ft (836-838 m). This giant oil well had an official stated potential of 4,076 BOPD on April 29, 1935. The well blew the cable tools halfway out of the hole and flowed a solid 8-inch stream of oil the night of April 22,1935; the well flowed uncontrolled for two days, dumping an estimated 450 BO per hour upon the ground. The 160-acre (64-hectare) Roubach lease produced 2,563,014 BO to January 1, 1987, and was then producing 7.28 BOPD from the last well on the lease. The early flush production on the Roubach No. 1 well was closely watched by offset owners (Virgil B. Cole, personal communication, 1977), who immediately drilled 10-acre (4-hectare) offset wells 660 ft (198 m) east, 660 ft (198 m) south and 733 ft (220 m) southeast, respectively; however, all failed to encounter the fracture zone and found the Topeka nonproductive.
All but four of the Shawnee oil wells producing from the described Topeka fracture zone were discovered in the 1930's by drilling with cable tools. When the fracture was drilled into, the open cable-tool holes filled several hundred feet with oil or flowed oil. It is probable that many additional undiscovered fractures or fracture zones exist within the Gorham field, but subsequent development wells were drilled with rotary tools circulating a hole full of mud making recognition of fracture zones difficult.
Topeka oil from a fracture-zone reservoir was discovered in 1976, in a rotary-drilled hole, the No. 1 Mudd, in the C E/2 W/2 NW SE sec. 6, T. 15 S., R. 14 W. After unsuccessful testing of lower formations, the Topeka limestone was perforated from 2,646 to 2,648 ft (794-795 m), on the recommendation of the well-site geologist M. F. "Hap" Pryor (personal communication, May 20,1976), based on his knowledge of the potential for production from Topeka fracture zones, his observation that during drilling circulation was lost at 2,675 ft (802 m), and that in "rebuilding the mud system, free oil was noted in the pits." The Mudd No. 1 was reported as completed for a modest 25 BOPD from the Topeka. It produced 13,834 BO in seven months of 1976 before the No. 2 and 3 wells producing from the Arbuckle were completed and their production comingled in the lease tank battery with the Topeka oil.
Analogy, Topeka fracture zone and Wisconsin fractures
The fracture system encountered by the oil wells producing from the Topeka fracture zone in the Gorham oil field (fig. 12) may be compared to similar fracture systems in Wisconsin where commercial deposits of zinc and lead are localized by fracture systems. Fig. 13A is a map of the zinc and lead mines, now mostly depleted and abandoned, in a portion of what is known as the "upper Mississippi Valley zinc-lead district." The map is adapted from the classic paper by Heyl et al. (1959). Comparable disseminated zinc and lead deposits in sedimentary rocks are now recognized the world over as MVT (Mississippi-Valley-type) ore deposits from this area. Host rocks are Paleozoic carbonates, principally the Platteville and Galena formations of Middle Ordovician age. The formations are characterized by low dips, commonly one-fourth of 1° (25 ft/mi). Ore-bearing fluids migrating through the regional fracture porosity were sodium chloride brines similar to midcontinent oil-field brines. The brines migrated in late Paleozoic time in both the midcontinent oilfield area and in the zinc-lead district. In Wisconsin, dissolution of carbonate rock occurred in connection with brine flow during migration. Studies since this 1959 classic have recognized the major role of dissolution slumping as a tectonic force, forming not only normal (tensional) faults but also reverse faults by gravitational compression. Contemporary studies of such ore deposits use fluid inclusions in crystals for analyses of the fluid itself (sodium chloride brine, sometimes hydrocarbons) and as indicators of paleotemperatures (commonly low--almost in the range of temperatures of brines produced with oil in Kansas).
Figure 13a--Zinc and lead mines (black) in the upper Mississippi Valley zinc-lead district, Lafayette County, Wisconsin, T. 1 N., R. 1 and 2 E., from Heyl et al. (1959, plate 5). Ore distribution is controlled by fracture systems in nearly flat-lying Ordovician carbonate rocks of the Decorah and overlying Galena formations. Figure 13b--Topeka fracture zone in the Gorham oil field (black), redrawn diagrammatically from well control in fig. 12. The scale and area (40 mi2 [104 km2]) are identical in figs. 13a and 13b.
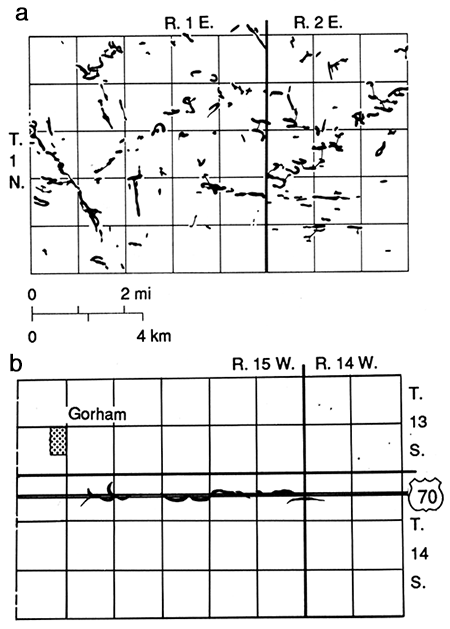
The two districts, upper Mississippi Valley and midcontinent oil fields (including the Gorham oil field), have much in common. Fig. 13b is a diagram of the Topeka fracture zone in the Gorham oil field based on the well control shown in fig. 12. Note that the Wisconsin mine map and the Topeka fracture-zone map have the same scale, cover the same size area, and both have fracture systems with individual fractures to 1 mi 0.6 km) long.
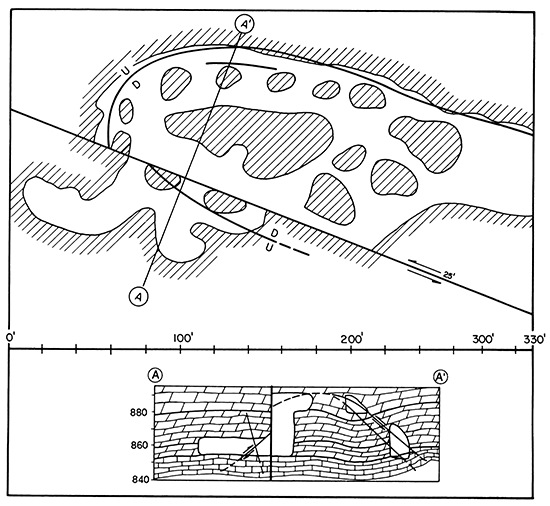
Why are so few fracture zones recognized in the Gorham oil field and elsewhere in central Kansas? For a partial answer to that question, one of the many mines described by Heyl et al. (1959), the Liberty mine, is illustrated in fig. 14. In the plan view of the Liberty mine, the hachured areas are the unmined pillars and walls. The mined areas are blank in both the plan and the cross section. High-angle reverse faults merge in the roof area into bedding-plane faults. The mine ceiling is about 40 ft (12 m) high. The important vertical fault in the mid-part of the cross section has no vertical movement at all. Within the mine, one could step right across this important ore-controlling fault with no change in the floor level. However, note the 25 ft (7.5 m) of lateral or horizontal movement. The cross section is drawn to natural scale; the horizontal and vertical scales are the same in both the plan and the cross section. The length of the mapped area is 330 ft (99 m). All of this faulting, slumping, solutioning, and localized ore mineralization occurs within 330 ft (99 m), only onehalf of the 660-ft (198-m) distance between oil wells drilled on 10-acre (4-hectare) spacing, as is the case in much of the Gorham oil field. It is understandable that a small-diameter 7-7/8-inch nearly vertical oil test hole has only a slight chance of encountering a fracture or fault system comparable to the mineralized fractures of the upper Mississippi Valley district.
Figure 14--Map and cross section of the Liberty mine, NE sec. 16, T. 2 N., R. 1 E., Lafayette County, Wisconsin, from Heyl et al. (1959, fig. 23, p. 38). The diagonally shaded areas are pillars or mine walls. The mined area is blank. Cross section A-A' is drawn natural scale with no vertical exaggeration. The cross section and the map are the same scale in feet. The three high-angle reverse faults are due to gravity compression in response to slumping from partial dissolution of underlying carbonate beds. The vertical fault has no vertical displacement but has 25 ft (7.5 m) of horizontal movement. Faults and fractures controlled flow paths of low-temperature saline solutions carrying zinc and lead in solution.
Waterflooding, Shawnee Group, Toronto and Plattsmouth formations
Recovery of additional oil by waterflooding these Shawnee or "Topeka" reservoirs was attempted by Homestake Production Company in 1963 in connection with its major Lansing-Kansas City waterflood of 1,800 acres (720 hectares). A Topeka injection well was completed in the C NW sec. 3, T. 14 S., R. 15 W., and offset producing wells were open to the Topeka with some favorable response in the reservoir resulting from water injection, according to Bass (1966). He stated that "two later wells drilled in the center and on the west edge of the [1,800-acre] project had initial production tests of over 250 BOPD per well from the Topeka." These two large Topeka wells were probably drilled into fractures related to the 5-mi (8-km) fracture zone previously described.
Subsidence areas
As discussed in the environmental section of this report, subsidence areas affecting I-70 are located exactly on the principal Topeka fracture zone in secs. 1-5, T. 14 S., R. 15 W. The subsidence areas are related to the fracture zone (Walters, 1978, p. 68-73).
Pennsylvanian-Wabaunsee Group
In oil-field usage, the term "Tarkio" is applied to oil production from any of several formations within the Wabaunsee Group. Tarkio oil production is obtained from fine-grained sandstone or silty sandstone. Within the cyclical formations of the Wabaunsee Group, various limestones are the most laterally persistent members and, hence, the most readily reeognized formation on cable-tool driller's logs or on wire line geophysical logs. Shales separate these limestones. Within the shale, a lenticular series of silty sand lenses are developed, sometimes filling incised channels. Formations in oil-field terms are
| Limestone | Shale | Silty sand facies |
|---|---|---|
| Grand Haven | "Dry shale" | first Tarkio sand |
| Dover | Langdon (renamed Pillsbury) | second Tarkio sand |
| Tarkio | Willard | third Tarkio sand |
These formations occur within a 135-ft (40.5-m)-thick section drilled from 2,440 to 2,570 ft (732-771 m) near the town of Gorham or at even more shallow depths of 2,300-2,435 ft (690-730.5 m) in topographically low valley areas.
Tarkio oil is stratigraphically, not structurally, trapped. It was largely noncommercial during the cable-tool drilling years, approximately 1926-1946, as these "tight sands" had "oil shows" but the formations usually did not yield oil into the cable-tool open hole. Tarkio oil wells in the former Sullivan oil field in sec. 1, T. 14 S., R. 15 W. were early exceptions in 1935. The post-war technical development of hydraulic fracturing in the late 1940's, patented by Stanolind Oil Company Research Laboratories and licensed to various service companies, was a stimulation process that led to major Tarkio development drilling in the 1950's, mostly in the adjacent Hall-Gurney oil field, but extending into the Gorham oil field. Tarkio oil reservoirs have solution-gas drive as the oil-producing mechanism. The Tarkio oil wells are gassy and are characterized in the field by their smaller pumping equipment and by their gas flares.
The Kansas Corporation Commission recognizes the Gypsy Oil Company's #1 Erhlich in the SW SW NW sec. 1, T. 14 S., R. 15 W., drilled in 1935, as the discovery well for the Wabaunsee Group, Tarkio oil, in the former Sullivan Pool, which straddled the Topeka fracture zone. Ver Wiebe (1938) noted that "a large amount of the total oil produced to date has come from the Tarkio."
Permian Council Grove and Chase Groups
Oil production rarely was obtained in the Gorham oil field from limestones of the Council Grove and Chase Groups. The occurrences are related to the 5-mi (8-km)-long fracture zone in the north part of T. 14 S., R. 15 W. The Kansas Corporation Commission recognizes as the discovery well of the Council Grove Group, the Hartman et al. #1 Roubach, SE SE NW sec. 2, T. 14 S., R. 15 W., August 7, 1936.
The Chase Group of rocks, thickness 350 ft (105 m), encountered near depths of 1,800 ft (540 m), consists of cherty limestones and interbedded shales. No discovery well is recognized for the Chase Group rocks, but rare noncommercial oil and gas shows have been recorded in cable-tool holes. While drilling with cable tools through the Chase Group in 1935, the Hartman et al. Roubach #3, C NE SE NW sec. 2, T. 14 S., R. 15 W., caught fire from a gas show and burned with a loss of rig and of drilling records for the depths 1,875-2,060 ft (562.5-618 m). Apparently no gas was sold from the Roubach lease or elsewhere in the Gorham oil field.
Permian Sumner Group
Sumner Group, an aquitard
The Sumner Group has a thickness of 800 ft (240 m). The rocks consist, in upward sequence, of interbedded shales and anhydrites of the Wellington Formation; the Hutchinson salt; and silty shales and siltstones ("red beds") of the Ninnescah Formation. The Stone Corral anhydrite marks the top of the Sumner Group.
No oil occurs in the Sumner Group rocks and there are no oil shows. The Sumner Group is an aquitard--a non-water-bearing, non-reservoir, "tight" formation that is as devoid of permeability, hence, water, as any unit of sedimentary rocks of comparable thickness. The capping or confining role of the Sumner Group in the Gorham oil field was summarized by Walters (1978): "It is noteworthy that all of the porous zones or aquifers below the Sumner Group from the Chase Group next below to and including cracks in the Precambrian granite, depth near 3,350 feet, are in some area of the Gorham oil field, an oil or gas reservoir, indicating general saturation of the anticline with hydrocarbons and indicating upward leakage probably through fracture systems such as that known in the Topeka Limestone of the Shawnee Group. None of the porous zones or aquifers above the Chase Group have any hydrocarbon shows testifying to the imperviousness of the Sumner Group red beds and salt as a seal inhibiting fluid movement, either up or down, of hydrocarbons or water."
Hutchinson Salt Member
The Hutchinson Salt Member of the Wellington Formation, Sumner Group, has been described and mapped by Watney (1980b) and Watney and Paul (1980). Walters (1978, fig. 32, p. 62) published a map showing the thickness of the Hutchinson salt in the Gorham oil field. These salt beds, drilled at depths near 1,300 ft (390 m) are shown on cross sections A-B and B-C (figs. 5 and 6). The thickness varies from 322 ft (96.6 m) in the structurally low area near mile 1 to as little as 250 ft (75 m) in the structurally high area, mile 5 on the cross sections. About one-third of the total salt section consists of interbedded shale. The Hutchinson salt affects the drilling operation and evaluation process in that all oil test holes drill through 250 ft (75 m) or more of salt; thus rotarydrilling fluids are converted from freshwater-based systems to brine systems. This restricts the use of certain wire line logs such as the self-potential log.
As shown on the oil-field map (fig. 2), 2,168 oil test holes have been drilled through the Hutchinson salt in the Gorham area. Many oil test holes were abandoned in unplugged or poorly plugged condition (Walters, 1978, p. 66). As a result, dissolution of the salt has occurred. Areas affecting I-70 are discussed as the Witt, Crawford, and Roubach sinks in the environmental section of this report and are shown on a cross section (fig. 45).
Stone Corral Formation
The Stone Corral anhydrite encountered near 900 ft (270 m) marks the top of the 800-ft (240-m)-thick Sumner Group. It is a 40-ft (12-m) bed made up of two massive anhydrites separated by a shale. The structural attitude of the Permian Stone Corral anhydrite is mapped in fig. 15 with a contour interval of 25 ft above mean sea level. The map is based on selected control points of wells having excellent wire line logs through the Stone Corral section. Fig. 15 shows about 50 ft (15 m) of post-anhydrite faulting and/ or differential compaction of the underlying shaly Permian red beds where they are draped over the Gorham anticline or over the buried Precambrian quartzite hills of the eastern portion of the Gorham oil field. The map also shows the regional northwest dip on the anhydrite here interrupted by the prominent Gorham anticline.
Figure 15--Structure of the Stone Corral anhydrite, Permian, depth near 900 ft (270 m), contour interval 25 ft above sea level. A structural closure marks the northwest-trending axis of the Gorham anticline with about 50 ft (15 m) of post-anhydrite faulting and/or differential compaction of the Permian red beds. The Stone Corral mapping shows movement on both the northwest major fault zone and the northeast cross fault zone.
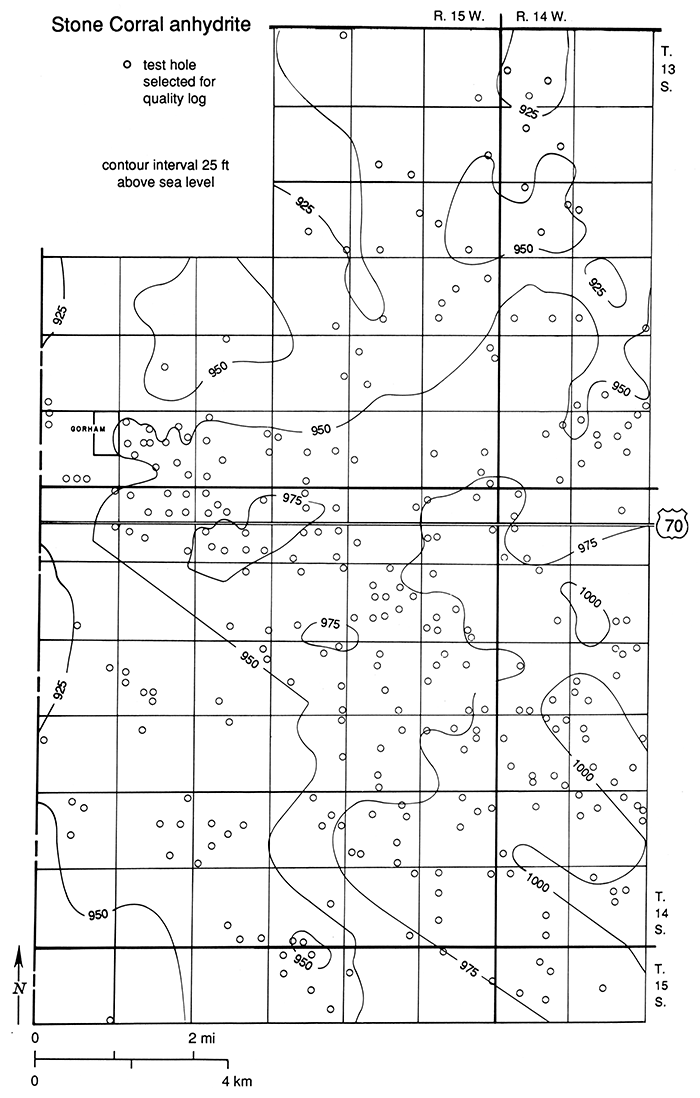
The major migration of petroleum into the Gorham oil field, filling all available porosity below the seal of the Sumner Group, took place in midPermian time (Walters, 1958), about contemporaneously with the deposition of the Stone Corral Formation of the Sumner Group.
The Stone Corral is important in the oil business because it provides an easily recognized formation for structural mapping and is a strong reflecting zone for seismic studies. Most seismic studies use the Stone Corral as a reference plane for making thickness maps from the Stone Corral to various lower horizons. In shallow geophysical work investigating subsidence along I-70 (Steeples et al., 1986), the Stone Corral provided a definitive reflection, permitting mapping of downfaulted blocks of anhydrite in areas where salt has been partly removed by dissolution.
Permian Nippewalla Group
Nippewalla Group rocks also are largely "red beds," forming a shaly, silty aquitard except for the Cedar Hills Sandstone, an aquifer that is the uppermost bed in this group. This westward-dipping porous sandstone, thickness of as much as 90 ft (27 m), thins eastward due to truncation at the subCretaceous unconformity and is absent in the northeastern portion of the area mapped. Cross sections A-B and B-C (figs. 5 and 6) illustrate about 200 ft (60 m) of northeastward thinning of the Permian section by pre-Cretaceous truncation. The Cedar Hills Sandstone is absent in wells 47 to 53 at miles 12 to 14 at the northeast end of cross section B-C.
The Cedar Hills Sandstone directly underlies the Cretaceous Cheyenne Sandstone throughout much of the Gorham oil field. The two formations are difficult to distinguish, particularly in rotary-drilled holes even with the use of wire line logs. The two formations were differentiated by cable-tool drillers in the 1920's and the 1930's by the color difference, an aspect that is not detectable on wireline geophysical logs. Cable-tool drillers looked for the red color of the Permian Cedar Hills Sandstone (which "washed red"), while drilling through the white Cheyenne sand. It is interesting to note that after detailed mineralogical and petrographic study, Swineford and Williams (1945) concluded that "the outstanding distinguishing characteristic of the Permian redbeds is their red color," and that "the red color and the associated scarcity of pyrite are the only features determinable by us which serve to differentiate between the Permian sands and the rounded facies of the Cheyenne."
In cross section A-B (fig. 5), wells 9, 20, and 24 were formerly used as shallow SWD wells into which waste oil-field brine was injected under pressure into the Cedar Hills Sandstone and the Cheyenne Sandstone.
The Kansas Corporation Commission is still permitting the Cedar Hills Sandstone to be used for shallow disposal of waste oil-field brines in new SWD wells except in the vicinity of the subsidence areas affecting I-70 (Don Butcher, personal communication, January 1990).
Cretaceous rocks
Structure, Fence-post limestone
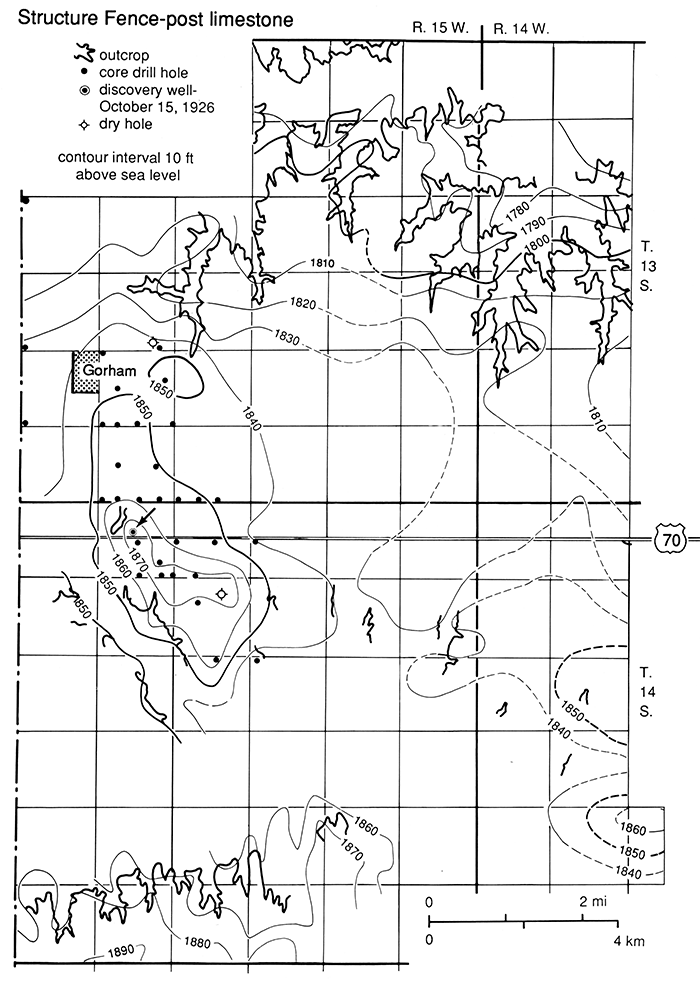
Cretaceous rocks crop out within and near the Gorham oil field. The structural attitude of these surface and near-surface rocks is illustrated in fig. 16, contour interval 10 ft. The prominent Gorham anticline as contoured on the Fence-post limestone or "post rock" has 30 ft (9 m) of closure in a critical southwest direction. Outcrop control is excellent and detailed in the rugged hill and valley terrain of northern parts of T. 13 S., R. 14-15 W., as shown by the pattern of continuous outcrops. Control also is excellent in the hills in the southern portion of T. 14 S., R. 15 W. Scattered small outcrops within the oilfield area indicated that closure was present as later confirmed by the core drill holes shown on the map. Control is lacking in the mid-portion of T. 14 S., R. 15 W. along the Big Creek bottomlands and is almost entirely lacking in that portion of T. 14 S., R. 14 W. mapped in fig. 16 in a reconnaissance manner (dashed lines).
Figure 16--Structure of the Fence-post limestone or "post rock," Cretaceous; contour interval 10 ft. Based on outcrops (heavy black lines) and core holes (solid black dots) drilled to the "post rock" in 1924-25. Arrow indicates the discovery well of the Gorham oil field, completed October 15, 1926. A previously drilled dry hole is located 1.5 mi (2.4 km) southeast, within the top closing contour (Hintze, 1928). A second prior dry hole is mapped 2.5 mi (4 km) north. This is a historical map, redrafted from a copy of the original core-drill map used by Tom Allan (deceased 1985) to locate the discovery well. This map shows 30 ft (9 m) of post-Cretaceous closure in a critical southwest direction directly above the northwest-trending Precambrian fault zone (fig. 7).
Aquifers; the Dakota and Cheyenne Sandstones
The Fence-post limestone and other members of the Greenhorn Formation are underlain by 40 ft (12 m) of black Graneros Shale which, in turn, rests on a thick sandstone-shale series shown on cross sections A-B and B-C (figs. 5 and 6) as undifferentiated Dakota-Kiowa formation. Sandstones in the upper portion of the Dakota-Kiowa formation were orginallya freshwater aquifer, whereas sandstones in the lower portion were and are brine-bearing. These crossbedded fluvial and massive channel sandstones with interbedded brightly colored shales are readily distinguished from the underlying white horizontally bedded marine Cheyenne Sandstone, a brinebearing aquifer. The Cheyenne Sandstone and the lower Dakota Sandstone, east of the wedge-edge of the Cedar Hills Sandstone, are interconnected hydraulically in the northeastern portion of the study area. Saline waters from this system discharge under natural conditions into the alluvium of Salt Creek, an east-flowing tributary which joins the Saline River just 2 mi (3.2 km) northeast of well 53, cross section B-C (fig. 6). Both streams were named by settlers more than 50 years before the discovery of oil in western Kansas at the Fairport oil field in 1923. This saline aquifer system was penetrated in 1894 by the Fay artesian well (Bailey, 1902) in the SE sec. 14, T. 12 S., R. 15 W., 3 mi (4.8 km) north of the study area. The Fay well, drilled to a depth of 121 ft (36 m), flowed 30 gallons per minute of saline water, specific gravity 1.0109, with 16,146 mg/L total solids, and with a shut-in pressure of 15 psi.
The basal Cretaceous Cheyenne Sandstone was extensively licensed for use as a shallow saltwater-disposal zone from the 1930's to the 1960's. Only during the 1940's did the State Board of Health allow disposal of oil-field brines into the lower part of the Dakota for a brief time.
The casing program in wells drilled through the Cretaceous beds was determined by the water-bearing properties of those beds. In holes drilled with cable tools, casing was set when a hole full of water was encountered, in order to be able to drill deeper. When drilling with rotary tools, surface casing was commonly set at 250 ft (75 m) to protect the freshwater beds, but not deep enough to case off the brine-bearing lower sandstones of the Cretaceous. In recent years, however, surface pipe has been set near 500 ft (150 m). In wells drilled specifically for secondary recovery by waterflooding or for use as a saltwater-disposal well, the Kansas Corporation Commission requires surface pipe set in the "red beds"; however, operators commonly set surface pipe deeper into the Stone Corral anhydrite, depth from 850 to 950 ft (255-285 m), shutting off all the Cretaceous and Permian aquifers that now carry corrosive saline waters of mixed origin.
Structural growth of the Gorham anticline
The structural growth of the Gorham anticline is delineated literally from the "granite to the grass roots" by the series of structural maps. These include the Precambrian map (fig. 7), the Arbuckle maps (figs. 9 and 10), the Lansing-Kansas City map (fig. 11), the Stone Corral anhydrite structural map (fig. 13), and the near-surface structural map on a datum of the outcropping Cretaceous Fence-post limestone (fig. 16).
Precambrian rocks provide the basement tectonic framework. Their influence can be read in all shallower maps. Deformation was episodic throughout geologic time and closely adhered to an original template. The prominent northwest-trending fault or fault system, which has a displacement of 400 ft (120 m) on the Precambrian surface (fig. 7), is reflected in shallower beds in diminishing amounts. On the Arbuckle (figs. 9 and 10), faulting accounts for perhaps 100 ft (30 m) of the total relief of 150 ft (45 m) on the buried sub-Pennsylvanian topographic surface. On a datum of the top of the Pennsylvanian Lansing-Kansas City beds (fig. 11), faulting is still evident to the extent of 60 ft (20 m) of the total relief of 120 ft (36 m). Within the Permian, on a datum of the top of the Stone Corral anhydrite (fig. 15), structural relief is 50 ft (15 m) due to differential compaction and/or faulting. The steepest dips, one-half of 1°, occur directly above the position of the fault in the Precambrian rocks. On the Cretaceous Fence-post limestone near the surface (fig. 16), the steepest near-surface dips also occur in a position above the locus of the fault zone in the Precambrian and sub-Pennsylvanian beds. Closure on the near-surface anticline in the Cretaceous rocks is 30 ft (9 m).
This sequence confirms the structural growth of the Gorham anticline by intermittent or episodic fault movement plus differential compaction over millions of years, controlled by a template of basement-rock configuration, movement, and faulting.
Regional mapping by Berendsen and Blair (1986) found similar basement control of the structural history. They mapped a study area measuring 120 by 60 mi (192 x 96 km) extending to the western edge of Ellsworth County just east of Russell County. Their contour maps of multiple horizons revealed that present-day structural configurations have resulted from repeated episodic re-activation of Precambrian trends. They concluded that brittle deformation played an important part in the tectonic development of Kansas, that the structural complexity of each mapped interval increases with depth, and that the structure of the less well known Precambrian basement must be considerably more complex than the Arbuckle or sub-Pennsylvanian surface. In the Gorham oil field, structural mapping of the 100 mi2 (260 km2) study area shows the same pattern of increasing complexity with depth. There, too, the overlying sedimentary rock sequence records basement movements with increasing intensity downward. It is quite likely, based on analogy with regional mapping of Berendsen and Blair, that the Precambrian basement under the Gorham oil field is complexly faulted by high-angle normal and reverse faults as a result of brittle deformation. The relative structural flatness of the Gorham oil field structures, with Pennsylvanian dips of only a fraction of one degree and with Arbuckle dips of 20 or less, makes recognition of small-displacement basement faults difficult to confirm from subsurface structural mapping. It is concluded that the Precambrian basement rocks under the Gorham area are much more faulted than shown in the conservatively mapped fig. 7, p. 11.
Prev Page--Geology--Precambrian, Paleotopography || Next Page--Oil Production
Kansas Geological Survey, Geology
Placed on web Jan. 30, 2015; originally published 1991.
Comments to webadmin@kgs.ku.edu
The URL for this page is http://www.kgs.ku.edu/Publications/Bulletins/228/03_geol2.html