Ground-Water Levels
Note: this section describes historical water levels and long-term water-level changes. For information on water levels and water-level changes in monitoring wells installed by the Upper Arkansas River Corridor project, see the report Multi-Level Observation Well Sites of the Upper Arkansas River Corridor Study, which describes the multi-level well sites and observations, including well construction information, lithologic and geophysical logs, water levels, and water-quality data.
The distribution of and changes in water levels in the High Plains and alluvial aquifers relative to Arkansas River and ditch diversion flows illustrate the hydrologic conditions under which saline river water can infiltrate into the ground water. Just as surface water flows to lower elevation, ground water moves from an area of higher hydraulic head to an area of lower hydraulic head. Regional ground-water flow in the upper Arkansas River basin is generally in a west to east direction that reflects the regional topography sloping downward to the east. Before diversion of Arkansas River water and development of ground-water resources in the river corridor, ground-water tables were, on the average, slightly higher in the alluvial and High Plains aquifers than in the river. Thus, there was a small component of northerly and southerly ground-water flow in addition to the regional flow direction. This resulted in net ground-water discharge from the High Plains and alluvial aquifers to the Arkansas River along nearly all of its length in southwest Kansas.
Substantial historical changes in the hydrologic conditions of the Arkansas River corridor first started with large-scale ditch irrigation in Colorado in the 1870's and then in Kansas during the 1880's. Consumptive losses of water in Colorado reduced the amount of river flow to Kansas. Distribution of the ditch water to portions of the river floodplain and to uplands in Kansas increased recharge to the alluvial and High Plains aquifers underlying the irrigated areas. The recharge increased when combined rainfall and flood irrigation lengthened the periods of water saturation in soils during which infiltration below the root zone could occur. The removal of the long-rooted prairie grasses for cropland could also have decreased the amount of soil moisture removed by the grasses in the deeper soil zone, thereby allowing more soil moisture to reach the water table.
Variations in Arkansas River flow resulted in changes in the amount of water available for ditch irrigation. In turn, the variation in diversions affected the amount of recharge from flood irrigation in the ditch service areas. Much of the early ground-water development in the river corridor included irrigation wells that supplemented water from river diversions, especially when Arkansas River flows were low. As more irrigation wells were installed in the ditch irrigation area, the average amount of recharge to the water table over periods of several years increased where river diversions were not used for irrigation or were not sufficient to supply irrigation needs. However, the greater pumping of ground water also caused declines in water levels.
Some wells were installed for irrigation in southwest Kansas starting from the early 1900's. Most of those wells constructed by 1940 were in the ditch irrigation areas along the river corridor. A substantial increase in the number of large capacity wells began during the 1950's. The installation of many new irrigation wells continued through the 1970's and into the early 1980's. At first, individual wells produced local cones of depression in the water-level surface around each well. The local depression in the water level of the High Plains aquifer caused saline water in the alluvial aquifer or shallow zone of the High Plains aquifer underlying ditch irrigation to move down towards the well screen during pumping. As the pumping continued and more wells were installed, eventually the cones of depression from nearby wells expanded to intersect with one another. The overall result of pumping at a substantially greater rate than recharge produced a regional decline in the water level of the High Plains aquifer. The water-level declines changed the hydraulic gradients, thereby reducing the component of ground-water flow to the river and finally reversing the gradient in many areas. The result was induced infiltration of saline river water to the alluvium and then to the High Plains aquifer along much of the Arkansas River valley.
The effect of the interrelationships among river flow, ditch diversions, recharge, and ground-water withdrawals on aquifer water levels for the Arkansas River corridor can be illustrated by well hydrographs. The column of townships in R. 35 W. extending north and south of the Arkansas River in east-central Kearny County was selected for display of hydrographs representing a cross section of water-level changes in different conditions. The township column crosses the Arkansas River valley, and part of the ditch service area (Figure 1). Wells for which greater than a decade of water-level measurements exist in the township column are located to the north and south of and within the ditch irrigation area. The hydrologic conditions represented by the wells range from the alluvial aquifer within the ditch service area to the High Plains aquifer to the north and south of the Arkansas River, both within and outside the ditch-irrigated area. The columnar rectangle within which the wells lie measures approximately 16 miles in a north-south direction and 4 miles east-west.
Figure 1--Location of wells with extended water-level measurements in R. 35 W. north and south of the Arkansas River in eastern Kearny County.
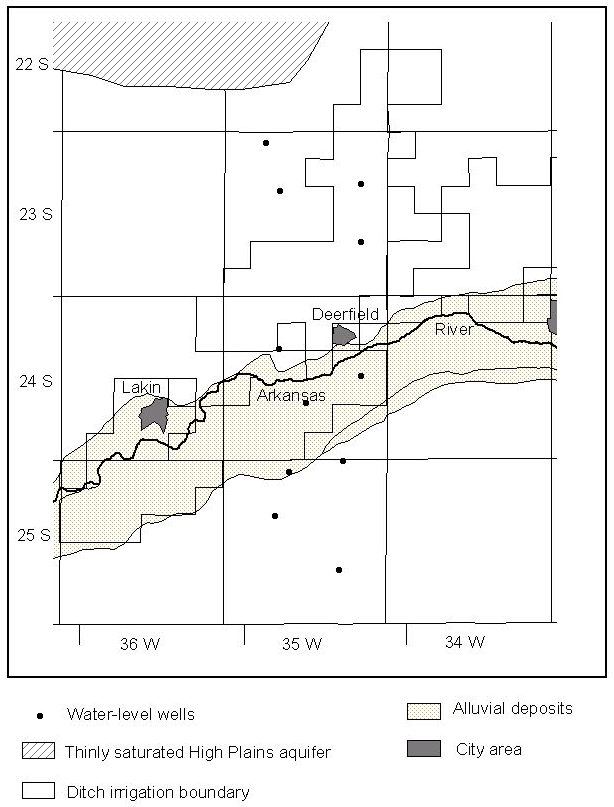
Table 1 lists information for the 5 wells in Figure 1 that lie to the north of the Arkansas River valley. The wells are listed in order of decreasing distance from the Arkansas River, based on measurements from each well location directly south to the river on USGS 1:24,000 (7.5 minute) topographic quadrangles. The water-level data for this table and Table 2 are from records in the KGS WIZARD database available at the web site
http://www.kgs.ku.edu/Magellan/WaterLevels/index.html
All 5 of the wells in Table 1 are screened in the High Plains aquifer. Four of the wells are used for irrigation; the other is an observation well. The first two wells lie to the northwest and outside of the irrigated area served by Arkansas River diversions. The other 3 wells are located within the ditch-irrigation area. The well depths range from 180 ft for the well in the northwest corner of the group, to over 300 ft for the two most eastern wells, to 253 ft for the most southern well. The land-surface elevation decreases from the west to the east and from the north to the south in the area of the 5 wells. There were changes at two of the wells that resulted in small differences in the land surface elevations that serve as a reference for the water-level depths. The water level of the first record in each well pair was adjusted by the difference in surface elevation to make the data consistent with a single surface elevation for each pair. The 1940 water-level depths in Table 1 and Table 2 were taken from a map based on water-level measurements in McLaughlin (1943). The land surface and 1940 water-level elevations above the Arkansas River were computed using the river elevation directly south of each well as estimated from the USGS 1:24,000 topographic quadrangles. Although river surface elevation changes with river stage, the stage variations usually range within only a couple ft for near normal flows.
The hydrographs for the two wells outside the ditch-irrigation area are in Figure 2 and for the 3 wells within the ditch boundaries are in Figure 3. The x-axis for these and other figures in the water-level discussion are all for the same period. The y-axis range for depth to water is the same for Figure 2 through Figure 4 (south of the river). The same axis dimensions allow direct visual comparison of relative changes in the water levels with time. The tick marks for the years represent the start of the labeled year. The record for the most northerly well (23S-35W-05) listed in Table 1 indicates that the water level dropped from the mid-1960's to the mid-1980's and then stabilized at the location. After a pronounced drop at the beginning of measurement, the water level in the other well outside the ditch-irrigation area (23S-35W-16) rose slightly from the mid-1980's to the present.
Figure 2--Hydrographs for wells in R. 35 W. north of the Arkansas River and outside the ditch-irrigation service area.
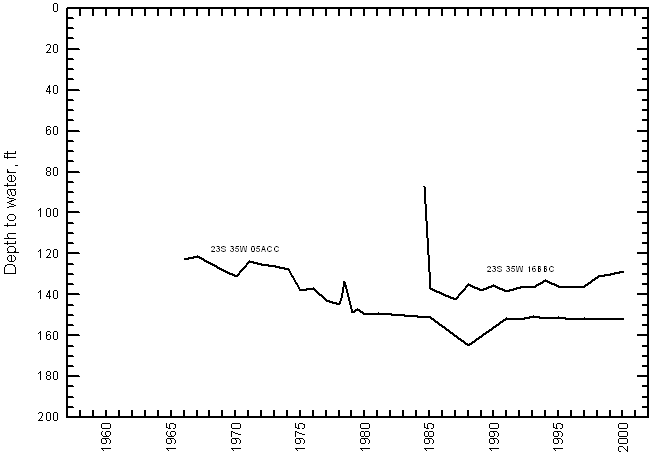
Figure 3--Hydrographs for wells in R. 35 W. north of the Arkansas River and inside the ditch-irrigation service area.
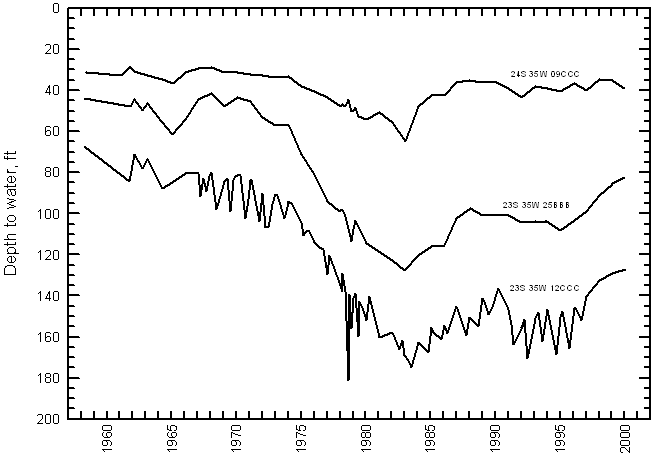
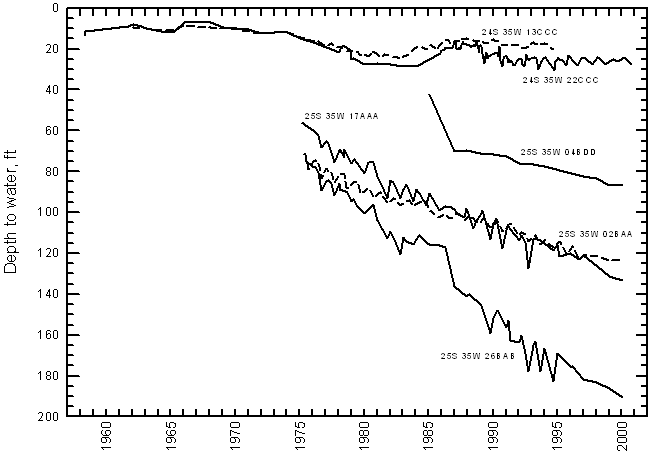
Figure 4--Hydrographs for wells in R. 35 W. south of the Arkansas River.
The third and fourth wells listed in Table 1 are within the boundaries of the Amazon ditch service area. The last well is in the southwest corner of an isolated section of the Great Eastern ditch service area and next to the Amazon service area. The depth to water becomes shallower the closer to the river for these three wells (Figure 3). Water levels fluctuated but showed no pronounced upward or downward trend in the two wells with the shallower water levels (24S-35W-09 and 23S-35W-25) from the late 1950's to about 1970. The water levels then began an increasing rate of decline in these two wells after 1970 until reaching a minimum by early 1983. The hydrograph for the third well (23S-35W-12) in Figure 3 shows a water-level decline starting from the first measurements in the late 1950's that increased in rate until also reaching a minimum in 1983. The hydrograph for this well shows more short-term variation than for the other two wells because measurements were collected more frequently. Thus, there are water-level data for the irrigation season, during which the water levels were lower than in the non-pumping period. After 1983, the water levels rose in all three wells until reaching a plateau or maximum in the late 1980's to 1990. Since the late 1980's, the water level in the shallowest and most southerly well has fluctuated but shown no significant upward or downward trend. After the water levels in wells 24S-35W-25 and 23S-35W-12 reached maxima in 1988 and 1990, respectively, the levels declined during the early 1990's and then rose during the late 1990's.
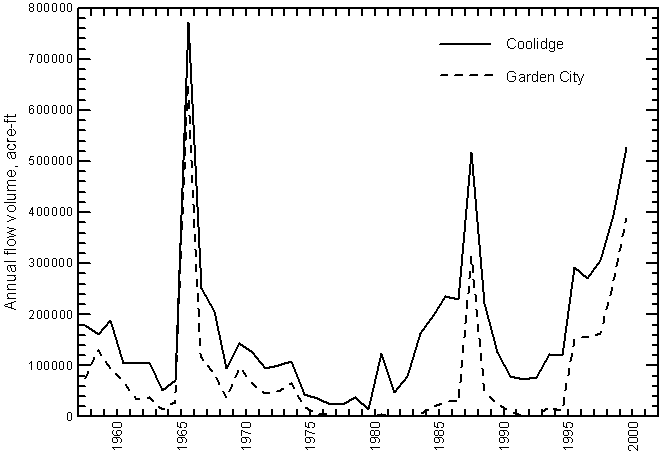
The changes in water levels for the wells in Table 1 can be explained by a combination of ground-water development and recharge from Arkansas River water diverted for irrigation. The pumping of ground water for irrigation caused the declines in the water levels, whereas variations in the amount of ditch irrigation produced changes in recharge and water-level rises. Figure 5 illustrates the variations in the amount of water diverted from the Arkansas River and used for ditch irrigation in the Amazon and Great Eastern service areas. The annual amount of diversion was calculated from the monthly totals and represents the calendar year total. The annual diversion volumes are significantly correlated with the annual flow in the Arkansas River (Figure 6). The x-axes in Figures 5 and 6 are the same as for the hydrograph figures. The points for the annual diversions and river flows are plotted as July 1 for each year in the two figures. The variations in the amounts of water diverted are appreciable and reflect the large fluctuations in flows of the Arkansas River available for diversion during the irrigation season. The large declines in ground-water levels underlying the ditch-irrigated area during 1970 to the early 1980's (Figure 3) correspond to the period of decreasing ditch diversions to the late 1970's and the generally smaller than average diversions in the early 1980's. During this period, the amount of ground water needed to supplement the river-water irrigation was substantial. Therefore, the large ground-water withdrawals produced substantial water-level declines during a period with only a relatively small amount of recharge from diversion canals and surface-water irrigation. The spike in the Great Eastern diversion for 1980 is reflected in a small rise in the water level of the well (24S-35W-09) within this ditch area; the well is located near the main canal.
Figure 5--Annual diversions from the Arkansas River to the Amazon, Great Eastern, and South Side ditch systems.
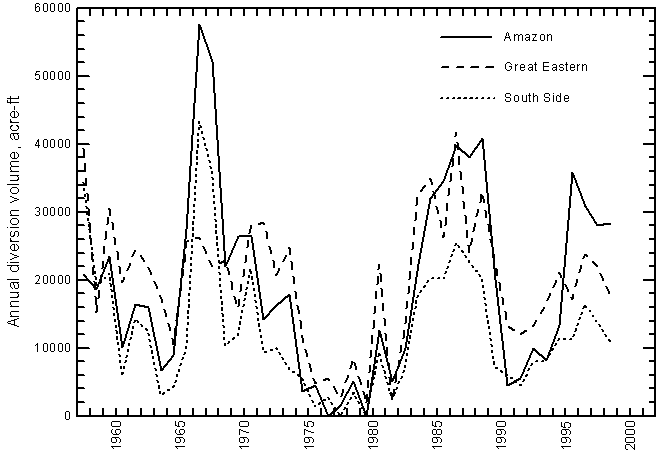
Figure 6--Annual volume of Arkansas River flow near Coolidge and at Garden City.
Starting in 1983, the river diversions increased substantially and remained relatively high until 1989 (Figure 5). The ground-water recharge from the increased ditch irrigation during this period corresponds to a general rise in water levels for the 3 wells within the Amazon and Great Eastern ditch areas. From 1990 to 1994, the diversion volumes dropped to lower than average values, resulting in less recharge and a slight drop in water levels for the two wells in the Amazon ditch area. The drop in the diversion flow was not as great for the Great Eastern as for the Amazon ditch system, which may be part of the reason why the water level for the well in the Great Eastern area did not change much during 1990-1994. Starting in 1995, the diversion volume was high in the Amazon ditch system, and the resulting recharge corresponds to the increase in water levels after 1995-for the two wells in this ditch area. The increase in the water diverted to the Great Eastern ditch area was not as great for the latest period as for the Amazon system. This may explain the relatively constant water level in well 24S-35W-09 in comparison to the rises for the two wells in the Amazon service area. The higher water levels for the wells within the ditch service areas after the mid-1980's than during the early 1980's are probably responsible for the stable or slight rise in the water levels of the two wells outside the ditch-irrigated area after the mid-1980's. The reason is that the rising water levels under the ditch area would have decreased the head gradient towards the east and southeast near the western boundary of the ditch service area.
Table 2 lists information for 6 wells that lie to the south of the Arkansas River valley. The wells are listed in order of increasing distance directly south of the Arkansas River. Four of the wells are used for irrigation. One of the other two wells was constructed to serve an observation well; the other is unused but serves as an observation well. The two wells closest to the Arkansas River are screened in the Quaternary alluvial aquifer and have depths of 50 and 65 ft. The other 4 wells are screened in the High Plains aquifer. The depths of these 4 wells range from 299 ft to 367 ft and increase with distance from the river. The two alluvial wells lie within the irrigation service area of the South Side ditch. The well in 24S-35W-04 is located at the edge of the alluvial aquifer just outside the boundary of the South-Side ditch service area. The other 3 wells lie at increasing distances from both the alluvial aquifer and the ditch-irrigation area and are within the band of sand dunes south of the river valley. The land-surface elevation for the well locations generally increases with distance south from the Arkansas River.
The hydrographs for the 6 wells listed in Table 2 are graphed in Figure 4. The depths to water for the two alluvial wells are the shallowest of the 6 wells. The water-level depths in the two wells were relatively similar and remained within 6 to 14 ft of the surface from the late 1950's to 1974. After 1974, the water levels declined until reaching a low around 1983. From 1984 to 1888, the water levels rose and then began a slow downward trend to 1995. Water-level measurements were discontinued for one alluvial well after 1994. The water level for the other alluvial well fluctuated about a constant depth for 1995-2000. Although the relative magnitude of the water-level changes is smaller for the alluvial wells than for the wells in the ditch-irrigation area to the north of the river, the patterns contain some similar elements. The water levels in the alluvial aquifer are mainly controlled by the river stage but also by the amount of ground-water withdrawals and recharge from river diversions in the South Side ditch area.
The hydrographs for the 4 wells screened in the High Plains aquifer south of the Arkansas River all show substantial continuous declines in ground-water levels (Figure 4). In general, the farther the well is located south of the river, the steeper was the rate of decline. The farther the well is from the river and alluvial aquifer, the smaller is the recharge water volume that flows in the subsurface to the well. The depth to water in the most southern well (25S-35W-26) dropped from 74.3 ft below land surface in June 1975 to a depth of 190.5 ft in January 2000, a fall of 116.2 ft in 24.7 years or a rate of 4.7 ft/yr. The hydrographs display no large variations with time that are correlated with river flow and irrigation diversions as do those for the alluvial wells and wells north of the river in the ditch-irrigation area. However, there are some small changes that may correspond to the high river flows and diversions during the mid-1980's. The slopes of the general water-level declines in the 3 wells outside the alluvial aquifer boundary decreased somewhat starting around 1983. The well with the most pronounced relationship to the mid-1980's flow and diversion increases was that farthest to the south (25S-35W-26). In addition, the large drop in water level at this well in 1986 does not correspond to diversion and river flow patterns. This suggests that the mid-1980's variations for this well could also be related to other factors such as changes in pumping that correspond to rainfall received at the well location.
Comparison of the ground-water levels to Arkansas River elevations illustrates the change in the water-level surface of the ground water in different parts of the river corridor relative to the river. Table 1 and Table 2 list the height of the land surface at the wells above the river and the height of the water level at the well locations above the river in 1940. The 1940 water levels at the well locations north of the river ranged from 13 to 36 ft above the river-water surface. At the well locations south of the river, the water levels in the alluvium were the same as the river surface and in the High Plains aquifer were 2 to 9 ft above the river surface in 1940. This indicates that there would have been a component of ground-water flow from the High Plains aquifer towards the river both north and south of the river in combination with the predominant easterly direction of regional flow. The head gradient towards the river would have been greater on the north side than on the south side of the river in 1940.
Figure 7, Figure 8, and Figure 9 show the hydrographs in Figures 2-4, respectively, relative to the Arkansas River surface. The earliest water levels for all of the wells with records that begin before 1970 were above the river surface. The ground-water levels dropped below the river surface at all of the wells during the early 1980's. Except for the well closest to the north side of the river valley, the water levels in all the wells in the High Plains aquifer have remained below the river surface after 1979. The water level at the well in the Great Eastern ditch area north of the river (24S-35W-02) has remained above the river surface since 1984 (Figure 8). The well is sited close to the Great Eastern canal and near the seepage from Lake McKinney. The water-level data in this area indicate that there is some ground-water flow from the ditch service area towards the alluvial valley. Because the water levels farther to the north are substantially below the levels for this well, there must be a northerly component of flow farther to the north. The January 2000 measurement shows that the ground-water level in the next well to the north (23S-35W-25) is only 10 ft below the river surface as interpreted from the USGS topographic map.
Figure 7--Hydrographs for wells in Figure 2 represented as water levels relative to Arkansas River elevation.
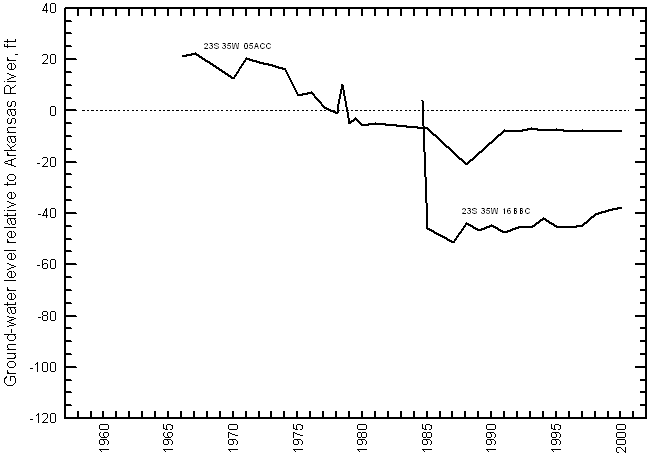
Figure 8--Hydrographs for wells in Figure 3 represented as water levels relative to Arkansas River elevation.
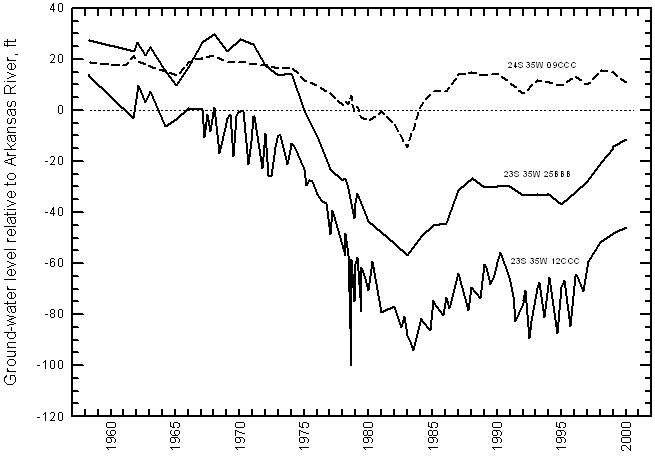
Figure 9--Hydrographs for wells in Figure 4 represented as water levels relative to Arkansas River elevation.
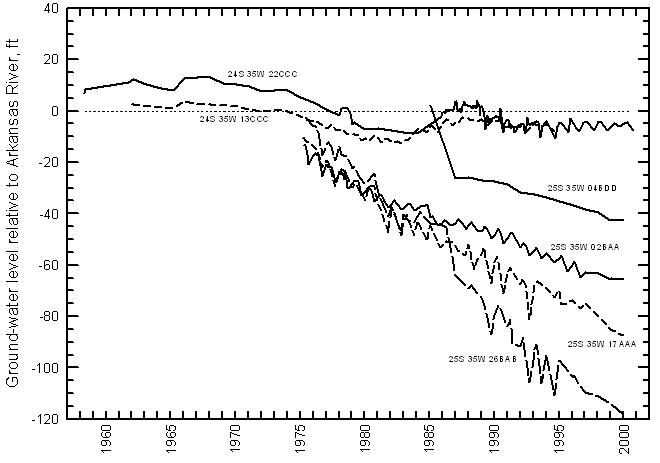
Extrapolation of the steep rate of water-level decline for the wells in the High Plains aquifer south of the river back in time indicates that the water levels were probably somewhat above the river surface before the mid-1960's (Figure 9). This fits with the 1940 data that show water levels above the river surface at these locations. The continual decline of water levels in the High Plains aquifer south of the river has increased the hydraulic head gradient from the river valley to the wells. If the elevations for the January 2000 measurements are subtracted from the river surface elevation (with an 5 ft adjustment for channel deepening, see paragraphs below), and divided by the distance between the well and the river, the head gradients from the river to the wells range from about 11 to 17 ft/mi. The gradient for the well in the High Plains aquifer at the edge of the alluvium (25S-35W-04) is the smallest (approximately 11 ft/mi), whereas the gradient for the 3 wells to the south of the alluvial valley are all in the range 15-17 ft/mi.
The long-term trend in the hydrographs for the two alluvial wells is a declining water level (Figure 9). However, Arkansas River flow was generally smaller during the late 1950's and early 1960's than in the mid-1980's and late 1990's. Therefore, a change in the average annual flow of the river could not account for this drop. Two factors are responsible for the trend. The main factor is the change in the morphology of the Arkansas River channel. Since the start of ditch irrigation in the late 1800's and later regulation of the river flow by reservoirs in Colorado, the river channel has narrowed and become more entrenched (Spray, 1986). This is reflected in the changes at the USGS gaging stations where the datum for the water-stage recorders has been lowered. For example, since October 1986, the stage datum at the Garden City station has been 9 ft lower than for the period 1957-1964 (USGS, 1999). The date of the contours in the USGS topographic maps used to estimate the river surface elevations is 1958-1960.
The topographic maps were photorevised for selected features in 1978 but the river surface shown in the map represents a 1958 interpretation of aerial photographs with a 1960 field check. Although the scour of the river channel could be somewhat greater near the stage recorder at Garden City due to the proximity to the bridge supports, it is clear that the river channel has deepened substantially since 1960. The lower river level results in lower ground-water levels in the alluvium near the river. The other factor explaining part of the long-term downward trend in the alluvial water levels is the water-level decline in the High Plains aquifer underlying and to the south of the river. The vertical hydraulic gradient from the alluvium to the underlying aquifer caused seepage from the alluvium to the underlying High Plains aquifer, thereby slightly lowering the water table in the alluvial aquifer. The magnitude of this effect is expected to be greater the farther the distance from the river.
Since 1990, the higher water levels at the alluvial wells have been about 5 ft below and the lower water levels approximately 8 ft below the river level based on the river surface estimates from the USGS topographic maps (Figure 9). The lower water levels for the well at 24S-35W-22 during the 1990's occurred at the end of the irrigation season and reflect pumping within the alluvial aquifer and in the underlying High Plains aquifer. The difference in elevation between the river surface and the ground-water levels in the alluvial wells 0.9 miles to the south is expected to be less than one ft during the non-irrigation season when the water levels in the alluvial aquifer are higher. Thus, the estimated deepening of the Arkansas River channel is approximately 5 ft in eastern Kearny County since 1960.