Conceptual Model and Simulation of Ground-Water Salinization
The salinity of ground water in the alluvial aquifer of the upper Arkansas River corridor in southwest Kansas has greatly increased since the beginning of irrigation diversions in Colorado and Kansas in the late 1800's. The salinity of the High Plains aquifer along the river corridor has also greatly increased starting with local pumping effects after 1900 and then becoming more regional as ground-water levels declined substantially in the aquifer after 1970. The source of the saline water is flow in the Arkansas River that enters Kansas from Colorado. Ground water in the upper Dakota aquifer underlying the river corridor is fresh and is not a source of salinity. The saline river water will continue to enter the High Plains aquifer in substantial amounts in the future and impact an ever-increasing area of the aquifer.
Before irrigation diversions and large declines in ground-water levels, the Arkansas River gained flow along nearly all of its length in southwest Kansas. The ground-water discharge to the river was fresh and decreased the natural levels of dissolved solids in the river water by dilution. The baseflow increased downstream and thus decreased the dissolved solids progressively downstream. After irrigation started in Colorado in the 1870's, Arkansas River flow entering Kansas decreased in quantity and became more saline. After diversions began in the 1880's in Kansas, the salinity of ground water in the alluvial aquifer would have increased in areas affected by seepage from the canals and recharge from the fields irrigated with the saline river water. The increased salinity of water in the alluvial aquifer would have decreased the dilution capacity of discharge from the alluvium to the river.
The installation and pumping of large-capacity wells in the alluvial aquifer and then the High Plains aquifer after 1900 would have produced local, shallow cones of depression in the aquifers. Cones of depression close to the river would have induced the seepage of some river water into the alluvial aquifer. The cones of depression could have resulted in saline alluvial water moving down into the upper parts of well screens in the High Plains aquifer in areas where there are no thick clays underlying the alluvium. In areas where thick clays are present, the increase in salinity in the High Plains aquifer is expected to have been from flow down the gravel packs of wells with annular spaces not sealed through the alluvial aquifer.
As increased numbers of high-capacity wells were installed in the High Plains aquifer, especially from the 1950's through the mid-1980's, the local cones of depression in the water levels began to coalesce. During the 1970's, the amount of river water available for ditch irrigation was low and the amount of pumping from the High Plains aquifer in the river corridor substantially increased. Ground-water levels declined in most areas of the High Plains aquifer across the corridor. The water-level declines became regional and dropped below the shallow zones of the High Plains aquifer. The vertical head gradients that were generated caused a substantial increase in the movement of saline water from the alluvial aquifer into the underlying High Plains aquifer, and an increase in the movement of shallow saline water in the High Plains aquifer into the deeper aquifer. The movement occurred both as areal migration where there was no substantial thickness of clay layers to appreciably retard the vertical movement, and as gravel-pack flow in the annular space of large-diameter wells that were not sealed through the alluvial aquifer or the upper part of the High Plains aquifer. The regional declines in water levels in the High Plains aquifer also changed the direction of ground-water flow in the river corridor. Saline ground water began not only to move from the river into the alluvial aquifer and down into the underlying High Plains aquifer but also to migrate away from the river and alluvial valley. Numerical simulation of ground-water flow indicates that flow directions in 1940 have shifted from a general regional movement towards the east-southeast to, in the 1990's, the southeast or south in the area south of the river from eastern Kearny County to western Gray County, and to the northeast from the river in portions of western Finney County.
After the 1970's, increasing amounts of river water seeped into the aquifers. The net baseflow additions to the river changed to net flow decreases even after accounting for the diversions for ditch irrigation. Today, the location of average baseflow additions to the river is east of Dodge City. Thus, the salinity of the river water entering Kansas is no longer significantly diluted by baseflow except soon after large flow events when bank storage of less saline water returns to the river. The result is that the salinity of river water passing the Colorado-Kansas border on a given day does not usually change appreciably as it flows downstream to Dodge City. The river seepage is much greater downstream of where the High Plains aquifer underlies the alluvial aquifer (east of the Bear Creek Fault zone) than in the alluvial valley from the Colorado-Kansas border to western Kearny County.
During the 1980's and 1990's, recharge from the ditch service areas, coupled with decreased pumping of ground water when ample supplies of river water were available for irrigation, increased ground-water levels in eastern Kearny and western Finney counties underlying the ditch irrigation areas north of the Arkansas River. However, the large water-level declines in the High Plains aquifer south of the river have produced an even greater hydraulic gradient from the river valley to the south than was generated in the 1970's. The simulation of flow based on 1990's conditions indicates that saline water will move at substantial rates from the river into the alluvium and thence into the High Plains aquifer south of the river. The migration of saline water from the river and alluvial aquifer could reach as far as 3-4 miles south of the alluvial valley after 40 years and pass completely through the sand hills well field of Garden City.
Ground-water flow simulations based on 1990's conditions indicate that most of the fresh ground water in the alluvial trough underlying the sand dunes south of the alluvial valley in Hamilton and western Kearny counties should not be significantly affected by saline river or alluvial aquifer water. This assumes no substantial further development of ground water in the alluvial trough that would lower ground-water levels and induce flow of saline ground water from the alluvial valley into the area of freshwater. The simulations also show that the area of the High Plains aquifer affected by the leakage of saline water from the overlying alluvial aquifer from central Gray County to east of Dodge City should remain under the alluvial valley during the next 40 years. This conclusion also assumes that water-level changes will not be substantially different from the 1990's in the High Plains aquifer along this section of the river corridor. If pumping in the High Plains aquifer north and south of this part of the alluvial valley causes water-level declines than are appreciably greater than in the 1990's, then some saline water could start to move outward from the edge of the river valley.
The observed salinity distribution in the High Plains aquifer in the river corridor indicates that local pumping effects are enough to cause a substantial increase in the travel distance of saline ground water. Thus, the simulation results in this report should only be used to show the patterns of saline water migration in terms of general direction and distance and not for detailed predictions on a smaller scale.
A predominant result of the evaluation of water-level declines in the High Plains aquifer and the numerical simulations of ground-water flow based on 1990's conditions is the contrast in conditions north and south of the Arkansas River in eastern Kearny and western Finney counties. North of the river, the recharge from the ditch service area produces conditions in which the water levels and the ground-water flow directions do not change substantially with time. South of the river, the high-rate of ground-water declines has shifted ground-water flow directions to the south and increased flow rates in that direction. Continued declines at the current rate will result in complete consumption of the saturated thickness more than several miles south of the river. The numerical simulations suggest that recharge from the river and the alluvial aquifer could maintain a west-east band of sustainable saturated thickness that would be several miles wide from the river to the south. The thickness would rapidly decrease in a southward direction. The recharge from the river channel and the ditch irrigation system to the underlying alluvial and High Plains aquifers exceeded 100,000 acre-ft during the late 1990's when the river flows were greater than average. Although the river water recharging the aquifers is saline, it is a valuable resource if viewed in terms of quantity.
A scenario of altered water use was simulated to show the effects of a no-pumping zone in the High Plains aquifer south of the alluvial valley. Stopping all pumping along a 3-mile band just south of the alluvial valley from eastern Kearny County through western Finney County decreased the southerly component of ground-water flow direction and shortened the flow paths during the 40-year simulation. However, the ground water still migrated at substantial rates towards the freshwater in the aquifer and past the Garden City well field in the sand hills. The implications are that it would take a very large amount of added recharge along the river valley margin to protect the well field. The economic impact of no pumping and the difficulty of obtaining enough fresh ground water to provide recharge along the corridor suggest that treatment of saline ground water would be more feasible and economically possible. The scenario should not be interpreted as a recommendation by this study to conduct the action. Planning and management activities should be conducted by the appropriate local and state agencies and associations.
Forecast of Salinization Based on Salinity Budgets
The total amount of sulfate mass accumulating in the Arkansas River corridor in southwest Kansas is the difference in the mass entering and leaving the system. The inputs include sulfate (or the sulfur equivalent to sulfate) in river water flowing across the state line, subsurface ground-water flow into the area, rainfall falling on the soil, gases extracted by plants from the atmosphere, fertilizer and other agrochemicals applied to the soil, animals and associated feed and chemicals (and associated animal waste) imported into the area, and transported miscellaneous chemicals related to human commercial, industrial, and residential activities. Outputs include the sulfate (or sulfur equivalent) in river water and subsurface ground water flowing out of the area, gases returned to the atmosphere by plants, and agricultural, commercial, and industrial products shipped out of the area (Whittemore et al., 2000).
The largest mass of sulfate that enters and leaves the system is in the river surface water. Ground-water flow into and out of the corridor area in the alluvial aquifer approximately balances and is not a significant factor. The concentration of sulfate in rainwater is very low (on the order of one to a few mg/L) and the input mass is less than a percent of the mass difference in the river input and output. Atmospheric absorption and release by plants is also small and the input and output approximately balances. The high concentration of sulfate in the canal irrigation water and the ground water affected by the river water infiltration provide much more sulfur than needed by crops, therefore sulfur-containing fertilizer is not needed. The sulfur mass in chemicals brought in for animal production probably approximately balances the sulfur mass removed when the animal products are shipped; the mass difference is not expected to be significant relative to the river fluxes. Likewise, the sulfur in materials related to other human activities that could affect water quality is expected to be insignificant relative to river water. In addition, inputs and outputs would counterbalance each other.
Other than water, the largest mass of material entering and exiting the corridor area and that could enter the sulfate budget is probably agricultural crops. Grain grown in fields irrigated by river water would incorporate some sulfur from the water. Although some of the grain is used as animal feed within the river corridor, grain is also shipped out of the area. Plants draw up water through a semipermeable membrane in the plant roots and exclude most of the salt dissolved in the soil water. However, some of the salt does enter the plant, including sulfur, which is a nutrient. The average sulfur content of the grain from an irrigated acre of crops ranges from 7 lbs/acre (8 kg/ha) for wheat to 30 lbs/acre (34 kg/ha) for alfalfa (Lamond, 1997). The values for soybeans, corn, and sorghum fall within this range. The average for the 5 crops is 17 lbs/acre (19 kg/ha). The equivalent amount of sulfate dissolved in an acre-foot of water would give a concentration of 19 mg/L. This concentration is about 1% of the average sulfate content of Arkansas River water entering Kansas during the last decade. In general, the higher the soil moisture salinity, the higher can be the amount of many elements drawn into the plant in the water. Even if the sulfur content of the plants irrigated with saline river water were two or three times the average, and all of the crops were removed from the corridor, the total mass would only be a few percent of that accumulating from river water losses.
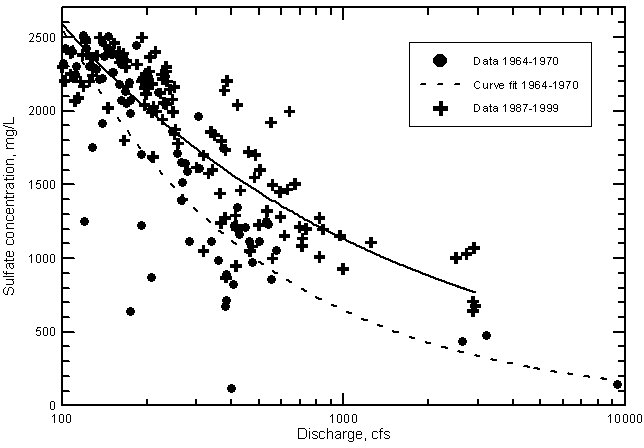
Therefore, mass budgets for sulfate in the river water provide a good estimate of the sulfate mass accumulating in the river corridor in southwest Kansas. We computed the budgets for two areas: the state-line to the Garden City gaging station and from the Garden City to the Dodge City gaging station. We summed the net input for three periods: pre-1950, 1950-1975, and 1975-1997. The pre-1950 period approximately represents the first half of flow losses in the system since the start of river water irrigation. The 1950-1975 interval is for the transition period of increasing ground-water use and spans the data record for the 1964-1970 sulfate-discharge curve (Figure 23 in Whittemore, 2000). The 1975-1997 interval spans the data period for the second sulfate-discharge curve; the start of the interval is the beginning of little or no flows for several years at Dodge City and the transition to net annual flow losses within the Garden City to Dodge City corridor. We calculated the net loss for the Garden City to Dodge City area only for this 1975-1997 interval.
Figure 23--Sulfate concentration for discharge exceeding 100 CFS in the Arkansas River near Coolidge, Kansas. The two curves are best fit lines based on lease squares computation.
Although irrigation diversions from the Arkansas River started in the early 1880's in southwest Kansas, the systems did not become extensive until about 1910 when the sugar beet industry grew substantially. Since the mid-1900's, sugar beets have not been a crop irrigated by river water in the area but have been replaced principally by grain and forage crops. The large growth of phreatophytes along the river began after the turn of the century. We used a period of 50 years at the average conditions for the flow records of 1923-1949 available for both Syracuse and Garden City for the pre-1950 losses. Forty years at the average 1923-1949 conditions should represent reasonably well the period 1910-1949 based on the 1910 start of larger diversions. The additional 10 years at the average 1923-1949 conditions should be a conservative approximation of the total losses from the early 1880's to 1910. Total annual flow at the Syracuse gage is a good approximation of the annual discharge near the state line. Losses for the other two periods are based on the Coolidge (except for 1950) and actual and estimated Garden City flow records.
Estimates of average sulfate concentrations in the river water are necessary to compute the mass accumulation. We computed the average discharge for each of the periods for the river segments. We estimated the sulfate concentrations for the 1950-1974 and 1975-1997 periods from the two curves in Figure 23 in Whittemore et al. (2000). The estimate for the pre-1950's period is an approximation for somewhat less saline waters based on the observation that the salinity in the river water has been increasing. Use of the 1964-1970 curve in Figure 23 for the pre-1950's estimate would give a greater sulfate mass. The average flows decrease and the sulfate concentrations increase for each of the successive three periods.
An estimate of the average sulfate concentration in the ground water in the corridor is given by division of the total sulfate mass accumulated by the estimated volume of aquifer water into which the sulfate mass has migrated. The total area assumed for infiltration of the river water includes a zone along the river, the area irrigated by river water, and a mixing zone in the direction of ground-water flow. We estimated the zone along the river to be a 2 mile- (3.2 km) wide band representing migration up to one mile (1.6 km) on either side of the channel. The irrigated area includes all square mile sections (a section is a surveyed unit of the former U. S. General Land Office) within the irrigation company boundaries, even though not all of the area has been consistently irrigated, all sections with 20 acres (8 ha) or more irrigation outside the company boundaries as indicated in a 1942 survey, and all non-irrigated sections surrounded by these irrigated areas. We estimated that the mixing zone extends 3 miles (4.8 km) to the east of all sections that were indicated as irrigated by diversions in the 1942 survey. The 3-mile (4.8-km) distance approximately fits the observed distribution of sulfate in the aquifer outside the irrigation company boundaries. Some of the described areas overlap, such as where the irrigation company boundaries include the zone along the river.
There are two types of aquifer areas included in the state line to Garden City segment of the Arkansas River corridor. An alluvial trench in bedrock exists from the state line to southwest Kearny County. The two-mile (3.2-km) band along the river sums to 80 mi2 (207 km2) in this segment. The estimated average saturated thickness of the alluvial aquifer for this zone is 40 ft (12 m). The Ogallala portion of the High Plains aquifer is present to the east of this alluvial aquifer band and the combined saturated thickness of the alluvial and Ogallala portions of the aquifer exceed 300 ft (90 m) in some locations. The saturated thickness is less today than before development of extensive ground-water withdrawals for irrigation. The total surface area between the Coolidge and Garden City discharge gages, into which river water from the channel and diversion systems could have seeped and migrated in the subsurface, is 270 sections or mi2 (699 km2). The estimated average thickness of the currently saturated portion of the High Plains aquifer in this area is 250 ft (76 m).
The Garden City to Dodge City segment of the corridor does not include any extensive diversion systems; only one small ditch in the flood plain is active when river flows are sufficient. A two-mile (3.2-km) wide band along the river sums to about 100 mi2 (260 km2) for this segment. The average saturated thickness based on recent water level measurements for the High Plains aquifer is approximately 170 ft (52 m).
The quantity of water in the aquifer volume that can be affected by the saline recharge within the time frame of decades is primarily dependent on the average porosity of all the sediments but the thickest clay units. Although the initial quantity of aquifer water impacted by saline recharge is dependent mainly on the specific yield, dispersion of salinity into fine-grained sediments would occur over a longer time. Some of the water within the interior of the least permeable, thick clays could take multiple decades to reach the salinity in the more permeable sediments because the limiting transport mechanism would be diffusion.
The porosity of aquifer sediments is greater than the specific yield. The specific yield range used by the USGS in past models for the upper Arkansas River valley was 0.14-0.20 (Barker et al., 1981; Dunlap et al., 1985). This range is somewhat smaller than average for sediment textures such as listed in Fetter (1994) implying that there are many zones of fine-grained deposits and also that some of the coarser-grained sediments could be poorly sorted. Based on the above and porosity ranges for sediments in Fetter (1994), we used an average porosity of 0.3 for the High Plains aquifer to calculate the water volume.
The mass/volume calculations indicate that, if all the sulfate mass added had time to mechanically disperse uniformly into the sediments, the average sulfate concentration added to the aquifers in the state line to Garden City portion of the corridor would be 920 mg/L. A calculation made for the major areas irrigated by river water in Kansas alone, based on a similar procedure as for the state line to Garden City segment of the corridor and using the amounts of water diverted, gives a similar average concentration for the aquifer underlying the irrigation systems and a ground-water mixing zone to the east of the irrigation area. These values should be added to the estimated sulfate content of the aquifer existing before the effect of Colorado irrigation systems on the river water quality. The two-mile (3.2 km) wide band of the alluvial aquifer along the Arkansas River from the state line to southwest Kearny County might have contained sulfate concentrations of up to several hundred mg/L in some locations during particularly dry years before the start of river diversions in Colorado. South of the Arkansas River, sulfate concentrations in the uncontaminated part of the High Plains aquifer are less than 50 mg/L. North of the Arkansas River, the aquifer just outside of the river-irrigated area contains water with a sulfate content generally within the range 50-200 mg/L; this range is expected to be the natural background before the impact of anthropogenically induced salinity.
The measured sulfate concentrations in well-water samples range widely depending on location and depth in the aquifer system. However, if the values were averaged, the concentration would generally fit the sum of the estimated naturally occurring and anthropogenically added contents based on the calculation above. Sulfate contents for most of the alluvial aquifer waters along the Arkansas River exceed 2,000 mg/L in Hamilton County and 1,500 mg/L in Kearny County. There are large areas in Kearny and Finney counties where the sulfate concentration of ground water in the High Plains aquifer exceeds 1,000 mg/L. Some of the wells yield waters with greater than 1,500 mg/L. Map plates in Whittemore and Schloss (2000) show the distribution of sulfate concentration in the alluvial and High Plains aquifers of the Arkansas River corridor
The calculated average concentration of sulfate in the entire aquifer underlying the river zone from Garden City to Dodge City is an appreciably smaller concentration. Water-level declines have not been as great along this stretch of the river and the river has been dry many of the years since the late 1970's. These factors, along with the presence of a less permeable zone underlying the highly permeable alluvium that slows downward migration to the main High Plains aquifer, have resulted in restricting the high sulfate concentrations primarily to the alluvial aquifer. For example, just to the west of Dodge City, multi-level observation wells 0.25 mile (0.64 km) south of the Arkansas River show a measured sulfate concentration of over 1,500 mg/L in the alluvial aquifer and about 50 mg/L from the top to the bottom of the underlying High Plains aquifer. A recalculation of the sulfate concentration for the Garden City to Dodge City segment, that would be appropriate for the alluvial aquifer, gives an average sulfate concentration of 960 mg/L added to the system if the aquifer thickness affected is only 60 ft (18 m).
The saline water flowing in the Arkansas River from Colorado and accumulating in southwest Kansas has contaminated some of the ground waters supplying cities and towns along the river corridor. Some municipalities have drilled new wells farther from the river to obtain fresher ground water. The salinity of other water supplies is increasing as the accumulated sulfate migrates downward and in the direction of ground-water flow in the aquifer. Based on conditions during the last decade and the existing accumulation of salinity, in about 50 years river water seepage has the potential to contaminate all of the High Plains aquifer underlying 500 mi2 (1,300 km2) of the corridor to a sulfate concentration over 1,000 mg/L. This concentration is four times the recommended level for drinking waters and twice the level proposed by the U.S. EPA as a maximum concentration for public water supplies.
The increase in sulfate concentration from river channel seepage is mainly dependent on the river water quality. In general, the higher the river discharge entering Kansas, the lower the salinity. The annual mean flow for the longest gaging record that reasonably represents state-line flows (Syracuse station, 1903-1906 and 1920-1998) is 295 cfs (8.4 m3/sec). The annual mean for the station near the state line (Coolidge) is for the period 1951-1998 and is smaller, 215 cfs (6.1 m3/sec). The estimated average concentrations of sulfate (based on Figure 23 in Whittemore, 2000) for the two mean flows at Syracuse and Coolidge are 1750 mg/L and 1930 mg/L, respectively, a difference of nearly 200 mg/L. Therefore, natural climatic variations and the use of water in Colorado are very important to the quality of water received by Kansas.
In addition, there is a limited rate at which the water in the alluvial aquifer can migrate through the lower permeability zone, often present below the alluvium, to the underlying High Plains aquifer. Higher river discharge results in channel flow that extends throughout Kansas and carries substantial sulfate loads downstream out of the state. Extended low-flow periods can result in a dry riverbed and the accumulation of all the salinity mass within southwest Kansas. Management of water storage and releases in Colorado are therefore also important to the amount of aquifer contamination in Kansas aquifers.
The river water that recharges the aquifer, even if saline, is a valuable resource. The recharge of the High Plains aquifer by river water seeping from the river channel and infiltrating below the ditch-irrigated areas is on a scale similar to other recharge projects in the United States costing many millions of dollars. As water treatment technologies become more cost efficient, desalinization of a local supply might become competitive with distant transport of freshwater if water levels continue to decline at substantial rates in the High Plains aquifer. However, management and protection of the existing fresh ground waters in the corridor will probably be more economical for municipal, agricultural, and industrial uses.
References
Barker R.A., Dunlap, L.E., and Sauer, C.G., 1981, Analysis and computer simulation of stream-aquifer hydrology, Arkansas River valley, southwestern Kansas: U.S. Geological Survey Water-Supply Paper 2200, 29 p. [available online]
Dunlap L.E., Lindgren, R.J., and Sauer, C.G., 1985, Geohydrology and model analysis of stream-aquifer system along the Arkansas River in Kearny and Finney counties, southwestern Kansas: U.S. Geological Survey, Water-Supply Paper 2253, 52 p. [available online]
Fetter, C.W., 1994, Applied Hydrogeology: Macmillan, New York, 691 p.
Lamond, R.E., 1997, Sulphur in Kansas, plant, soil, and fertilizer conditions: Kansas State University Agricultural Experiment Station and Cooperative Extension Service, Rep. MF-2264, Lawrence, KS, 4 p.
Whittemore, D.O., 2000, Water quality of the Arkansas River in southwest Kansas: Kansas Geological Survey Open-File Report 2000-44, 85 p., for Kansas Water Office. [available online]
Whittemore, D.O., and Schloss, J., 2000, Sulfate concentration in the alluvial and High Plains aquifers, upper Arkansas River corridor, southwest Kansas: Kansas Geological Survey Open-File Report 2000-72, 2 map plates.
Whittemore, D.O., Tsou, M.-S., and McElwee, C., 2000, Arkansas River salinity and contamination of the High Plains aquifer: Proceedings 2000 USCID International Conference, Challenges Facing Irrigation and Drainage in the New Millenium, Vol. 1, p. 225-246, U.S. Committee on Irrigation and Drainage, Denver, CO.