Kansas Geological Survey, Open-file Report 2000-42
Part of the Upper Arkansas River Corridor Study
KGS Open File Report 2000-42
A Report to the Kansas Water Office, Contract No. 00-113
A Kansas Water Plan Project
Problem
Study Objectives
Purpose of Report
Selection of the Well Sites
Well Installation, Monitoring, and Sample Analysis Procedures
Implications of the Results to Salinity Migration
Appendix A: Well Construction Information Forms
Appendix B: Geophysical Logs: Gamma and Conductivity
The contract for the Upper Arkansas River Corridor Study is funded by the State Water Plan Fund of the Kansas Water Office. Joe Anderson, Exploration Services Section, drilled the wells installed by the Kansas Geological Survey. Lawrence Hathaway and Truman Waugh in the analytical services group of the Geohydrology Section analyzed the water samples collected from the wells. Jeff Lanterman of the Division of Water Resources, Kansas Department of Agriculture, assisted in some of the logistics of site preparation before drilling. Jeff Lanterman and Eric Hargett, also in the DWR, measured some of the water levels in the wells. Mark Schoneweis of the KGS drafted some of the map and well schematics figures. The reviews of Susan Stover of the Kansas Water Office and Eric Hargett are appreciated and were used to edit the report.
The Upper Arkansas River Corridor Study, supported by the State Water Plan Fund of the Kansas Water Office, was established to document the fate and effects of contaminated Arkansas River flows on the ground water in the river valley, and to clearly determine the links among flows in river, increased levels of water contamination in the aquifers, and lowered ground-water tables. Saline water from the Arkansas River has been infiltrating into the High Plains aquifer underlying the river valley and areas irrigated by diverted river water. The study determined that there was little information on the depth distribution of the salinity in the aquifer. The study selected three sites along the river corridor for installation of multi-level observation wells sampled and analyzed ground waters, measured water levels, and conducted aquifer tests in the wells. The information from the sites has greatly increased understanding of the subsurface fate of the saline water along the river valley.
The first well site is located within Deerfield, east-central Kearny County, about one mile north of the Arkansas River. The second site is in Garden City, Finney County, approximately 1/4 mile south of the Arkansas River. The third site is about 3 miles west of Dodge City, Ford County, about 1/4 mile south of the Arkansas River. The shallow aquifer at all sites contains water with a sulfate concentration between 1,500 and 1,700 mg/L, which represents a mixture of Arkansas River water with ground water. Each site has a markedly different salinity distribution with depth below the shallow aquifer, from a gradual decrease to freshwater at Deerfield to penetration of salinity throughout the aquifer at Garden City to a sharp decrease to freshwater at Dodge City.
Substantial amounts of clays in the subsurface appreciably retard the downward movement of salinity at the Deerfield site. The source of the saline river water affecting the aquifer at Deerfield is not directly from the river channel, but from the river water diverted to the west and north of the site. The downward hydraulic gradient at the site continues to provide a drive for downward migration of salinity. Thus, the deepest portion of the aquifer, which still contains freshwater, can be expected to slowly increase in salinity in the future.
The High Plains aquifer at the Garden City site contains sediments that are generally more permeable than those at the Deerfield site. U.S. Geological Survey test-hole data for a location very near the site showed that only the shallow alluvial aquifer contained slightly saline water in 1961; the main aquifer yielded very fresh water with a sulfate content of 24-52 mg/L. Today, the water in the alluvial aquifer is much more saline than in 1961 and the shallow salinity has penetrated to the bottom of the aquifer. The proximity of the Garden City site to the river water source, the downward head gradient, and the permeable sediments in the stratigraphic section allowed the saline river water to penetrate into the aquifer at a faster rate than at Deerfield.
Although the location of the Dodge City site relative to the Arkansas River is similar to that of the Garden City site, there is a sharp gradient from saline water in the alluvium to freshwater throughout the underlying main portion of the High Plains aquifer. The coarse nature of the alluvium, the abundance of low permeability sediments underlying the alluvium, the small downward head gradient in the underlying aquifer, and the discontinuous presence of water in the river channel are major factors explaining why the saline water has not appreciably penetrated below the alluvial aquifer. Substantial declines in the water levels of the main aquifer might possibly lead to migration of salinity below the alluvial aquifer. Management of ground-water withdrawals in the valley, especially during periods of high flows in the Arkansas River, will be important for protecting water quality in the main aquifer.
The Arkansas River in southeastern Colorado and westernmost Kansas is one of the most saline rivers in the United States. Most of the river flow entering Kansas from Colorado is lost in the river stretch from the state line to Dodge City. The loss is due to infiltration from the river channel and consumptive use and seepage of water diverted from the river for irrigation. Saline water can infiltrate from the river and penetrate deeper in the aquifer below fields irrigated with diverted river water because water levels have declined in the High Plains aquifer from consumptive pumping of ground water. The major water-producing portion of the High Plains aquifer is also known as the Ogallala aquifer. The alluvial aquifer of the Arkansas River valley overlies the Ogallala aquifer along most of the river course in southwest Kansas. The amount of saline water entering the subsurface below the river and irrigated fields is large enough and the dissolved solids concentration high enough that it could contaminate all of the ground water in over a 500 square mile area of the river corridor to a sulfate concentration of over 1,000 mg/L within 50 years, if the saline river water could completely mix with the subsurface water. The ground waters that have been and could become contaminated include municipal supplies for Syracuse, Lakin, Garden City, Cimarron, and Dodge City.
The areal and vertical distribution and temporal variation of the saline waters, and the future movement of these contaminated waters have not been well known in the Arkansas River corridor. Factors such as the distribution of lower permeability silt and clay layers in the High Plains aquifer and the slow subsurface flow retard the movement of the saline water. Flows down the gravel packs of unsealed irrigation wells, either during periods between use or after abandonment, can contribute to the amount of saline water reaching the deep aquifer. An assessment of the extent of the ground water contamination and the mechanisms controlling the salinity transport is critical for developing plans for minimizing or mitigating water-quality problems in the aquifers.
The Upper Arkansas River Corridor Study is a Kansas Water Plan project that is providing data and research for the Upper Arkansas Basin section and 2010 Water Quality Objectives in the Water Plan. The basic objectives comprise major parts of the objectives listed under the water-quality and ground-water decline issues in the subsection on the Arkansas River Corridor Subbasin in the Upper Arkansas Basin section of the Kansas Water Plan:
The main work components of the objectives include:
In order to determine the distribution and migration of salinity in the High Plains and alluvial aquifers, we examined existing ground-water information. This information included lithology, water-levels, aquifer tests, water quality, hydrologic models, and other relevant data. Information on the depth distribution of water levels, water quality, and hydrologic properties of the aquifers was particularly limited. Therefore, we selected three locations for the installation of multi-level observation wells along the corridor. Water samples and field measurements and tests at the sites provided data that greatly increased the understanding of the fate of saline Arkansas River water in the valley. This report describes the multi-level well sites, including well construction information, water levels, and water-quality data. Another report, "Performance and Analysis of June 1998 and October 1998 Slug Tests in Kearny, Finney, and Ford Counties" by Butler and Healey (1999) presents the results of hydraulic tests performed on the wells.
We selected the location of all the sites to be within the area in which ground waters of the High Plains aquifer have been impacted by infiltration of saline Arkansas River water. We determined the impact area from water-quality data that existed or that that the study obtained in the river corridor. Each of the sites represents different conditions along the river corridor. The sites are located in Deerfield in eastern Kearny County, in Garden City in Finney County, and just to the west of Dodge City in Ford County (Figure 1).
Figure 1--Location of the multilevel well sites in the Arkansas River corridor. The shaded area along the river represents Quaternary alluvium.
The first well site selected (within the City of Deerfield) represents an area where seepage of ditch irrigation water diverted from the Arkansas River, as well as water in the river valley, were thought to be potential sources of ground-water contamination. In addition, the location is near public water supply wells that yield water showing a substantial salinity increase since the late 1970's. The legal location of the site is 24S-35W-11CBB (NW of NW of SW Sec. 11, T. 24 S., R. 35 W.).
We selected the second site (in Garden City) to be as close as possible to the only location where prior data existed for water quality at more than two depths within the river valley. The site represents an area next to Garden City where seepage of Arkansas River water from the river channel is the source of ground-water contamination. In 1961, the U.S. Geological Survey drilled two test holes near Highway 83 about 1/4 mile south of the Arkansas River. The USGS collected water samples from two depths in one hole and from three depths in the other hole for a total of 5 observations, all at different depths. The previous data provided an excellent opportunity for examining the change in salinity of the ground water with time at the depths for which the USGS obtained data. The legal location of the site is 24S-32W-19CABA (NE of NW of NE of SW Sec. 19, T. 24 S., R. 32 W.).
The third site (Dodge City) represents a more eastern location within the upper Arkansas River valley. River flows at the location have been sporadic over the last few decades in the Dodge City area. Water in the river valley is currently used for the public supply of Dodge City as well as for other purposes. The site provided a location where the effect of substantial river flows over the last several years, in comparison with previous dry periods, could be examined on the water quality of the High Plains aquifer underlying the river valley. The legal location of the site is 26S-25W-32BBBB (NW corner Sec. 32, T. 26 S., R. 25 W.).
The Kansas Geological Survey (KGS) drilled the four shallowest wells at the Deerfield site and the three shallowest wells at the Garden City site. Clarke Well & Equipment, Inc. drilled the deepest well at the Deerfield site, the two deepest wells at the Garden City site, and all four wells at the Dodge City site. KGS and Clarke Well staff logged the cuttings obtained during the drilling of the holes. The KGS followed the drilling of all wells installed by Clarke Well. The deepest hole at each site went to bedrock and we selected the screened interval depth to be in permeable sediments as close to the bottom of the hole as practical. We selected the screened intervals for the other wells based on the cuttings and geophysical logs of the first deepest well, and, for the Garden City site, the depths of the former test holes drilled by the USGS. All the wells and screens are composed of PVC. The two shallowest wells at the Deerfield and Garden City sites are 4 inch in diameter, whereas the deeper wells are 2.5 inch diameter. All of the wells at the Dodge City site are 2.5 inch diameter. The annular space is sealed with cement or bentonite from several feet above the screened intervals up to the surface. The boreholes are generally a few feet deeper than the planned depth of the screened interval bottom. In some cases, blank casing sumps of a couple feet in length are at the end of the screen. Construction and lithologic log information for the wells is in Appendix A. Well depths measured with a tape soon after well completion and later before slug tests differ from those on the construction information forms for a few wells by up to a few feet. We used the depths measured from the top of the casing minus the sump length and minus two feet for the casing length above the land surface for the graphs in this report.
The wells are numbered from 1 to 4 or 5 from deepest to shallowest at each site. The Deerfield and Dodge City wells are in a line from deepest to shallowest, with about 15 ft between each well. The Garden City wells are in a rough circle, each also separated by approximately 15 ft. Concrete pads protect the base of the well at the surface. The Deerfield site wells are locked and protected from vehicles by steel cables strung along posts anchored in concrete. The Garden City and Dodge City sites include steel protectors with locks over each well. The Dodge City site also has protection posts along the edge of the field road.
The KGS or Clarke Well & Equipment developed the wells soon after installation. We further developed all the wells before sampling and aquifer tests. The KGS and Clarke Well & Equipment logged the cuttings from the wells. We ran geophysical logs (gamma and inductive conductivity) for the wells soon after installation and again several months later. The logs for the deepest wells are in Appendix B. The natural gamma log responds primarily to fine-grained sediments such as clays that generally contain more radioactivity than coarser-grained deposits. The gamma logs contained some high readings that did not correlate well with the conductivity logs. Some of these units appear to occur in some of the coarser sediments and may represent high radioactivity associated with feldspars in the deposits. The focussed electromagnetic induction log measures formation conductivity, including the conductivity of the formation fluid. Therefore, the conductivity is influenced by clay content, salinity, and moisture content. The metallic parts of centralizers used above the screened interval appear as small spikes, and the small screws used to anchor the glued casing joints result in tiny spikes at approximately 20 ft intervals on the conductivity logs.
The Division of Water Resources (DWR) in the Kansas Department of Agriculture and the KGS periodically measured water levels in the wells. The KGS determined aquifer parameters such as hydraulic conductivity for screened intervals using proven methods of slug-test analysis (Butler and Healey, 1999).
We sampled the wells at the end of or soon after development and then at a later time to examine changes in the water quality. Water extraction from the well was by air lifting or submersible pumping at the end of development and later by submersible pumping. We removed more than several casing volumes and monitored the specific conductance and water temperature to make sure the readings were stable before sample collection. We collected the samples in polyethylene bottles and perserved them in an ice chest for transport to the KGS laboratories. During the sampling of the wells by pumping a year or more after installation, we filtered the water through a 0.45 µm membrane filter before collection. We collected the field filtered sample for nitrate determination in a separate bottle and preserved with hydrochloric acid.
The KGS analytical laboratories in Lawrence, Kansas determined chemical properties and the concentrations of major and minor dissolved constituents in the water samples. The laboratories maintain quality assurance/quality control procedures that include calculation of charge balance errors and analysis of USGS standard reference waters. The estimated maximum errors in the constituent concentrations given in this report are typically a few percent or less. The KGS analyzed the last set of samples for all wells for ammonium ion; the concentration in all samples was <0.05 mg/L as NH4-N.
The observation well site at Deerfield is located in the southwest part of the city to the west of the athletic fields of the public school land (Figure 2). It is approximately one mile north of the Arkansas River. There are five wells screened at different depths in the alluvial and main portions of the High Plains aquifer (Table 1 and Figure 3). The Kansas Geological Survey (KGS) installed the four shallowest wells in June 1997. Clarke Well & Equipment installed the deepest well in February 1998.
Figure 2--Map location of the observation well site west of Deerfield, east-central Kearny County.
Figure 3--Schematic representation of the observation wells at the Deerfield site. Substantial clay layers are shown that represent less permeable zones.
Table 1--Well construction information for the multi-level observation wells at Deerfield.
| Well No. | Borehole radius1 | Casing radius | Total depth2 | Screened interval | Grout interval3 |
|---|---|---|---|---|---|
| 1 | 0.250 | 0.103 | 3384 | 326-336 | 0-316 |
| 2 | 0.250 | 0.103 | 249 | 239-249 | 0-234 |
| 3 | 0.250 | 0.103 | 144 | 134-144 | 0-123 |
| 4 | 0.312 | 0.168 | 68 | 60-68 | 0-48 |
| 5 | 0.312 | 0.168 | 46 | 36-46 | 0-35 |
|
1 Units for information in this and remaining columns are ft. 2 Depths are from top of casing in this and remaining columns. The top of the casing is approximately 2 ft above land surface. 3 Neat cement grout 4 Depth includes a sump at bottom of screen |
|||||
The site is located at the edge of the alluvial valley of the Arkansas River. The shallowest well is in alluvial terrace deposits. The lithology of the High Plains aquifer at the site is characterized by a substantial amount of fine-grained material, including many thick clay units, in comparison with other areas in the Arkansas River corridor. Figure 4 displays the general lithology of the well boreholes by colored intervals based on the geologic logs. Note the difference in the logging of the cuttings by the KGS in comparison with Clarke Well & Equipment. The gamma and conductivity logs tend to show a relatively large amount of variability in the sediments with depth (Appendix B). The bedrock is at a depth of 345 ft below the land surface.
Figure 4--Borehole lithology for the multi-level wells. Clark (C) or KGS (K) under each column refers to the driller and source of the well log.
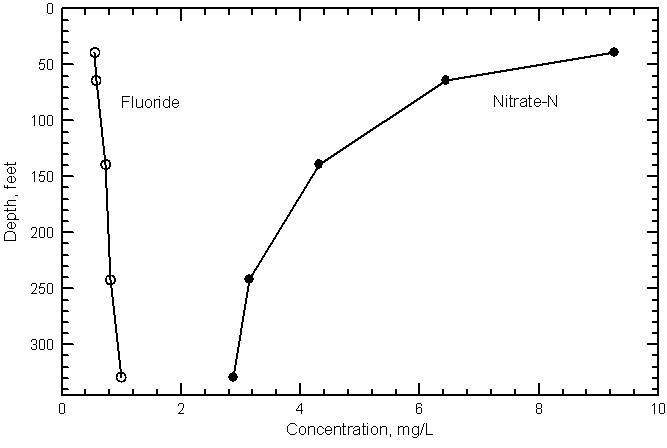
The total dissolved solids (TDS) concentrations for the well waters range from a little over 2,700 mg/L in the shallowest wells to 460 mg/L in the deepest well (Table 2). Except for the freshest, deepest water, sulfate is the dissolved constituent that contributes the greatest percentage of the TDS content. Concentrations of the major dissolved constituents calcium, magnesium, sodium, sulfate, and chloride are relatively similar in waters from the two shallowest wells and also decrease substantially with depth in the other well waters. Figure 5 shows the change in TDS, sulfate, and chloride concentrations with depth. The depths used in this and other figures in this report represent the middle of the screened interval. The nitrate concentration also decreases substantially with depth, whereas the fluoride content of the well waters approximately doubles from the shallowest wells to the deepest well (Figure 6).
Table 2--Chemical data for the observation wells at the Deerfield site. Sp.C. is specific conductance; TDS is total dissolved solids.
| KGS number | Project number | Well no. | Sample date | Sample time | Field Sp.C. | Lab Sp.C. | Lab pH | SiO2 mg/L | Ca mg/L | Mg mg/L | Na mg/L | K mg/L | Sr mg/L | HCO3 mg/L | SO4 mg/L | Cl mg/L | F mg/L | NO3-N mg/L | B mg/L | TDS mg/L |
|---|---|---|---|---|---|---|---|---|---|---|---|---|---|---|---|---|---|---|---|---|
| 980134 | UARK-251 | 1 | 4/8/98 | 14:00 | 680 | 147 | 22.4 | |||||||||||||
| 980133 | UARK-250 | 1 | 4/8/98 | 13:30 | 680 | 147 | 22.1 | |||||||||||||
| 980135 | UARK-252 | 1 | 4/8/98 | 14:30 | 683 | 8.30 | 22.8 | 53.7 | 29.0 | 42.2 | 5.1 | 1.51 | 192 | 147 | 22.4 | 1.08 | 3.0 | 0.16 | 433 | |
| 980159 | UARK-261 | 1 | 6/5/98 | 10:58 | 734 | 718 | 7.60 | 23.1 | 58.4 | 30.6 | 44.1 | 5.4 | 1.64 | 190 | 168 | 26.0 | 1.06 | 2.9 | 0.18 | 465 |
| 990103 | UARK-366 | 1 | 5/27/99 | 14:52 | 723 | 710 | 7.65 | 23.4 | 58.2 | 30.5 | 44.1 | 5.5 | 1.64 | 192 | 158 | 24.4 | 0.99 | 2.9 | 0.18 | 454 |
| 970187 | UARK-165 | 2 | 6/7/97 | 13:00 | 1420 | 1405 | 7.85 | 25.4 | 128 | 69.8 | 79.8 | 6.8 | 3.97 | 188 | 530 | 57.7 | 0.86 | 3.4 | 0.16 | 1010 |
| 980160 | UARK-262 | 2 | 6/4/98 | 20:47 | 1540 | 1480 | 7.60 | 25.6 | 140 | 77.5 | 84.0 | 7.6 | 4.24 | 188 | 588 | 59.9 | 0.85 | 3.3 | 0.19 | 1095 |
| 990104 | UARK-367 | 2 | 5/27/99 | 12:43 | 1530 | 1490 | 7.50 | 25.4 | 140 | 77.2 | 83.9 | 8.5 | 4.25 | 182 | 567 | 60.8 | 0.81 | 3.1 | 0.19 | 1072 |
| 970188 | UARK-166 | 3 | 6/8/97 | 14:03 | 2320 | 2270 | 7.80 | 26.5 | 219 | 122 | 156 | 8.9 | 7.44 | 209 | 1037 | 95.8 | 0.73 | 4.7 | 0.18 | 1797 |
| 980161 | UARK-263 | 3 | 6/4/98 | 19:33 | 2280 | 2200 | 7.60 | 26.0 | 209 | 118 | 156 | 9.7 | 6.98 | 209 | 971 | 90.3 | 0.75 | 4.4 | 0.26 | 1710 |
| 990105 | UARK-368 | 3 | 5/27/99 | 11:35 | 2300 | 2220 | 7.55 | 26.6 | 212 | 120 | 160 | 10.8 | 7.20 | 209 | 1016 | 92.3 | 0.73 | 4.3 | 0.25 | 1768 |
| 970189 | UARK-167 | 4 | 6/9/97 | 12:30 | 3440 | 3380 | 7.60 | 30.3 | 333 | 128 | 350 | 11.8 | 6.75 | 243 | 1673 | 137 | 0.57 | 4.9 | 0.37 | 2812 |
| 980162 | UARK-264 | 4 | 6/4/98 | 18:20 | 3470 | 3350 | 7.55 | 30.5 | 338 | 127 | 355 | 13.6 | 6.42 | 239 | 1622 | 133 | 0.54 | 5.3 | 0.48 | 2768 |
| 990106 | UARK-369 | 4 | 5/27/99 | 9:50 | 3380 | 3240 | 7.40 | 30.6 | 324 | 122 | 347 | 15.7 | 5.96 | 248 | 1597 | 134 | 0.57 | 6.4 | 0.51 | 2728 |
| 970190 | UARK-168 | 5 | 6/11/97 | 12:16 | 3520 | 3440 | 7.65 | 32.8 | 357 | 126 | 346 | 14.4 | 6.05 | 276 | 1676 | 151 | 0.54 | 7.4 | 0.44 | 2879 |
| 970217 | UARK-180 | 5 | 6/25/97 | 11:10 | 3520 | 3450 | ||||||||||||||
| 980163 | UARK-265 | 5 | 6/4/98 | 17:38 | 3340 | 3230 | 7.40 | 32.4 | 327 | 113 | 345 | 14.3 | 5.35 | 262 | 1521 | 135 | 0.54 | 7.6 | 0.51 | 2657 |
| 990107 | UARK-370 | 5 | 5/26/99 | 21:35 | 3380 | 3220 | 7.45 | 32.6 | 330 | 116 | 345 | 16.3 | 5.49 | 276 | 1545 | 142 | 0.55 | 9.3 | 0.49 | 2711 |
Figure 5--Chloride, sulfate, and total dissolved solids concentrations in waters pumped from the multi-level wells at the Deerfield site in 1999. The bottom of the graph represents the depth to bedrock.
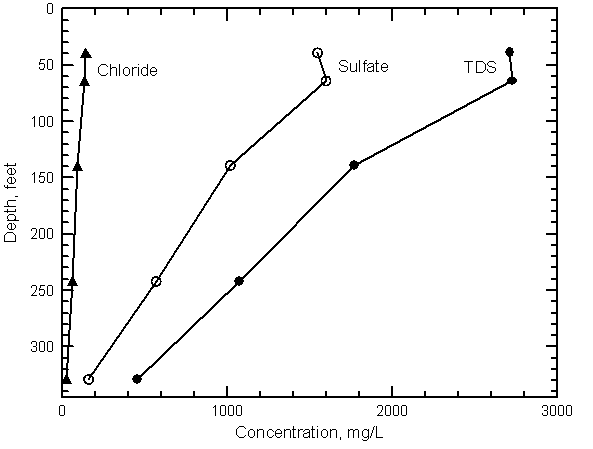
Figure 6--Fluoride and nitrate-nitrogen concentrations in waters pumped from the multi-level wells at the Deerfield site in 1999. The bottom of the graph represents the depth to bedrock.
Sodium concentrations are somewhat greater than calcium contents in waters from the shallowest two wells. The sodium concentration decreases with depth at a greater rate for well numbers 2 and 3 than for calcium. Bicarbonate contents decrease at a smaller rate with depth than the other major constituents to a level of about 190 mg/L in the two deepest well waters. Boron concentrations also decrease in the 3 shallowest well waters and then reach essentially the same contents in the two deepest wells.
The sulfate and TDS concentrations exceed the recommended level for drinking water of 250 mg/L and 500 mg/L, respectively, in waters from all the wells except the deepest one. The sulfate concentration in the shallowest two wells also exceeds the maximum recommended for stock use (1,000 mg/L). None of the other constituents exceeds standards for drinking, stock, or irrigation water use, although the nitrate-nitrogen content of the shallowest well is near the maximum contaminant level for drinking-water of 10 mg/L, and the fluoride concentration of the deepest well is essentially the same as the maximum level of 1 mg/L recommended for irrigation water use.
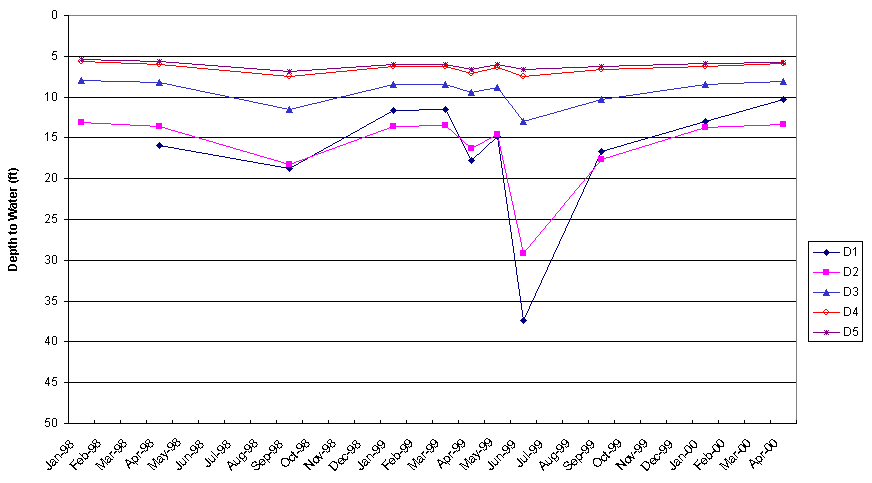
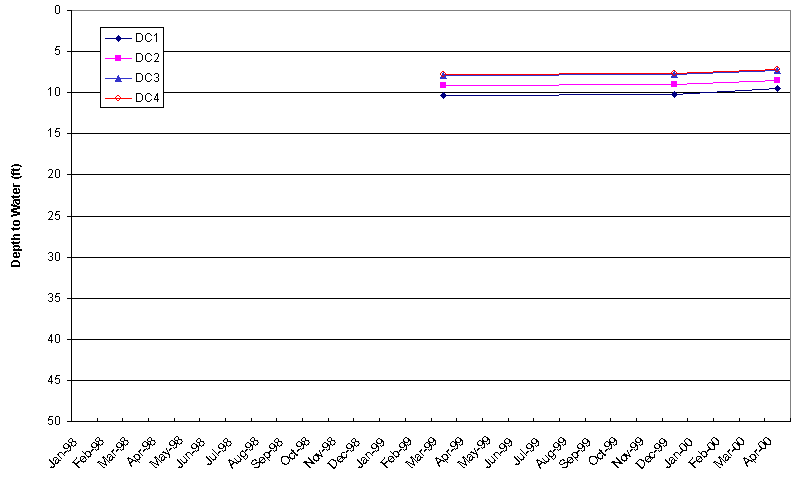
The KGS and the DWR have periodically measured water levels in the wells since installation (Table 3). Figure 7 displays the change in water levels with depth and time. In general, the deeper the well, the greater the depth to water and the greater the temporal variation in level. The shallowest two wells have nearly the same water level, although the deeper well consistently has a level the same or deeper than the shallower well. The middle well (#3) has a level that is always between those of the two shallower and two deeper wells. The relative depth to water levels in the two deepest wells changes with time. The relative direction of temporal change (up or down) in water level is essentially the same for all wells. The large water-level changes in the summer for the deepest two wells reflect the greater rate of pumping for irrigation and municipal use during that season in the area.
Table 3--Water-level data for the Deerfield observation well site. The values are depth to water below land surface.
| Date measured | Well 1 | Well 2 | Well 3 | Well 4 | Well 5 |
|---|---|---|---|---|---|
| 1/30/98 | 13.15 | 7.96 | 5.68 | 5.37 | |
| 4/16/98 | 15.95 | 13.61 | 8.21 | 6.01 | 5.68 |
| 9/21/98 | 18.80 | 18.29 | 11.55 | 7.50 | 6.85 |
| Jan-99 | 11.63 | 13.60 | 8.50 | 6.31 | 5.97 |
| 3/18/99 | 11.48 | 13.49 | 8.46 | 6.30 | 5.99 |
| 4/26/99 | 17.74 | 16.29 | 9.38 | 7.08 | 6.66 |
| 5/27/99 | 14.83 | 14.63 | 8.82 | 6.36 | 6.06 |
| 6/23/99 | 37.37 | 29.18 | 13.03 | 7.43 | 6.59 |
| 9/14/99 | 16.70 | 17.68 | 10.28 | 6.60 | 6.20 |
| 1/13/00 | 12.93 | 13.67 | 8.45 | 6.22 | 5.84 |
| 4/3/00 | 10.34 | 13.36 | 8.08 | 5.91 | 5.75 |
Figure 7--Change in water levels with depth and time at the Deerfield well site. Depths are below land surface.
The change in hydraulic head with depth indicates that there is a potential for downward flow of water at the site. The water levels in the shallowest three wells are always at a higher elevation than for the river and the alluvial aquifer adjacent to the river to the south. Except for parts of the summer, the water levels in the deepest wells are also at a higher elevation than for the river and in the adjacent alluvium to the south. The deepest observation well is screened within a permeable aquifer unit that lies within the same depth range as for the screened interval of the highest capacity well (and the one most frequently pumped) of the three municipal wells in Deerfield. This Deerfield well is located 1/4 mile to the north of the observation well site and yields water with a sulfate concentration that is about two or more times that of water in the deepest observation well. The hydraulic head and water-quality data indicate that the primary source of salinity affecting the aquifer at the observation well site in Deerfield is from Arkansas River diverted from the river to areas to the west and north of the site, rather than water that infiltrated from the river channel into the aquifer to the south. The canal of the Great Eastern Ditch passes through Deerfield just south of the largest capacity municipal well of the city and to the north of the observation well site.
The salinity decrease with depth for the aquifer waters at the observation well site is almost linear. The decrease fits a process of slow downward migration of saline water and mixing with the deeper, fresher water. The migration is retarded by the substantial amount of clay in the aquifer in the area. Salinity that had already penetrated into the aquifer in nearby areas could also reach the site by lateral migration through the most permeable zones. The subregional direction of ground-water flow is generally to the east in the Deerfield area. The salinity of water from the deepest observation well is somewhat greater than that of the water supply of Deerfield before it began to become impacted in the mid-1970's by migration of the diverted river water. The deepest observation well has a sulfate content of about 160 mg/L in comparison with the 95-120 mg/L range for the municipal well water of Deerfield during 1949-1973. The different shape of the change in nitrate concentration with depth (Figure 6) in comparison with that of the sulfate and TDS change (Figure 5), and the generally low concentration of nitrate in Arkansas River water (usually less than 3 mg/L), suggest that the source of higher shallow nitrate is local and at or near the surface.
Changes in the concentration of TDS and the major constituents during monitoring generally have not been great enough to be of significance for the wells. Small decreases in the salinity of the waters from the two shallowest wells might represent such effects as increased rainwater recharge during the period on water quality, the effect of ground-water flow in response to hydraulic head relationships at the site, and leakage of less saline water in the irrigation canal during the last few years of higher river flows from Colorado in comparison with several years earlier.
The observation well site at Garden City is located in the southern part of the city approximately 1/4 mile to the south of the Arkansas River and about 100 yds to the east of Highway 83 (Figure 8). There are five wells screened at different depths in the High Plains aquifer (Table 4 and Figure 9). The Kansas Geological Survey (KGS) installed the three shallowest wells in June 1997. Clarke Well & Equipment installed the two deepest wells in February 1998.
Figure 8--Map location of the observation well site west of Garden City, Finney County.
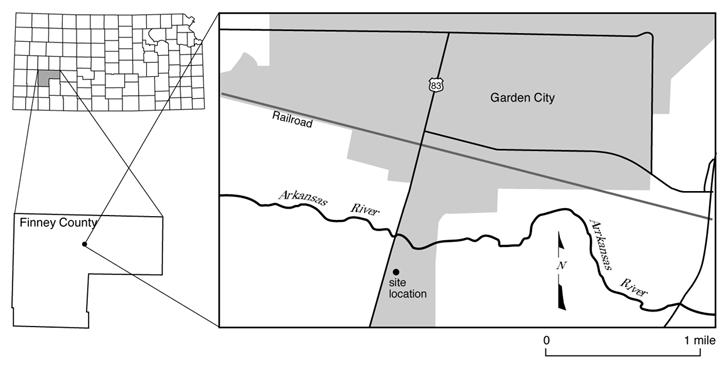
Figure 9--Schematic representation of the observation wells at the Garden City site. Substantial clay layers are shown that represent less permeable zones between the screened intervals.
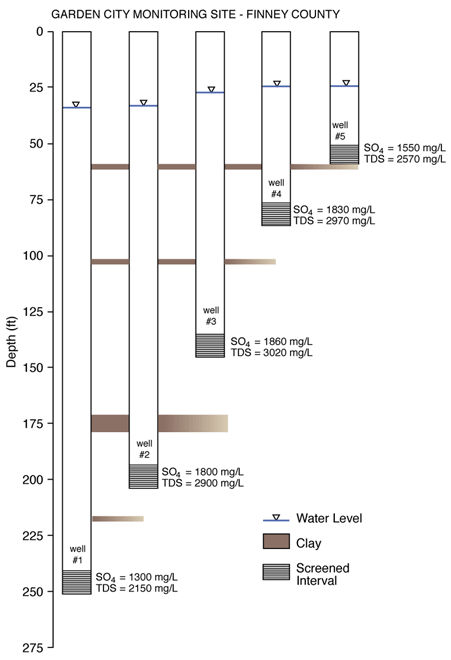
Table 4--Well construction information for the multi-level observation wells at Garden City.
| Well No. | Borehole radius1 | Casing radius | Total depth2 | Screened interval | Grout interval3 |
|---|---|---|---|---|---|
| 1 | 0.250 | 0.103 | 2514 | 239-249 | 0-229 |
| 2 | 0.250 | 0.103 | 209 | 197-207 | 0-188 |
| 3 | 0.312 | 0.103 | 147 | 137-147 | 0-134 |
| 4 | 0.312 | 0.168 | 88 | 78-88 | 0-74 |
| 5 | 0.458 | 0.168 | 61 | 53-61 | 0-51 |
|
1 Units for information in this and remaining columns are
ft. 2 Depths are from top of casing in this and remaining columns. The top of the casing is approximately 2 ft above land surface. 3 Neat cement grout 4 Depth includes a sump at bottom of screen |
|||||
The site is located within the alluvial valley of the Arkansas River. The shallowest well is screened just below the coarse alluvium. The lithology of the Ogallala part of the High Plains aquifer at the site is characterized by a substantial amount of silt, sand, and fine gravel but not substantial clay units as are at the Deerfield site. Figure 4 displays the general lithology of the well boreholes by colored intervals based on the geologic logs. Note the difference in the logging of the cuttings by the KGS in comparison with Clarke Well & Equipment. The gamma log does not show much variability below 15 ft in comparison with the conductivity log (Appendix B). The bedrock is at a depth of about 270 ft below the land surface based on the lithologic log of the deepest of two test holes drilled by the USGS (Meyer et al., 1969, 1970) in 1961 within 150 yds to the northwest of the site.
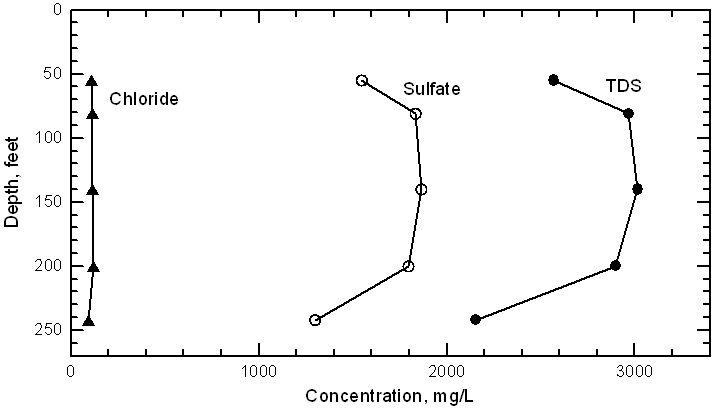
The TDS concentrations for the well waters range from near 3,000 mg/L in the middle three wells (in depth) to about 2,200 mg/L in the deepest well (Table 5). Sulfate is the dissolved constituent that contributes the greatest percentage of the TDS content in all of the well waters; its depth distribution is similar to that of TDS (Figure 10). Although the depth distribution of sodium content is also relatively similar to that of sulfate and TDS, the patterns of calcium and magnesium are slightly different. Sodium concentrations are close to the calcium contents in waters from the shallowest well. The sodium concentration is greater than the calcium in the next two deeper wells but is smaller than the calcium content of waters from the two deepest wells. The data suggest that cation exchange altered the concentrations as saline waters migrated through the sediments of the aquifer.
Table 5--Chemical data for the observation wells at the Garden City site. Sp.C. is specific conductance; TDS is total dissolved solids.
| KGS number | Project number | Well no. | Sample date | Sample time | Field Sp.C. | Lab Sp.C. | Lab pH | SiO2 mg/L | Ca mg/L | Mg mg/L | Na mg/L | K mg/L | Sr mg/L | HCO3 mg/L | SO4 mg/L | Cl mg/L | F mg/L | NO3-N mg/L | B mg/L | TDS mg/L |
|---|---|---|---|---|---|---|---|---|---|---|---|---|---|---|---|---|---|---|---|---|
| 980023 | UARK-242 | 1 | 2/12/98 | 14:00 | 2850 | 2770 | 7.75 | 25.2 | 384 | 75.5 | 223 | 1.1 | 4.08 | 197 | 1378 | 101 | 2.0 | 2298 | ||
| 980164 | UARK-266 | 1 | 6/4/98 | 15:45 | 2730 | 2640 | 7.20 | 24.6 | 363 | 71.7 | 219 | 6.7 | 3.84 | 198 | 1340 | 102 | 0.36 | 2.0 | 0.15 | 2238 |
| 990046 | UARK-354 | 1 | 3/18/99 | 9:28 | 2660 | 2560 | 7.20 | 24.3 | 336 | 66.4 | 216 | 7.5 | 3.49 | 199 | 1298 | 94.2 | 0.37 | 2.2 | <0.2 | 2154 |
| 980024 | UARK-243 | 2 | 2/11/98 | 14:58 | 3630 | 3500 | 7.80 | 24.5 | 481 | 83.8 | 330 | 1.4 | 4.40 | 198 | 1844 | 124 | 2.1 | 3001 | ||
| 980165 | UARK-267 | 2 | 6/4/98 | 14:44 | 3520 | 3400 | 7.40 | 24.6 | 465 | 82.1 | 323 | 7.5 | 4.22 | 198 | 1862 | 123 | 0.30 | 2.1 | 0.29 | 2999 |
| 990047 | UARK-355 | 2 | 3/18/99 | 11:16 | 3440 | 3300 | 7.00 | 23.9 | 441 | 77.5 | 320 | 8.2 | 3.91 | 202 | 1795 | 119 | 0.31 | 2.2 | <0.2 | 2899 |
| 970218 | UARK-181 | 3 | 6/29/97 | 11:00 | 3470 | 3400 | 7.60 | 23.2 | 382 | 79.3 | 414 | 6.0 | 2.99 | 236 | 1685 | 119 | 0.36 | 2.0 | 0.42 | 2837 |
| 980166 | UARK-268 | 3 | 6/4/98 | 13:54 | 3690 | 3570 | 7.60 | 23.3 | 397 | 89.1 | 435 | 6.9 | 3.22 | 229 | 1832 | 126 | 0.33 | 2.1 | 0.54 | 3035 |
| 990048 | UARK-356 | 3 | 3/18/99 | 13:06 | 3670 | 3520 | 7.20 | 22.5 | 375 | 85.2 | 422 | 7.9 | 3.03 | 225 | 1864 | 115 | 0.34 | 2.0 | 0.52 | 3015 |
| 970219 | UARK-182 | 4 | 6/29/97 | 10:10 | 3760 | 3690 | 7.60 | 17.5 | 340 | 138 | 452 | 7.8 | 4.80 | 247 | 1868 | 127 | 0.65 | 2.1 | 0.54 | 3088 |
| 980167 | UARK-269 | 4 | 6/4/98 | 12:06 | 3910 | 3760 | 7.60 | 18.6 | 354 | 148 | 452 | 9.2 | 4.91 | 238 | 1988 | 133 | 0.65 | 2.2 | 0.64 | 3236 |
| 990049 | UARK-357 | 4 | 3/18/99 | 15:32 | 3640 | 3500 | 7.20 | 17.9 | 302 | 131 | 430 | 9.8 | 4.18 | 232 | 1833 | 114 | 0.66 | 1.9 | 0.58 | 2966 |
| 970300 | UARK-205 | 5 | 7/23/97 | 11:50 | 3420 | 3320 | 7.45 | 22.1 | 348 | 104 | 367 | 6.4 | 3.30 | 250 | 1672 | 122 | 0.40 | 3.1 | 0.39 | 2783 |
| 980168 | UARK-270 | 5 | 6/4/98 | 11:10 | 3300 | 3170 | 7.30 | 25.2 | 354 | 86.3 | 348 | 7.0 | 2.76 | 242 | 1587 | 117 | 0.32 | 3.3 | 0.43 | 2662 |
| 990050 | UARK-358 | 5 | 3/18/99 | 17:12 | 3180 | 3050 | 7.25 | 23.8 | 330 | 83.6 | 344 | 7.9 | 2.58 | 228 | 1547 | 106 | 0.36 | 2.5 | 0.39 | 2569 |
Figure 10--Chloride, sulfate, and total dissolved solids concentrations in waters pumped from the multi-level wells at the Garden City site in 1999. The bottom of the graph represents the depth to bedrock. The axes distances are the same per foot and mg/L as in Figure 5.
Nitrate and fluoride concentrations do not change substantially with depth (Figure 11). The nitrate-nitrogen content of the shallowest well water is the highest for the site (in the range 2.5-3.3 mg/L during the monitoring), but is not much greater than the concentrations for the deeper wells (1.9-2.2 mg/L). Bicarbonate contents are relatively similar in the three shallowest wells and decrease to about 200 mg/L in waters from the deepest two wells. Boron concentrations first increase then decrease in depth in a pattern similar to that for sodium and sulfate.
Figure 11--Fluoride and nitrate-nitrogen concentrations in waters pumped from the multi-level wells at the Deerfield site in 1999. The bottom of the graph represents the depth to bedrock. The axes distances are the same per foot and mg/L as in Figure 6.
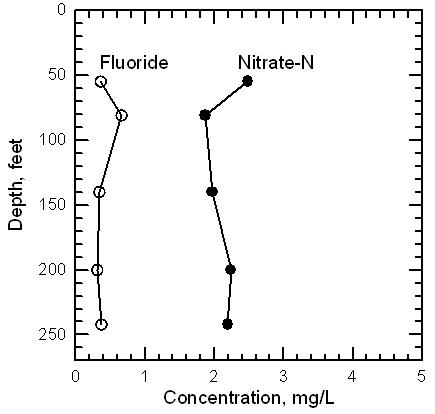
The sulfate and TDS concentrations substantially exceed the recommended levels for drinking water of 250 mg/L and 500 mg/L, respectively, in waters from all the wells. The sulfate concentration in all the well waters also exceeds the maximum recommended for stock use (1,000 mg/L). None of the other constituents exceeds or is close to standards for drinking, stock, or irrigation water use.
The KGS and the DWR have periodically measured water levels in the wells since installation (Table 6). Figure 12 displays the change in water levels with depth and time. For all measurements, the deeper the well, the greater the depth to water. The average difference between the water levels in the shallowest and deepest wells is about the same as that for most of the measurement period for the Deerfield site. Water levels in the three shallowest wells at Garden City vary by about the same amount with time. The temporal variations in the water levels of the deepest two wells are very similar and are substantially greater than the water-level variations in the shallower wells. The water levels in the middle well (#3) are consistently between the levels of all the other wells. The middle zone appears to represent a transition to the substantially deeper water levels of the lowermost 100 ft of the High Plains aquifer at the site. The relative direction of temporal change (up or down) in water level is the same for all wells, indicating a great enough hydraulic connection throughout the aquifer to produce responses to changes at all levels. The largest water-level changes are in the summer and reflect the greater rate of pumping for irrigation and municipal use during that season in the area.
Figure 12--Change in water levels with depth and time at the Garden City well site. Depths are below land surface.
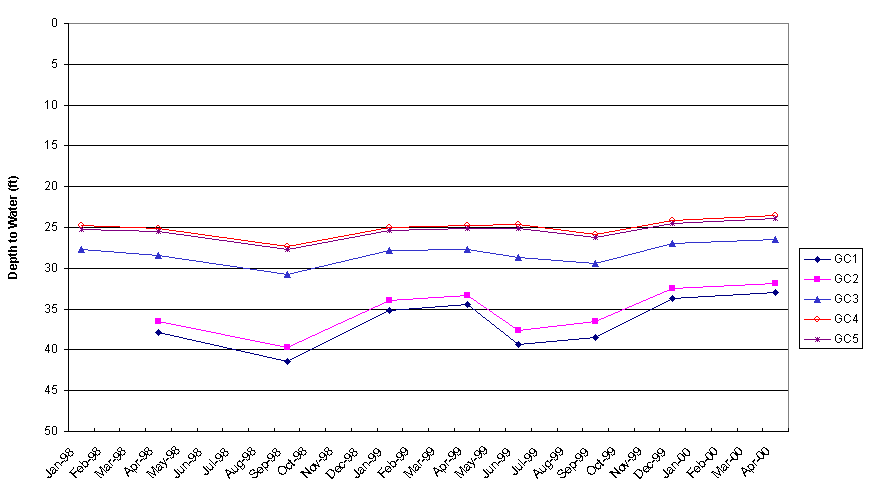
Table 6--Water-level data for the Garden City observation well site. The values are depth to water below land surface.
| Date measured | Well 1 | Well 2 | Well 3 | Well 4 | Well 5 |
|---|---|---|---|---|---|
| 1/27/98 | 27.70 | 24.81 | 25.19 | ||
| 4/15/98 | 37.86 | 36.46 | 28.48 | 25.15 | 25.52 |
| 9/23/98 | 41.47 | 39.72 | 30.80 | 27.38 | 27.74 |
| Jan-99 | 35.18 | 33.91 | 27.86 | 25.01 | 25.36 |
| 4/26/99 | 34.45 | 33.31 | 27.68 | 24.77 | 25.13 |
| 6/23/99 | 39.32 | 37.64 | 28.70 | 24.67 | 25.15 |
| 9/15/99 | 38.48 | 36.47 | 29.37 | 25.82 | 26.17 |
| 12/28/99 | 33.73 | 32.44 | 27.00 | 24.12 | 24.51 |
| 4/5/00 | 32.93 | 31.85 | 26.43 | 23.55 | 23.95 |
The change in hydraulic head with depth indicates that there is a continuous potential for downward flow of water throughout the aquifer at the site. The difference in head between the shallowest and deepest wells is greatest during the summer. The head gradient, the proximity of the site to the Arkansas River, and the presence of freshwater to the southwest and south of the area clearly indicate that the source of the salinity is from infiltration of saline river water from the channel into the alluvium and thence into the main part of the High Plains aquifer.
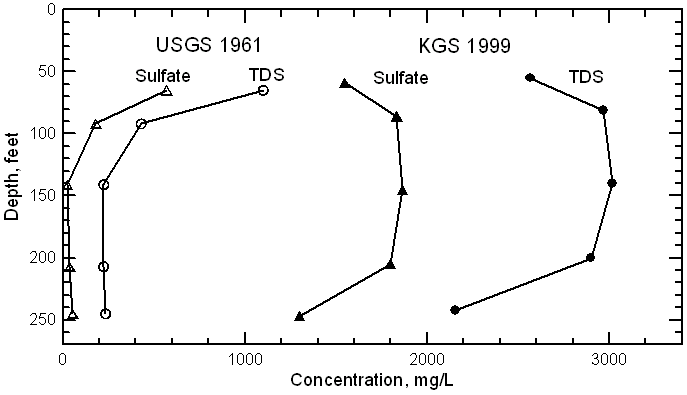
Figure 13 illustrates the contrast between the water quality in the High Plains aquifer in the local area in 1961 and 1999. In 1961, the USGS drilled two test holes and collected samples at a total of 5 depths at a location within 150 yds of the Garden City well site. Only the ground water at the shallowest depth sampled in 1961 was slightly saline; the rest of the test-hole depths yielded freshwaters. Sulfate concentrations in the lower part of the High Plains aquifer were in the range 24-52 mg/L in 1961. By 1997 (Table 5), water in the entire saturated thickness of the aquifer had become saline. From 1961 to 1997, sulfate and TDS concentrations increased by about 2.8 and 2.3 times, respectively, at the depth of the shallowest USGS test hole and KGS well, and up to 70 and over 13 times, respectively, in the lower aquifer.
Figure 13--Sulfate and total dissolved solids concentrations in waters from test holes drilled by the USGS in 1961 and pumped from the multi-level wells at the Garden City site in 1999. The bottom of the graph represents the depth to bedrock. The axes dimensions are the same as in Figure 10. The depths plotted for the USGS test holes represent the middle of a 5-foot interval from the reported depth of the hole, with is the assumed zone from which the water flowed.
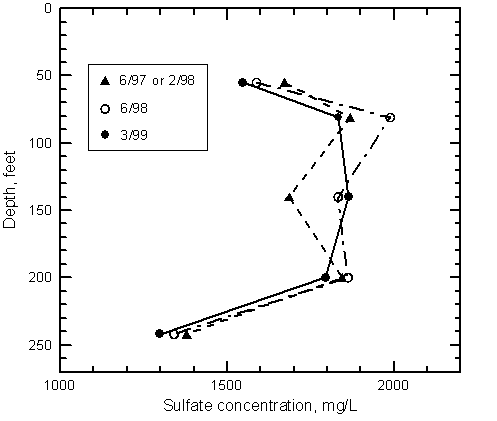
Changes in the water quality of the observation wells at the Garden City site appear to be significant during the 1997 to 1999 period, particularly in the shallow to middle parts of the aquifer (Figure 14). The decrease in the salinity in the shallowest well could reflect the influence of river seepage during high flow events of the mid- to late 1990's. Higher river flows have generally contained lower dissolved solids concentrations. Prior to 1995, there had not been substantial high flows for several years. The lower salinity of the water in the shallowest well than deeper in the aquifer probably reflects the decrease in the average salinity of the river water that has been infiltrating to the aquifer over the last decade. The decrease from 1997 to 1999 in the water from well #5 reflects the continuation of this trend. The increase, then decrease in the salinity of water from well #4, and the increase for well #3 might indicate the downward movement of more saline water that had infiltrated into the aquifer in the late 1980's and early 1990's, and had reached the zone between wells #1 and #2. Waters from the two deepest wells decreased slightly in salinity during 1997-1999. The decrease is not believed to be an artifact of remnant, more saline water from shallower depths during drilling because development and pumping have removed over 1,500 gal of water from each well. The small decrease might reflect the impact of changes in the relative hydraulic heads with time on the lateral movement of water in those zones.
Figure 14--Sulfate concentration in waters pumped from wells at the Garden City site at different times. The bottom of the graph represents the depth to bedrock.
The observation well site at Dodge City is located about 3 miles west of the city and approximately 1/4 mile to the south of the Arkansas River (Figure 15). There are four wells screened at different depths in the alluvial and main portions of the High Plains aquifer (Table 7 and Figure 16). Clarke Well & Equipment, Inc. installed all of the wells in November 1998.
Figure 15--Map location of the observation well site west of Dodge City, Ford County.
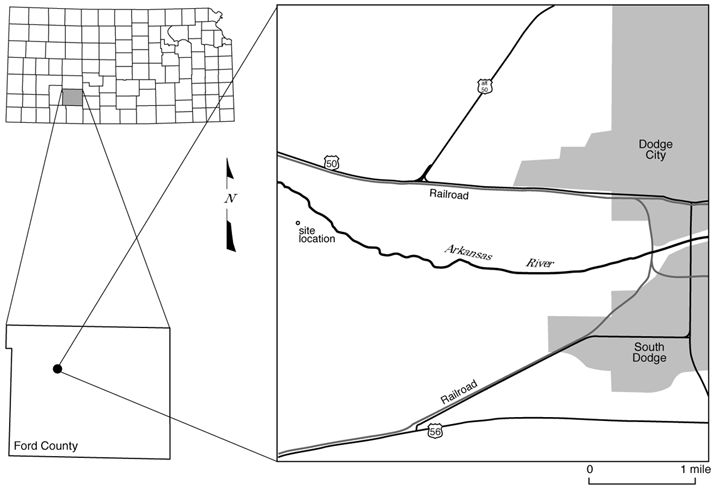
Table 7--Well construction information for the multi-level observation wells at Dodge City.
| Well No. | Borehole radius1 | Casing radius | Total depth2 | Screened interval | Grout interval3 |
|---|---|---|---|---|---|
| 1 | 0.281 | 0.103 | 1674 | 155-165 | 0-145 145-150 |
| 2 | 0.281 | 0.103 | 120 | 106-116 | 0-87 87-92 |
| 3 | 0.281 | 0.103 | 76 | 68-74 | 0-51 51-56 |
| 4 | 0.281 | 0.168 | 38 | 31-36 | 0-265 |
|
1 Units for information in this and remaining columns are
ft. 2 Depths are from top of casing in this and remaining columns. The top of the casing is approximately 2 ft above land surface. 3 First range is for neat cement grout, second range is for bentonite pellet (Holeplug) 4 Depth includes a sump at bottom of screen 5 Only bentonite pellets used at this well |
|||||
Figure 16--Schematic representation of the observation wells at the Dodge City site. Substantial clay layers are shown that represent less permeable zones.
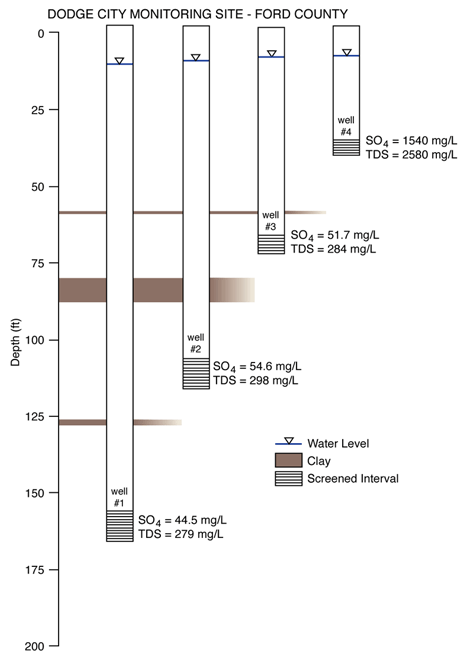
The site is located within the alluvial valley of the Arkansas River. The shallowest well is screened in the coarse sand and gravel alluvium just above a clayey zone that underlies the alluvium in the area. The lithology of the Ogallala part of the High Plains aquifer at the site is characterized by a zone including some permeable sediments with substantial amounts of fine-grained material from about 70 to 125 ft below the surface and predominantly sands and gravels in the lowermost portion. The depth to bedrock (166 ft) at the site is much shallower than at the Deerfield and Garden City sites. Figure 4 displays the general lithology of the well boreholes by colored intervals based on the geologic logs. The gamma log does not show much variability below 15 ft but does generally indicate that the sediments below 110 ft have less clay than above that depth (Appendix B). The conductivity log does not display as much variability as for the Deerfield and Garden City sites. The conductivity generally decreases with depth and shows the prominent clay zones in the middle of the strata.
The TDS concentrations for the well waters range from over 2,500 mg/L in the well screened in the alluvium to less than 300 mg/L in the underlying part of the High Plains aquifer (Table 8). Sulfate is the dissolved constituent that is highest in concentration in the water of the alluvial aquifer, whereas bicarbonate is the constituent that is greatest in the underlying aquifer. The depth distributions of TDS, sulfate, and chloride concentrations (Figure 17) show the large change in salinity from the alluvium to the main aquifer. The concentrations of calcium, magnesium, sodium, potassium, strontium, and boron are all much larger in the alluvial aquifer water than in the main portion of the High Plains aquifer. The bicarbonate and fluoride concentrations have only a small decrease with depth from the alluvial to the main High Plains aquifer. The nitrate content of the main part of the High Plains aquifer is greater than in the alluvium (Figure 18). The nitrate-nitrogen increases with depth to nearly 4 mg/L in the water from well #3. The concentration of nitrate-nitrogen in the alluvial aquifer, about 2 mg/L, is close to the average for Arkansas River water in southwest Kansas.
Figure 17--Chloride, sulfate, and total dissolved solids concentrations in waters pumped from the multi-level wells at the Deerfield site in 1999. The bottom of the graph represents the depth to bedrock.
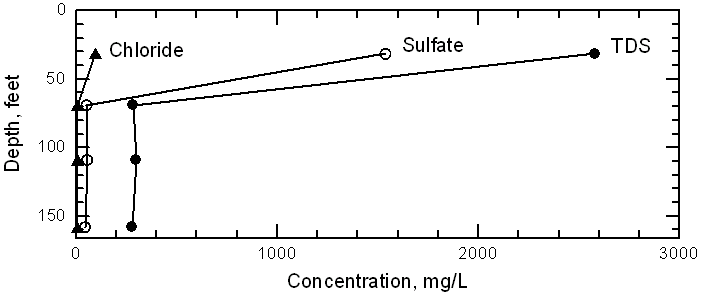
Figure 18--Fluoride and nitrate-nitrogen concentrations in waters pumped from the multi-level wells at the Dodge City site in 1999. The bottom of the graph represents the depth to bedrock. The axes distances are the same per foot and mg/L as in Figures 6 and 11.
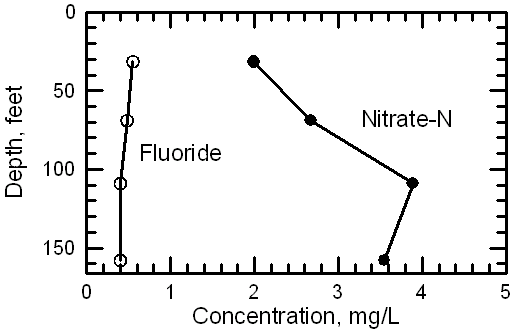
Table 8--Chemical data for the observation wells at the Dodge City site. Sp.C. is specific conductance; TDS is total dissolved solids.
| KGS number | Project number | Well no. | Sample date | Sample time | Field Sp.C. | Lab Sp.C. | Lab pH | SiO2 mg/L | Ca mg/L | Mg mg/L | Na mg/L | K mg/L | Sr mg/L | HCO3 mg/L | SO4 mg/L | Cl mg/L | F mg/L | NO3-N mg/L | B mg/L | TDS mg/L |
|---|---|---|---|---|---|---|---|---|---|---|---|---|---|---|---|---|---|---|---|---|
| 980376 | UARK-323 | 1 | 11/13/98 | 10:10 | 443 | 438 | 7.40 | 24.7 | 57.2 | 9.0 | 20.1 | 2.9 | 0.60 | 200 | 37.8 | 7.1 | 0.42 | 3.7 | 0.039 | 275 |
| 990042 | UARK-350 | 1 | 3/17/99 | 13:29 | 449 | 438 | 7.40 | 23.9 | 57.3 | 9.1 | 18.8 | 2.9 | 0.63 | 200 | 44.5 | 7.4 | 0.40 | 3.5 | 0.037 | 279 |
| 980377 | UARK-324 | 2 | 11/13/98 | 14:15 | 464 | 462 | 7.40 | 25.1 | 59.7 | 9.4 | 20.0 | 3.3 | 0.63 | 197 | 49.4 | 7.7 | 0.41 | 3.8 | 0.046 | 289 |
| 990043 | UARK-351 | 2 | 3/17/99 | 15:11 | 467 | 457 | 7.40 | 24.5 | 64.0 | 9.5 | 20.5 | 2.7 | 0.61 | 195 | 54.6 | 8.2 | 0.40 | 3.9 | 0.039 | 298 |
| 980378 | UARK-325 | 3 | 11/13/98 | 17:25 | 455 | 448 | 7.80 | 24.4 | 54.5 | 9.8 | 23.0 | 2.8 | 0.62 | 196 | 50.6 | 7.6 | 0.45 | 2.6 | 0.046 | 282 |
| 990044 | UARK-352 | 3 | 3/17/99 | 16:28 | 446 | 438 | 7.55 | 23.9 | 57.4 | 10.4 | 21.8 | 2.5 | 0.62 | 194 | 51.7 | 7.5 | 0.48 | 2.7 | 0.038 | 284 |
| 980379 | UARK-326 | 4 | 11/13/98 | 17:00 | 2930 | 2870 | 1362 | 92.0 | 2.2 | |||||||||||
| 980381 | UARK-328 | 4 | 11/17/98 | 2860 | 7.35 | 23.9 | 310 | 78.0 | 308 | 9.1 | 2.42 | 230 | 1458 | 94.6 | 0.56 | 2.2 | 0.46 | 2408 | ||
| 990045 | UARK-353 | 4 | 3/17/99 | 18:00 | 3040 | 2890 | 7.20 | 24.4 | 352 | 85.8 | 345 | 8.4 | 2.48 | 239 | 1538 | 96.9 | 0.55 | 2.0 | 0.36 | 2580 |
The sulfate and TDS concentrations substantially exceed the recommended levels for drinking water of 250 mg/L and 500 mg/L, respectively, in water from the alluvial aquifer. The sulfate concentration in the alluvial water also exceeds the maximum recommended for stock use (1,000 mg/L). None of the other constituents in the alluvial or other wells exceeds or is close to standards for drinking, stock, or irrigation water use.
The proximity of the site to the Arkansas River, the coarse nature of the alluvial sediments, and the presence of freshwater at depth and to the southwest and south of the area clearly indicate that the source of the salinity is from infiltration of saline river water from the channel into the alluvium.
The KGS and the DWR have periodically measured water levels in the wells since installation (Table 9). Figure 19 displays the change in water levels with depth and time. The water levels in the two shallowest wells have remained about the same for a given date during the measurement period. The magnitude of the difference between the water levels in the two shallowest wells and the deepest well is substantially smaller than for shallow and deep parts of the aquifer at the Deerfield and Garden City sites. Temporal variations in the water levels have been very small, although there is a possibility that there could be greater variations during the periods of no data.
Table 9--Water-level data for the Dodge City observation well site. The values are depth to water below land surface.
| Date measured | Well 1 | Well 2 | Well 3 | Well 4 |
|---|---|---|---|---|
| 3/18/99 | 10.37 | 9.18 | 7.96 | 7.80 |
| 12/27/99 | 10.27 | 8.97 | 7.80 | 7.66 |
| 4/7/00 | 9.48 | 8.54 | 7.35 | 7.20 |
Figure 19--Changes in water levels with depth and time at the Dodge City well site. Depths are below land surface.
The change in hydraulic head with depth from the shallowest well to the aquifer bottom indicates that there is a potential for downward flow of water from the alluvium into the main part of the underlying High Plains aquifer. However, the gradient is small so any vertical flow would also be expected to be small. The similar direction of water-level change in all the wells during the measurement period suggests that there is hydraulic connection across the aquifer zones. The relatively small difference in the water levels in the alluvium well and the uppermost well in the High Plains aquifer indicates that a drop from a high to a low stage in the river level might possibly cause reversal of the gradient across the zone separating the two shallowest wells. There is a sharp gradient in salinity from the alluvial aquifer to the underlying main part of the High Plains aquifer. There are only about 20 ft between the bottom of the gravel pack of well #4 and the top of the gravel pack of well #3. The sharp salinity contrast suggests that the permeability of the zone must be so much smaller than that of the alluvium that it effectively retards the downward movement of the salinity below the alluvium.
The saline water in the alluvial aquifer could mainly represent the period since 1995 when substantial flows of the Arkansas River has passed the site. During periods of no flow, it may have been possible for local recharge to substantially dilute older saline water in the alluvium. The similar water quality within the main part of the High Plains aquifer indicates that older saline water that probably entered the alluvium in the past was not able to penetrate into the underlying aquifer. The movement of saline water from the river into and through the coarse alluvium during high river stage, and then discharge out of the alluvium to the river channel during very low flow, may be so much faster than downward movement that it has not significantly impacted the water quality of the underlying aquifer. In addition, local areal recharge of rainwater into the alluvial aquifer could cause flushing of the saline water to the river during low or no flow periods.
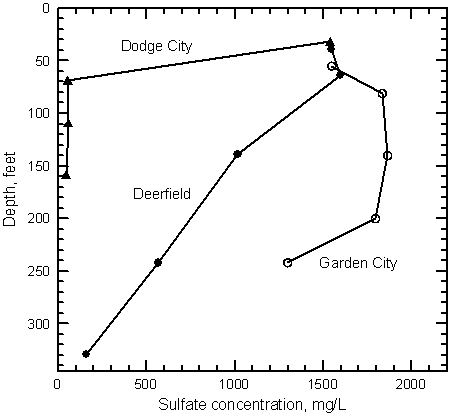
The results from each of the sites with multi-level observation wells show different patterns that depend largely on the hydrogeological characteristics of each area, as well as on use of Arkansas River water. The sulfate concentration change with depth for all sites (Figure 20) illustrates similarities and contrasts in the distribution of aquifer salinity. The shallow aquifer at all sites contains water with a sulfate concentration between 1,500 and 1,600 mg/L, which represents mixture of Arkansas River water with ground-water in the shallow aquifer. The changes with depth at the sites diverge below the shallow aquifer as indicated by a sharp decrease in salinity at Dodge City to a gradual decrease at Deerfield to penetration of salinity throughout the aquifer at Garden City.
Figure 20--Sulfate concentration in waters pumped from all of the multi-level wells at the Deerfield, Garden City sites in 1999. The bottom of the graph represents the depth to bedrock at the Deerfield site.
The data for the Deerfield location indicate that saline Arkansas River water has infiltrated to all parts of the High Plains aquifer at the location, but that the substantial amount of clays in the subsurface appreciably retard the downward movement of the salinity. The source of the saline river water affecting the aquifer at Deerfield is not directly from the river channel about a mile south of the site, but from the river water diverted to the west and north of the site. The retardation by the clay layers in the aquifer strata indicate that saline water flow down the unsealed gravel packs of large diameter wells, such as used for irrigation, could be relatively more important for downward transport of local salinity than in areas without thick clays. The downward hydraulic gradient at the site continues to provide a drive for downward migration of saline water. Thus, the deeper aquifer, which still contains freshwater, can be expected to slowly increase in salinity in the future.
The High Plains aquifer at the Garden City site, located about 1/4 mile south of the Arkansas River, contains sediments that are generally more permeable than those at the Deerfield site. USGS test-hole data for a location very near the site showed that only the shallow alluvial aquifer contained slightly saline water in 1961; the main aquifer yielded very fresh water. Today, the water in the alluvial aquifer is much more saline than in 1961 and the shallow salinity has penetrated to the bottom of the aquifer. During the 1970's, the rate of ground-water declines in the High Plains aquifer in the region greatly increased as a result of large pumping withdrawals. The increased head difference between the upper and lower parts of the aquifer provided the drive for migration of shallow waters to deeper in the aquifer. The proximity of the Garden City site to the river water source, the head gradient, and the permeable sediments allowed the saline river water to penetrate into the aquifer at a faster rate than at Deerfield. Changes in the salinity of waters in the shallow and middle portions of the aquifer during 1997-1999 suggest that the ground-water quality is responding to variations in the salinity of the Arkansas River over the last couple decades.
The areal location of the Dodge City site relative to the Arkansas River is similar to that of the Garden City site. However, there is a sharp gradient from the saline water in the alluvium to the freshwater in the underlying main portion of the High Plains aquifer. Most of the present saline water in the alluvial aquifer could be seepage from the channel since the recent increases in flow starting in 1995. The coarse nature of the alluvium, the relatively low permeability of the sediment underlying the alluvium, and the small downward head gradient in the underlying aquifer are probably the main reasons why the saline water has not penetrated below the alluvial aquifer. Substantial declines in the water levels of the main aquifer might possibly lead to migration of salinity into the aquifer. The continued presence of substantial amounts of saline water in the river channel would also be needed to keep saline water in the alluvium, which would be available for the migration. These conditions could cause a result similar to what has occurred at the Garden City site. Management of aquifer water withdrawals should be important for protecting water quality in the main aquifer.
The difference in the character of the ground-water contamination at the Garden City and Dodge City sites suggests that there could be either a gradual transition, a marked change at some location, or variable conditions along the river valley between the sites in terms of migration of salinity from the alluvium to the underlying aquifer. There is a long-term, large loss of flow from the Arkansas River channel from the Garden City gaging station to that at Dodge City. Although some of this loss is evaporation from the river and transpiration by phreatophytes along the banks, most is seepage into the alluvium and then into the High Plains aquifer underlying the alluvium. The change in the river water available for the seepage along the valley is certainly an important factor over time that would fit a gradual change between the sites. However, the relative difference in hydraulic head between the river and the main aquifer, and the thickness of clays underlying the alluvium, could be such important factors that the salinity contamination could vary along the river valley. Because the hydrogeology of the system is fixed and Kansas has only limited control over the flows in the river, the main strategy for protection of freshwater in the High Plains aquifer must be management that minimizes the downward hydraulic gradient in the aquifer in the river corridor between Garden City and Dodge City.
Butler, J.J., Jr., and Healey, J.M., 1999, Performance and analysis of June 1998 and October 1999 slug tests in Kearny, Finney, and Ford counties, Kansas: Kansas Geological Survey, Open-file Report 99-8, 99 p. [available online]
Meyer, W.R., Gutentag, E.D., and Lobmeyer, D.H., 1969, Finney County basic data: U.S. Geological Survey, Open-file Report, 146 p. [available online]
Meyer, W.R., Gutentag, E.D., and Lobmeyer, D.H., 1969, Geohydrology of Finney County, southwestern Kansas: U.S. Geological Survey, Water-Supply Paper 1891, 117 p. [available online]
Well Construction Information Forms
Geophysical Logs: Gamma and Conductivity
Kansas Geological Survey
Placed online December 18, 2007
Comments to webadmin@kgs.ku.edu
The URL for this page is http://www.kgs.ku.edu/Hydro/UARC/MW-report.html